Microsoft SQL Server is a popular relational database management system that provides a wide range of performance and reliability features (e.g., AlwaysOn availability groups) to support business-critical applications. As your SQL Server workloads scale and increase in complexity, it can be difficult to monitor all of their components and pinpoint the exact issues that are degrading your databases’ performance.
Datadog Database Monitoring (DBM) provides deep visibility into your SQL Server instances so you can drill into slow queries and costly explain plans and then identify how they affect your databases’ performance. We’ve expanded DBM to collect additional telemetry for SQL Server to help you monitor tempdb, index usage, and more. Using DBM, you can inspect your normalized queries and track performance and resource usage trends—and you’re now able to gain similar insights at the stored procedure level.
In this post, we’ll explore how you can use DBM to:
Optimize SQL Server stored procedures
A stored procedure in SQL Server consists of one or more T-SQL statements that are executed as a single batch of code, which greatly reduces network traffic and execution latency. By creating stored procedures around frequently repeated database operations, you can reuse code and improve the maintainability of your codebase. Stored procedures also abstract permissions away from the object level and leverage parameterized queries to help protect against SQL injection attacks and bolster security. If your applications rely on stored procedures, you’ll need visibility into each procedure’s performance to quickly identify and resolve bottlenecks hampering your applications’ response times.
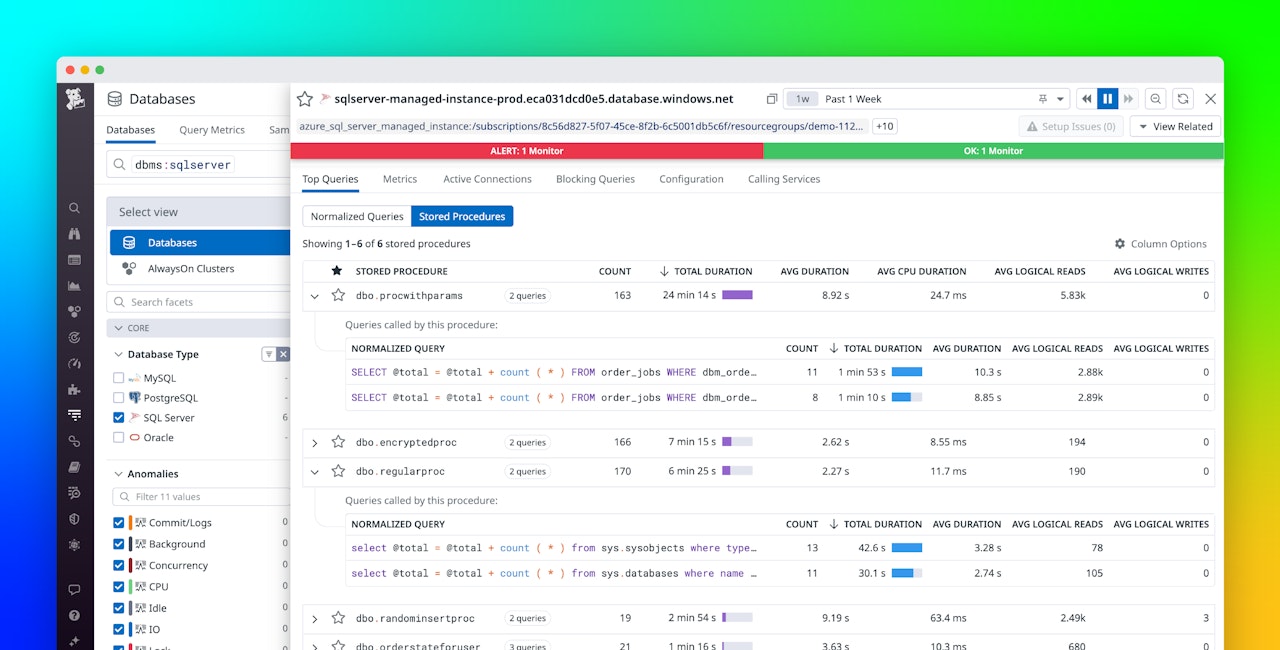
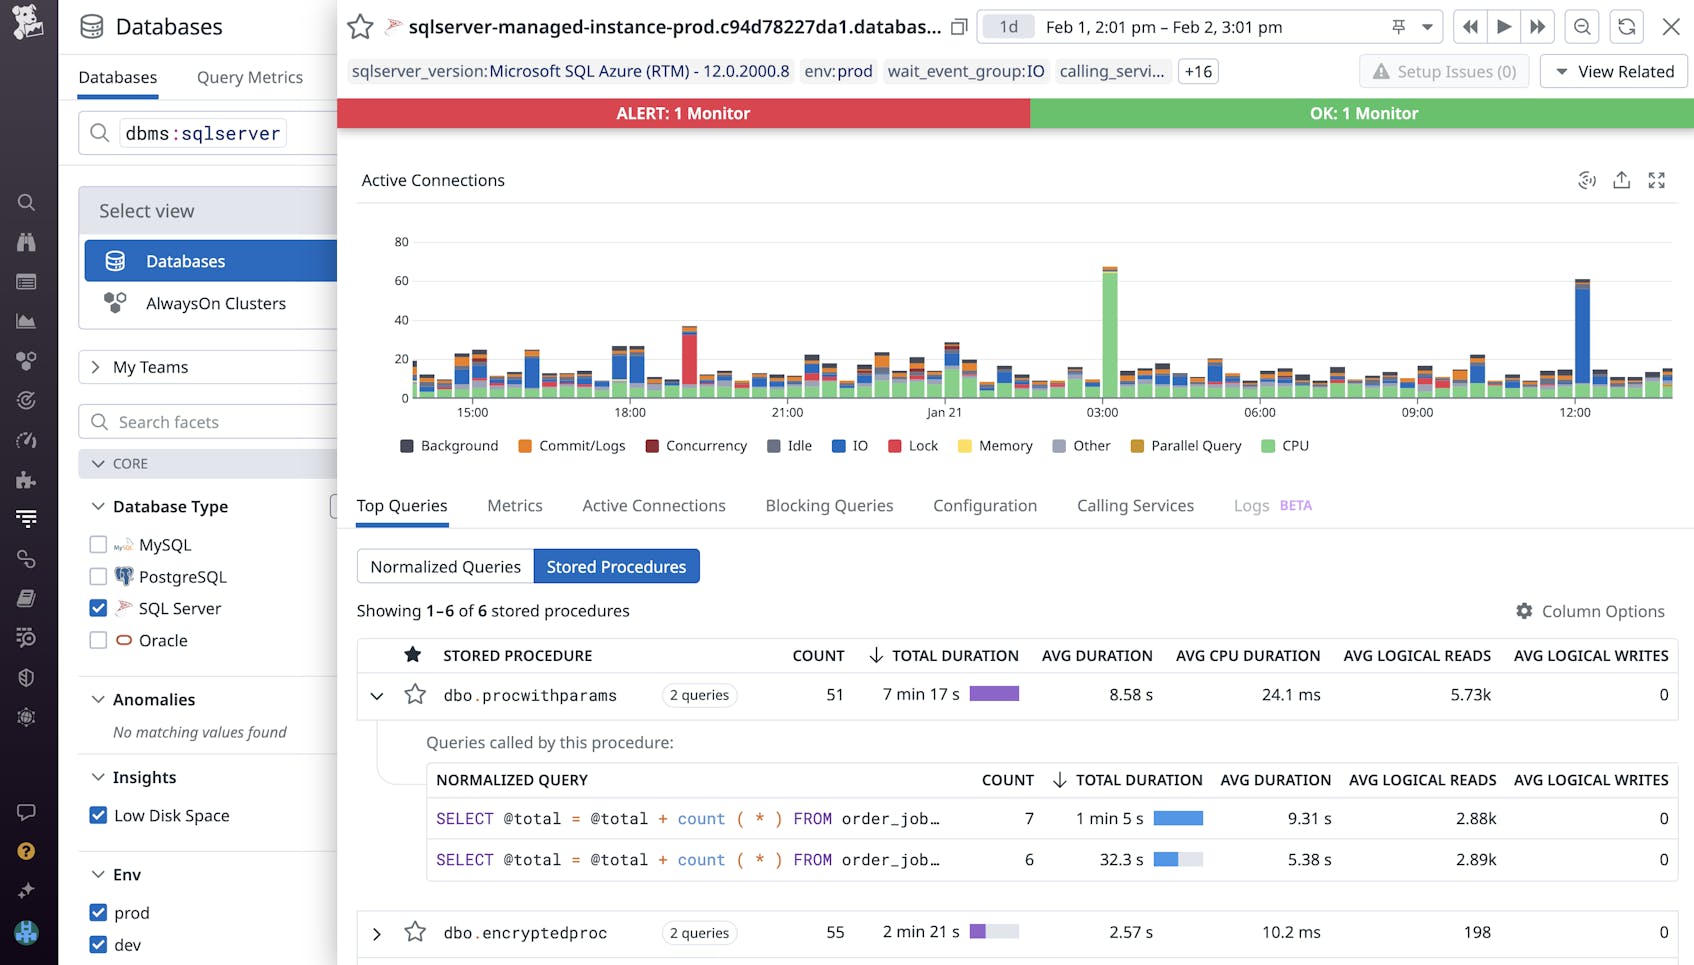
To address this, we’ve expanded DBM to give you insights into your stored procedures in addition to your normalized query data. You can view the Top Queries tab for your SQL Server instances to identify the queries and procedures contributing the most to database load and, potentially, slowing down your applications. After identifying a costly stored procedure, you can drill into its normalized query components to begin optimizing their performance and overall efficiency.
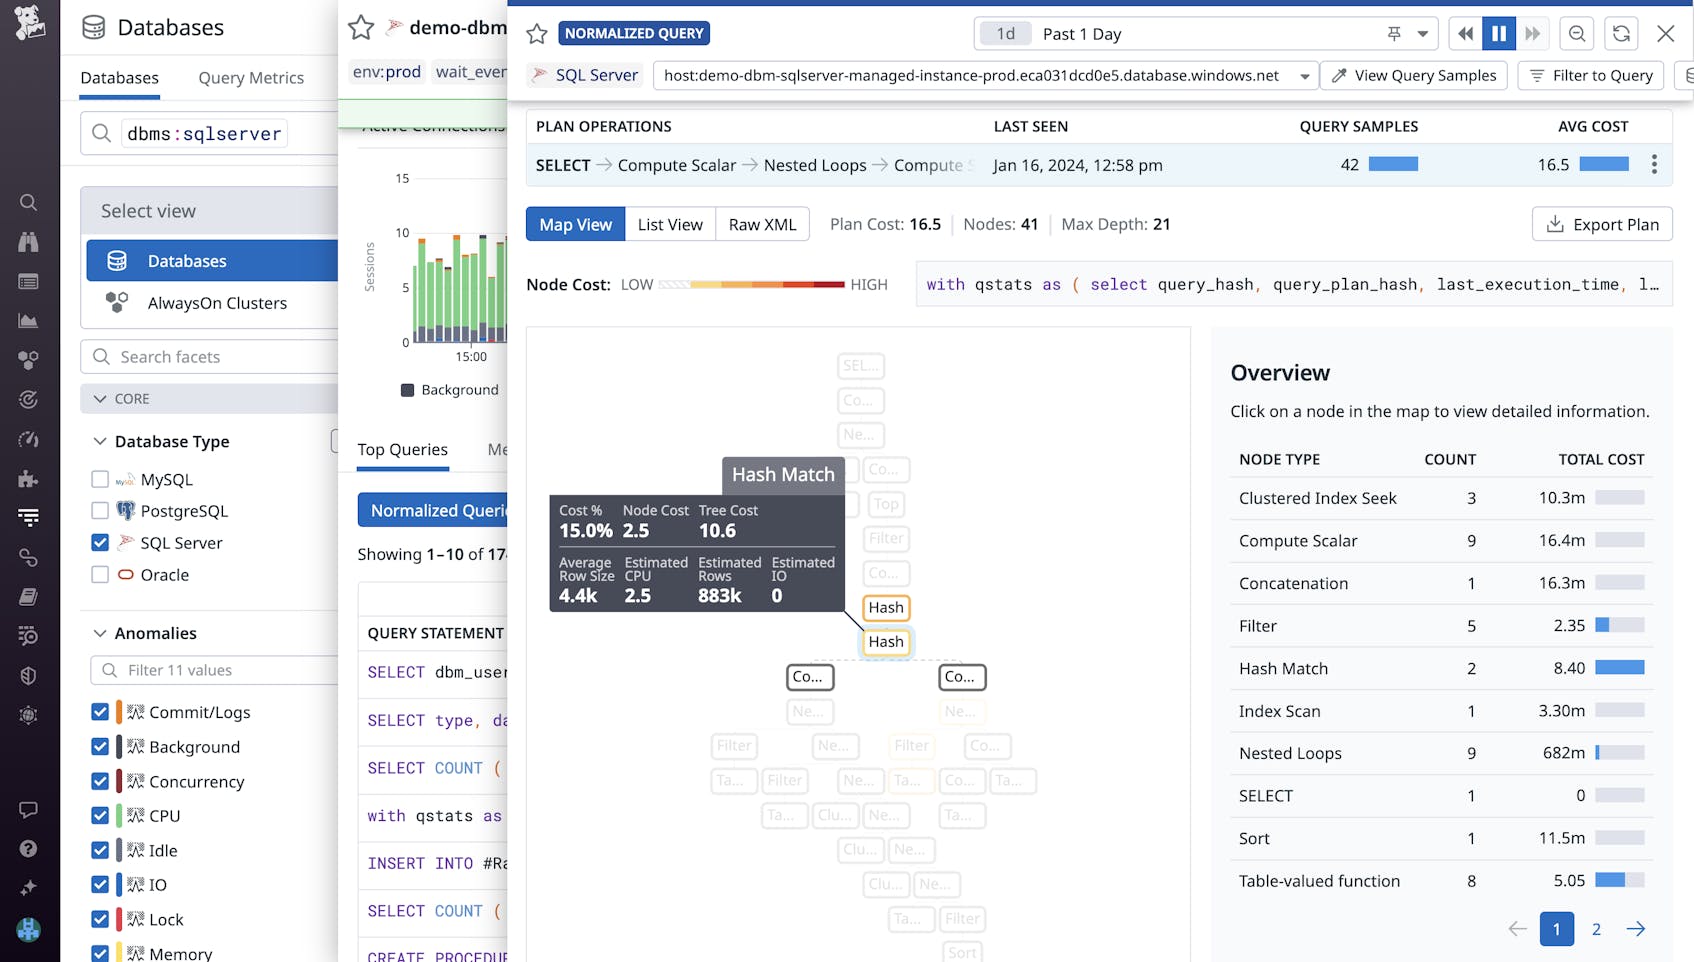
For example, when inspecting a stored procedure, you may notice that a normalized query accounts for the majority of the procedure’s duration. Upon inspecting that query’s explain plans in DBM, you’ll see a breakdown of the query’s steps of operations and their associated costs and row size. This enables you to identify unexpected bottlenecks or high-cost operations (e.g., expensive joins) in your queries. Identifying and configuring your queries to execute more optimal explain plans can greatly improve the performance of the applications that rely on executing any given stored procedure.
Identify latch contention and deadlocks
As users or applications request access to the same resources in a shared database, latches and locks are imposed to ensure that data and memory remain consistent in high-concurrency environments. Latches help prevent issues like race conditions from occurring in your database’s buffer cache (allocated memory pools) by blocking simultaneous updates to the same buffer. High-concurrency data stores typically experience latch contention whenever multiple requests wait to acquire a latch in order to access a page of data. However, it’s important to monitor the wait times and frequency of latch contention in order to identify when these issues become serious enough to impact throughput and bottleneck your database.
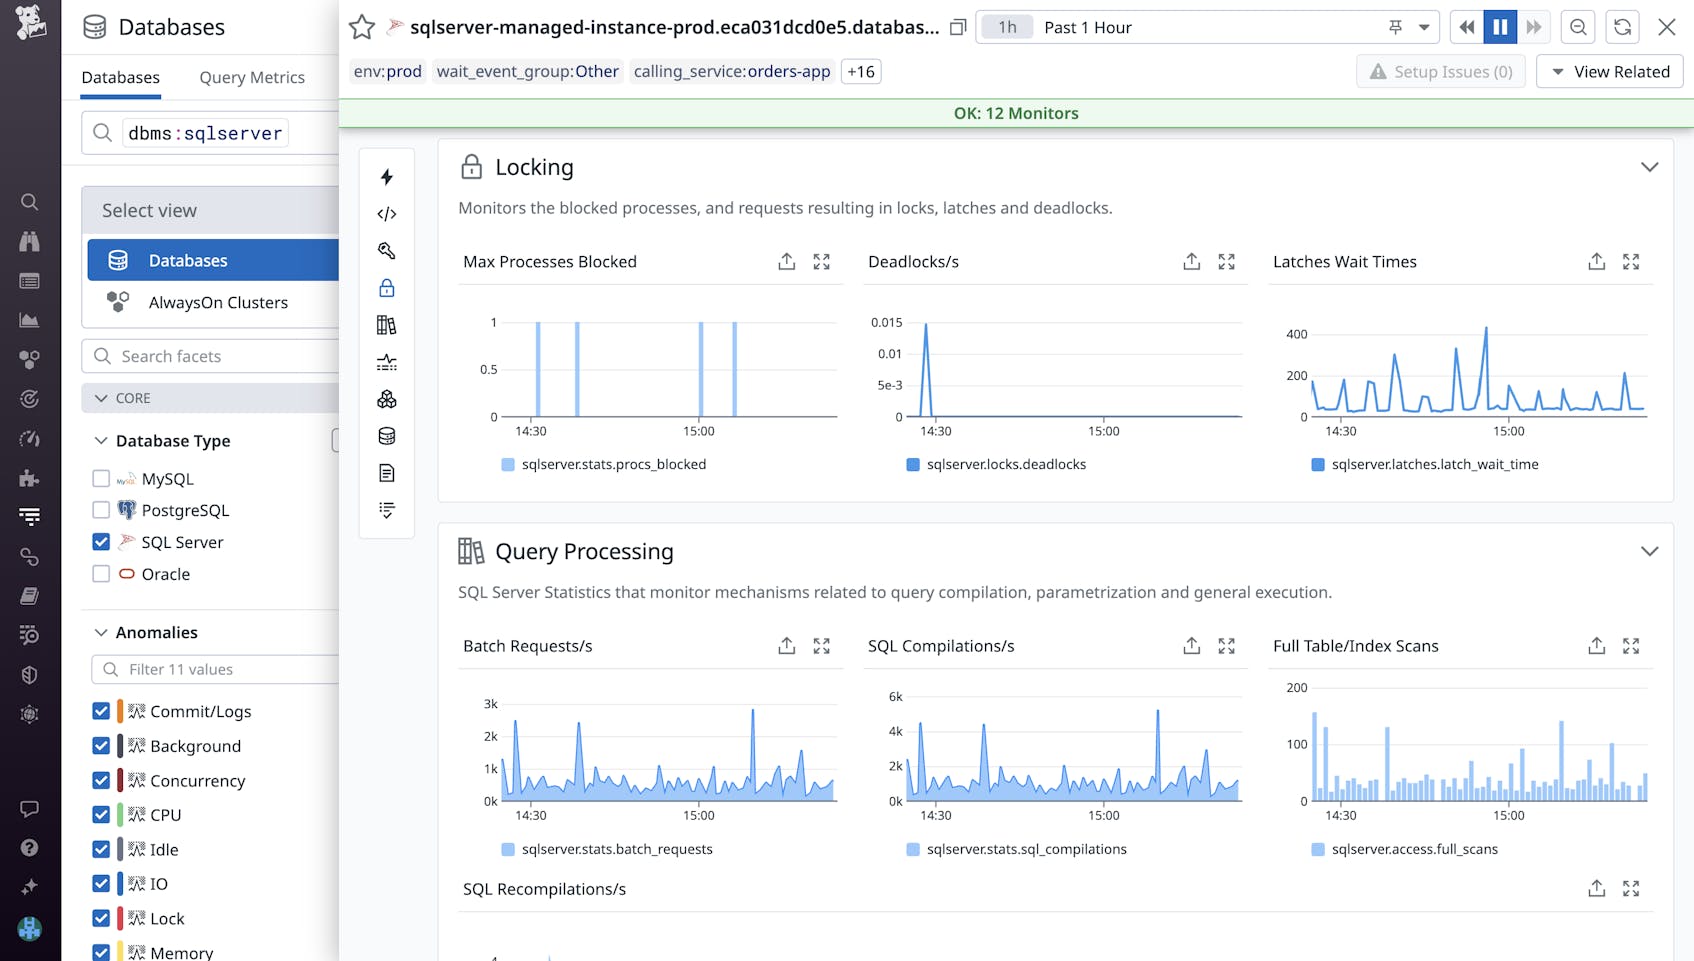
DBM provides metrics that can help you identify latch contention issues, so you can remediate them before they degrade the performance of your database. Using the sqlserver.latches.latch_waits metric, you can identify the number of latch contentions per second. To quickly identify bottlenecks slowing down your server, you can also visualize the average wait times of latches under the Locking section of your database’s Metrics tab (shown below).
On the other hand, locks ensure data consistency by preventing two transactions from simultaneously accessing the same resource. Normally, a session will acquire the lock it needs once the current session is done accessing the target resource. However, when multiple transactions need exclusive access to the same resources before they can proceed, this creates a cyclic dependency known as a deadlock. SQL Server has a built-in thread to detect and resolve deadlocks, but this thread runs every five seconds and will rerun at least one of the deadlocked transactions. If your database encounters deadlocks at a relatively high-frequency, it can increase your server load and lengthen response times.
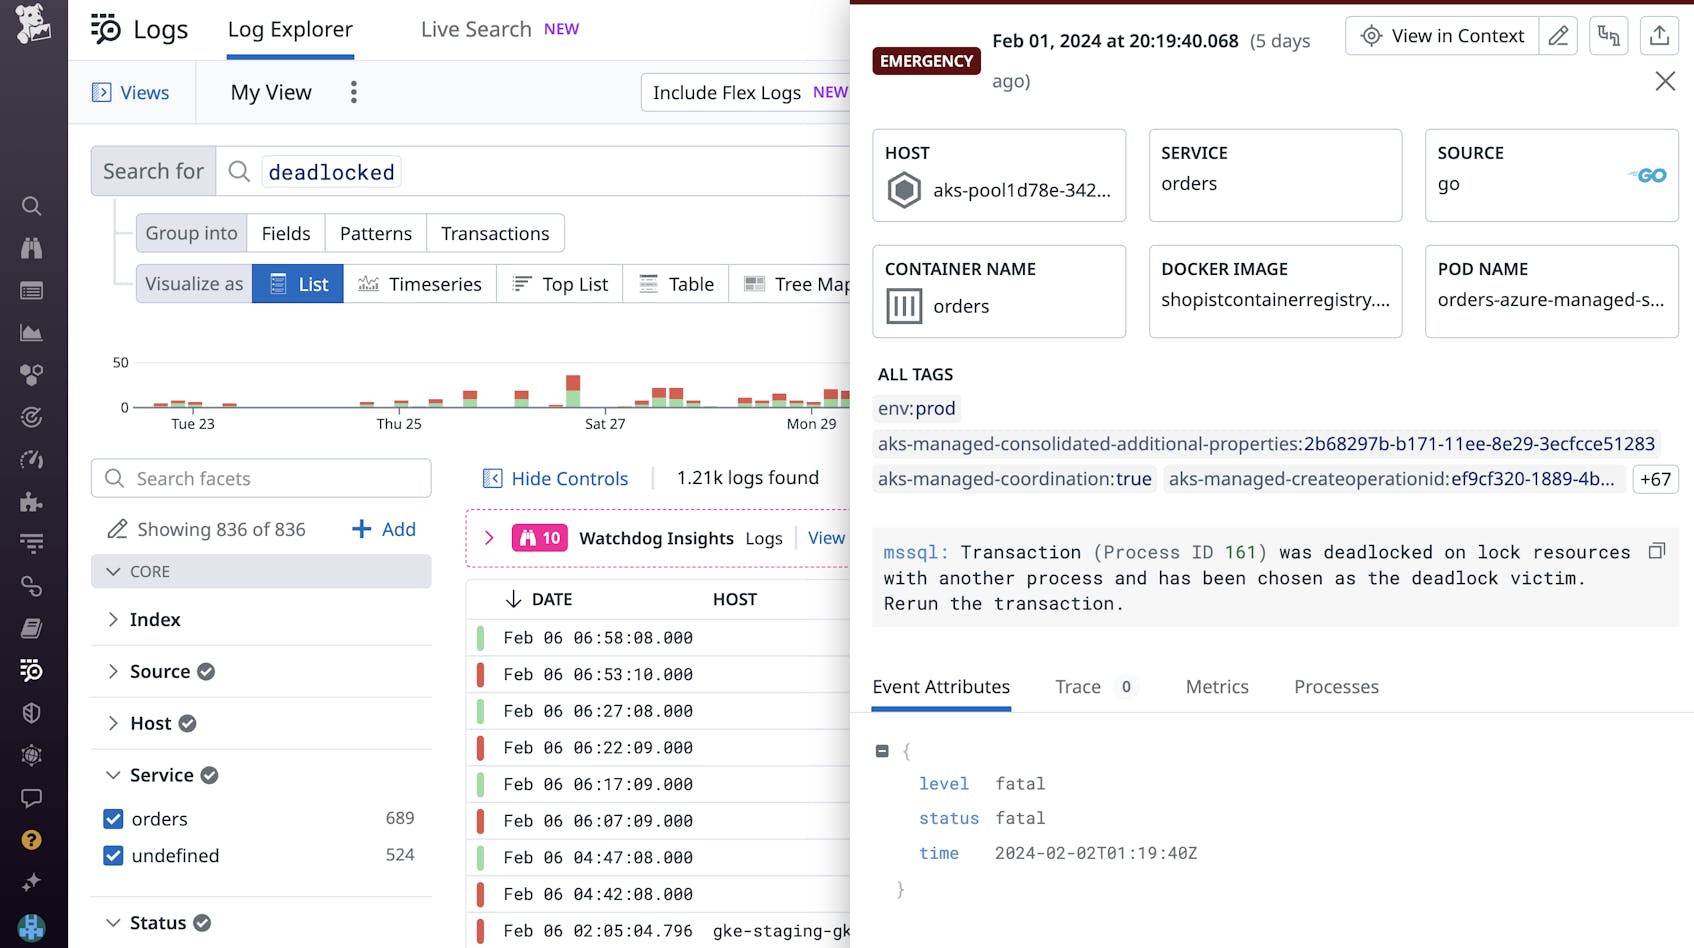
Using the sqlserver.locks.deadlocks metric, you can identify the number of deadlocks occurring per second in your SQL Server instance (you can also visualize the number of deadlocks per second, as shown in the previous screenshot). After detecting a high number of deadlock scenarios, you’ll need to investigate the locks in question. You can identify the processes blocked by deadlocks by installing our SQL Server integration and enabling log collection to view recently returned deadlock error logs. By pinpointing the locked resource (whether it’s an entire table or a single row) or reconfiguring your locks to be compatible, you can resolve recurring deadlocks and keep your databases running smoothly.
Monitor tempdb with DBM
In SQL Server, tempdb is used as a data store for temporary user objects, internal objects generated by the system (such as intermediate work tables and files for hash and sort operations), and version stores that support row versioning features. During heavy periods of traffic, objects are constantly being written to and deleted from tempdb, which may result in unresponsive queries as your service waits for contention issues to resolve.
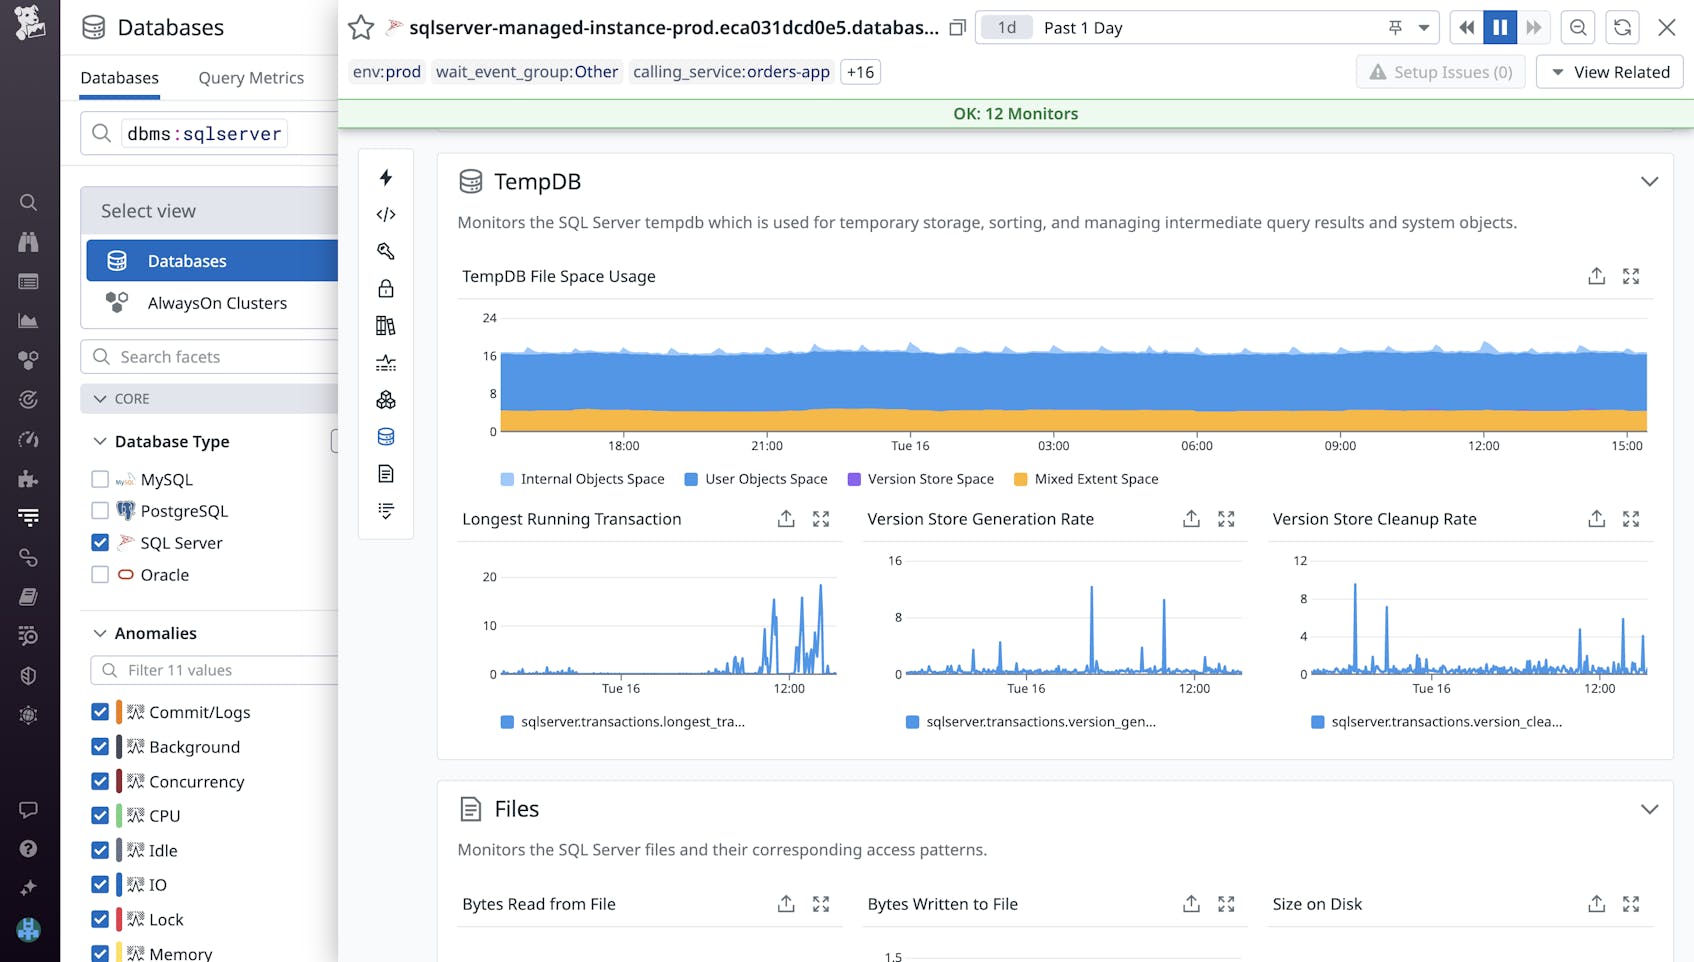
Using DBM, you can now monitor how tempdb is being used and identify long-running transactions that are consuming excessive space. One key metric you’ll want to monitor is unallocated page space (sqlserver.tempdb.file_space_usage.free_space). This can notify you when tempdb is close to reaching capacity. If this free space metric reaches zero, SQL Server will restrict various actions that rely on tempdb—such as joining tables or system views—until the tempdb size can be adjusted.
Excess free space can also be used to increase the concurrency of your database. For example, if you notice that your tempdb has sufficient free space and it experiences allocation contention during periods of heavy load, you can create additional data files to maximize disk bandwidth. Each of the data files will act as an additional global allocation map when processing queries, which can help reduce contention.
Using DBM, you can also ensure that tempdb’s version store is generated and cleaned up at regular intervals. If you notice that version store space is growing linearly in DBM’s tempdb file space usage graph, you can refer to the version store cleanup rate graph to verify that temp is removing old row versions. Because row versions are stored in tempdb as long as an active transaction is accessing them, identifying and terminating long-running transactions can free up space in your version store and ensure that you’re releasing row versions that are no longer needed.
Start monitoring SQL Server with Datadog
With Datadog DBM, you can quickly pinpoint slow queries and other performance issues in your SQL Server instances and troubleshoot them before they affect your users. While this post focused on monitoring tempdb, stored procedures, and locks, DBM also helps you gain comprehensive visibility into SQL Server index usage, memory utilization, performance counters, and more. You can view a full list of available metrics and other relevant info in our documentation.
If you don’t already have a Datadog account, sign up for a free 14-day trial today.
