
PostgreSQL is a widely used open source relational database that many organizations operate as a core part of their infrastructure stack. Because of their mission-critical nature, database-related issues can have outsize downstream impacts on user experience, service performance, and data retention, making it vital to identify and address problems quickly. But providing all teams sufficient visibility into the different layers of your PostgreSQL databases to effectively troubleshoot issues and identify opportunities for optimization can be difficult, particularly if your organization restricts direct access to different parts of your database.
In this post, we’ll cover how Datadog Database Monitoring (DBM) enables developers, SREs, and database analysts to get a shared view of insights (beyond query performance metrics, explain plans, and other core telemetry) into the performance of their PostgreSQL instances and the applications they serve. Specifically, we’ll look at some of the latest DBM enhancements that enable you to:
- Monitor your data models and schemas
- View database configuration settings for fine-tuning
- Track database and query health, from overviews to specific insights
Explore your data model
Having a well-defined data model that is understood by developers who build the applications that query the data is key to healthy database performance. But because of their sensitive nature, the ability to explore the schemas and tables that define a data model has traditionally required privileged permissions, which developers often do not have.
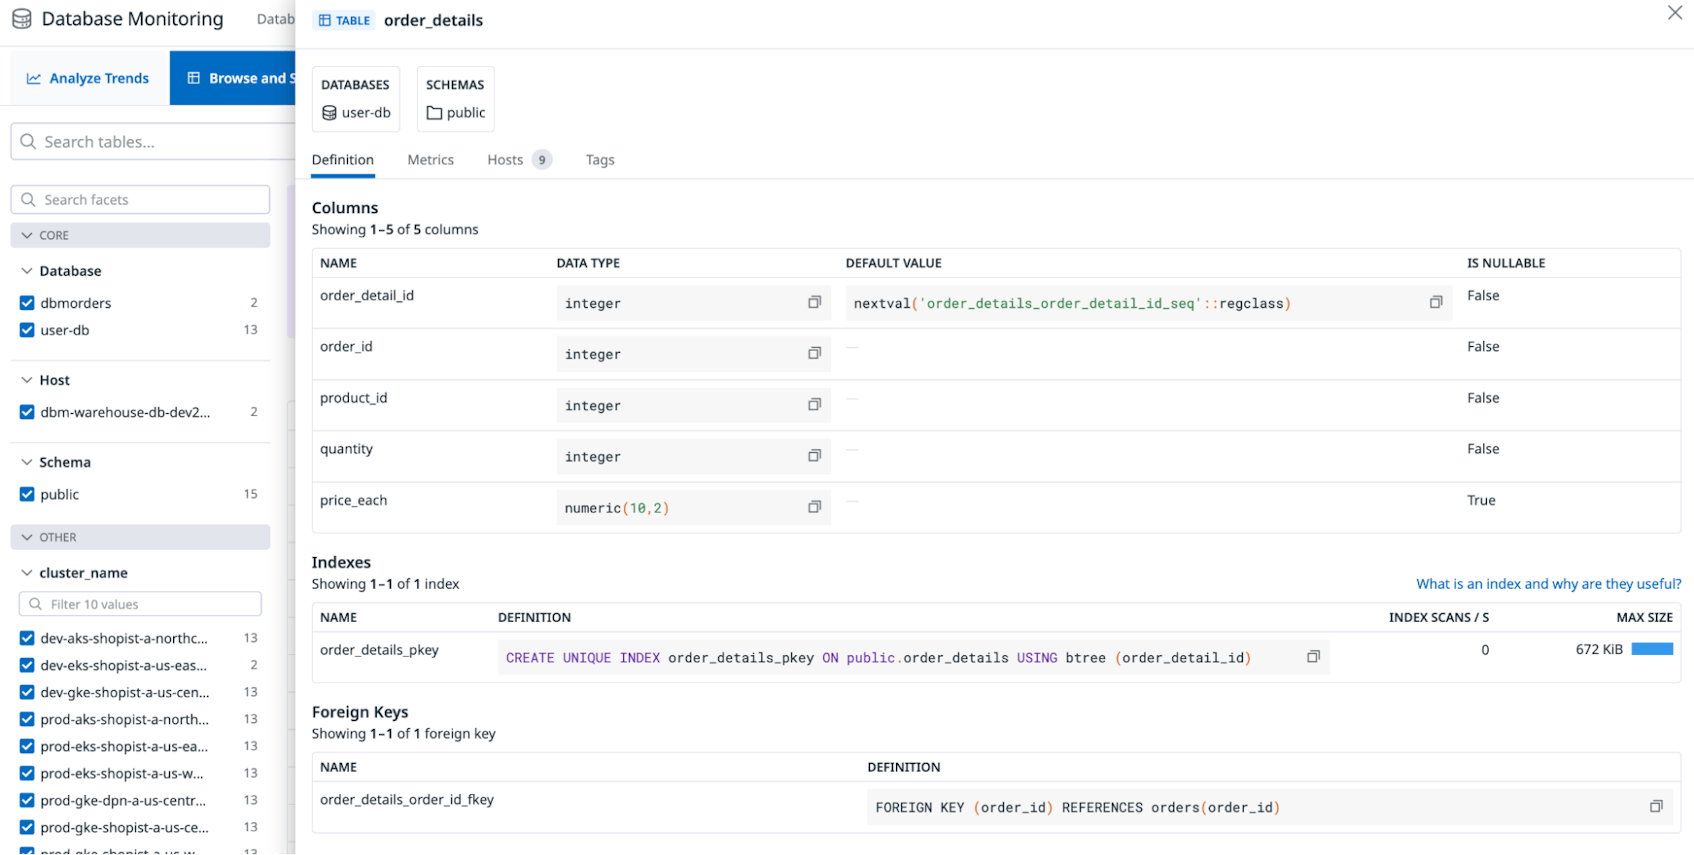
Datadog collects and displays important schema and table definitions, relations, and tuning recommendations across all of your databases in Datadog Database Monitoring’s new Schema Explorer. By providing centralized access to this information, users can independently and quickly reference available indexes and table relations in order to write efficient queries against the database.
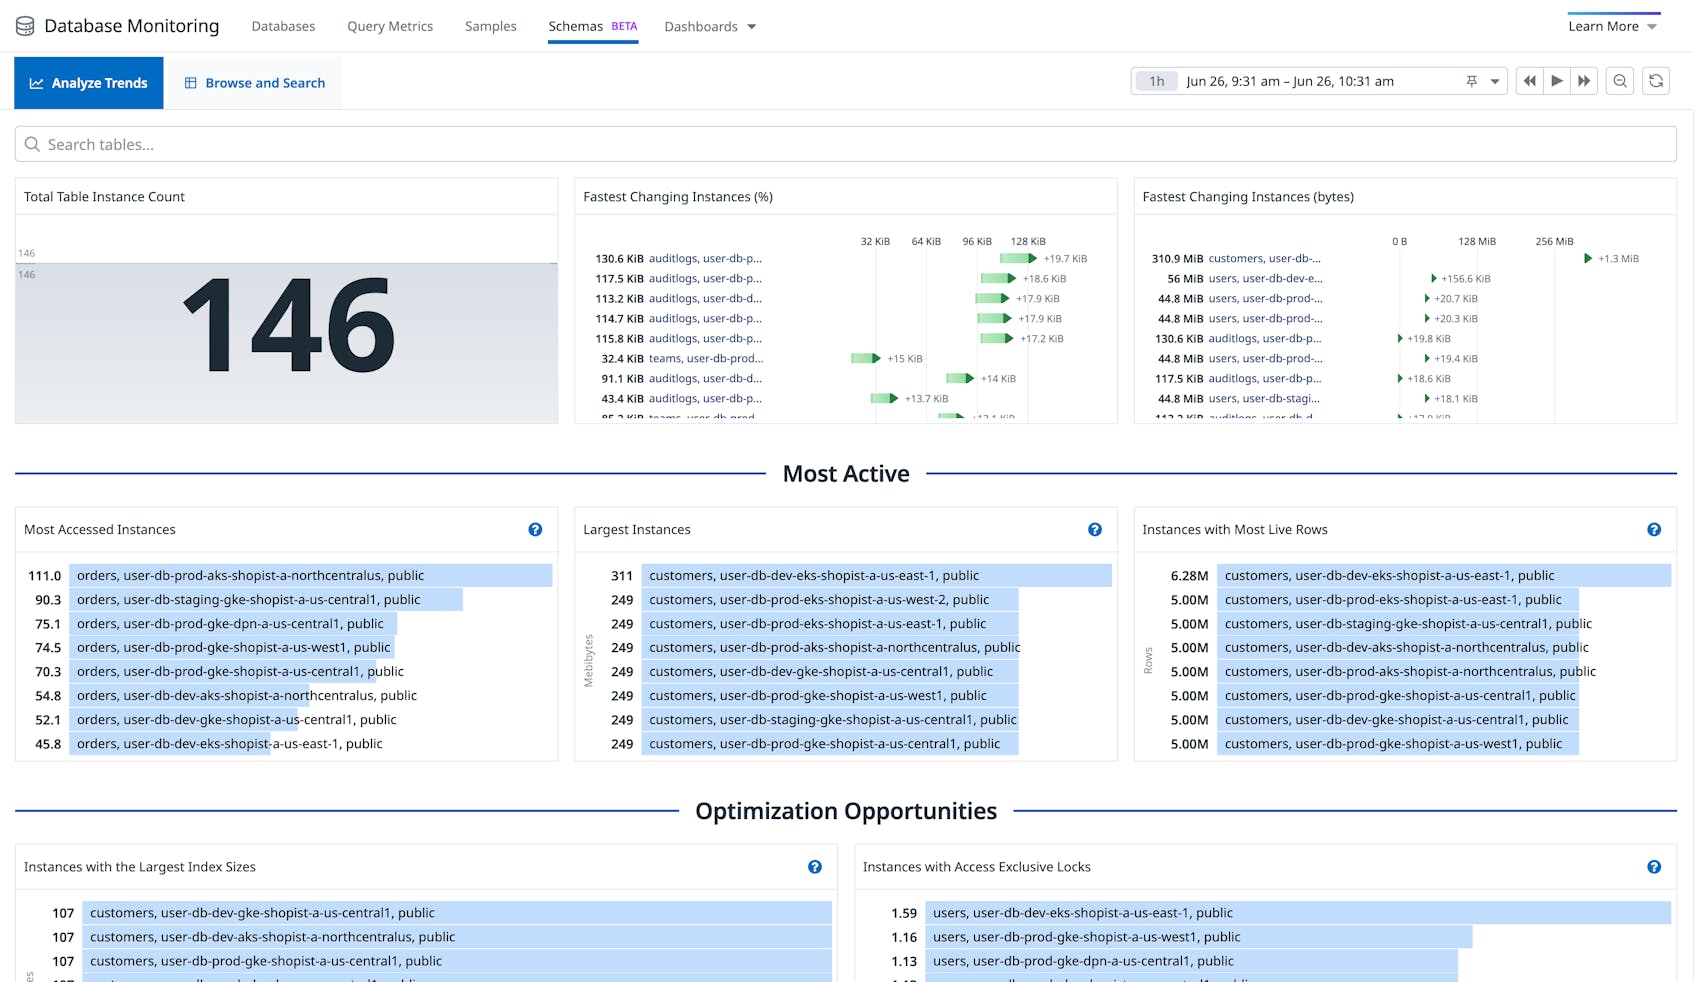
In addition to being able to explore and inspect your database schemas, you can use DBM to quickly identify trends across your data tables to easily answer questions like, Which tables are growing the fastest? Which data is accessed most? Where are there optimization opportunities to address large indexes or instances with a high number of dead rows?
In some cases, despite having the same table structures, hosts in a complex cluster may have asymmetric hardware configurations, data volumes, or performance requirements. This means that, in addition to the fleet-level view of schemas, it may be helpful to look at a specific instance’s schema definition. When viewing a database host in Datadog DBM, you can dive deep into the localized schema for every database on the host instance. This allows you to ensure the integrity of the data model to rule out a potential source of error and determine if optimizations can be made specific to the schema of the tables on the host being examined, again without needing access to the individual database host or instance.

Verify database configuration
It can often be difficult to access a database’s configuration settings. But understanding these settings can reveal opportunities for optimizing performance and mitigating potential issues. For example, tuning cache sizes, buffer pools, or concurrency settings can optimize the database to meet specific performance requirements. Similarly, analyzing settings such as memory allocation, disk I/O configuration, autovacuum, and connection pool settings can reveal opportunities to enhance throughput and reduce latency.
Datadog DBM ingests database settings and configurations from your PostgreSQL databases. Database administrators and engineers can then view a database’s configuration to investigate the underlying parameters that govern database behavior and that ultimately impact performance and reliability, without needing direct database access.
During incident response, seamless access to configuration details enables teams to compare current settings with known good configurations to quickly identify deviations or misconfigurations that may be contributing to the issue. This can reduce mean time to resolution by minimizing time spent obtaining privileged access to this data, ultimately mitigating the impact of the impending performance degradation.

Monitor database instance performance
While database configurations and schemas offer new insights, metrics remain critical to identifying key issues in database health. Datadog DBM now provides a holistic view of metrics relating to the performance of your database’s underlying hosts and processes by visualizing telemetry ranging from core system metrics to database-specific telemetry such as vacuum operations, lock activity, and index usage. This enables you to see a wide range of addressable issues at a glance.
For example, steady growth in dead rows tells us to optimize autovacuum settings. The number of connections approaching max limits indicates we need to increase the limit or scale up. And regular spikes in I/O, CPU, or memory contention shows us we may want to adjust our database instance type, optimize the query load, or both. Making this telemetry accessible alongside active connections, blocking queries, and top SQL queries means application engineers and database administrators have a shared context and understanding of the databases that they maintain and rely on, enabling them to more easily determine if a database is healthy from a single view by minimizing time spent looking for performance signals.

Dive deeper into database load analysis
When monitoring database performance, understanding database load is important. But it can be challenging to get a full picture of load given the many potential factors that contribute to it. With Datadog DBM, you can track database load from a number of lenses, including wait activity, active connections, queries, and other performance metrics. DBM allows deeper analysis into load patterns, with a single panel that provides an overview on what’s driving load by visualizing active connections by SQL query, wait event, user, database, client, or application, with database and query filtering. This means you can quickly see what’s driving, for example, a spike in I/O wait events, whether it’s a single query or multiple queries on a single database.

Diagnose fleet-wide issues more quickly
Being able to drill down into a specific host can be essential for efficiently resolving an incident. However, as your fleet scales in size, it becomes even more important to be able to maintain a bird’s-eye view of your database infrastructure so you can quickly determine which hosts need attention. The DBM overview page now places this information front and center. You can easily sort and filter the host list to see, for example, only hosts that have critical monitors in alert state, such as an alert of high CPU utilization.

Datadog surfaces these alerts alongside any Watchdog insights related to these hosts. Whether an alert you’ve created is triggered or Datadog detects something of interest in your systems, your view in DBM is optimized to help you quickly identify where you need to devote your attention.

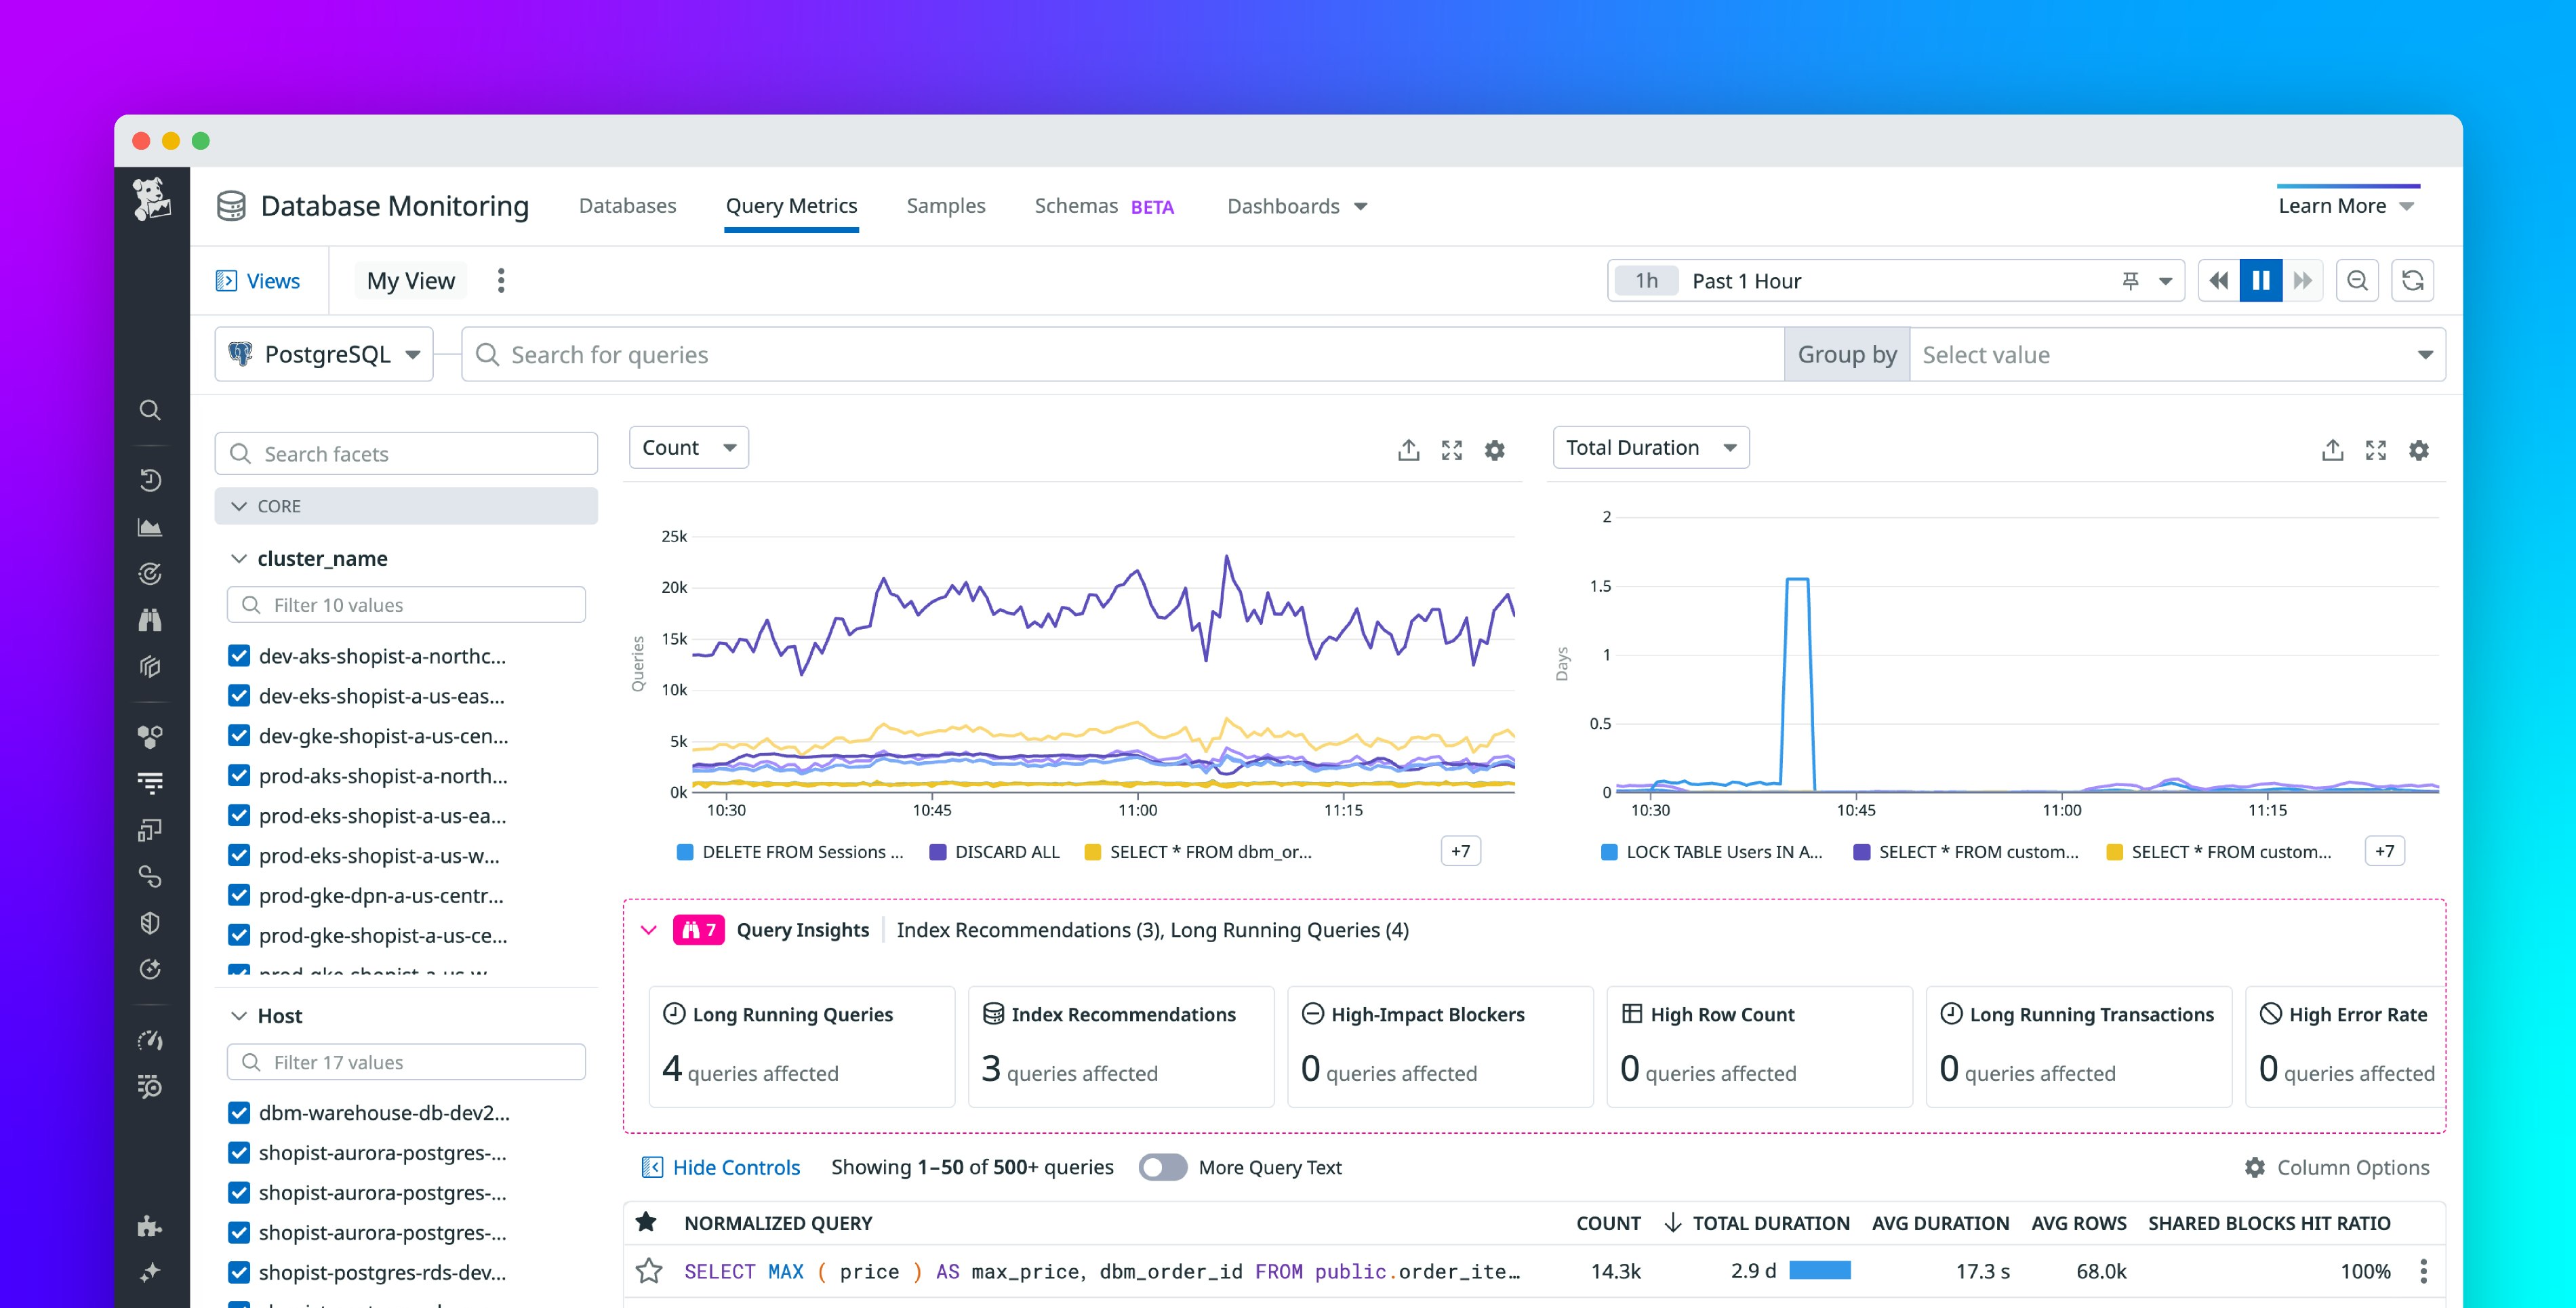
Improve database and query performance with Query Insights
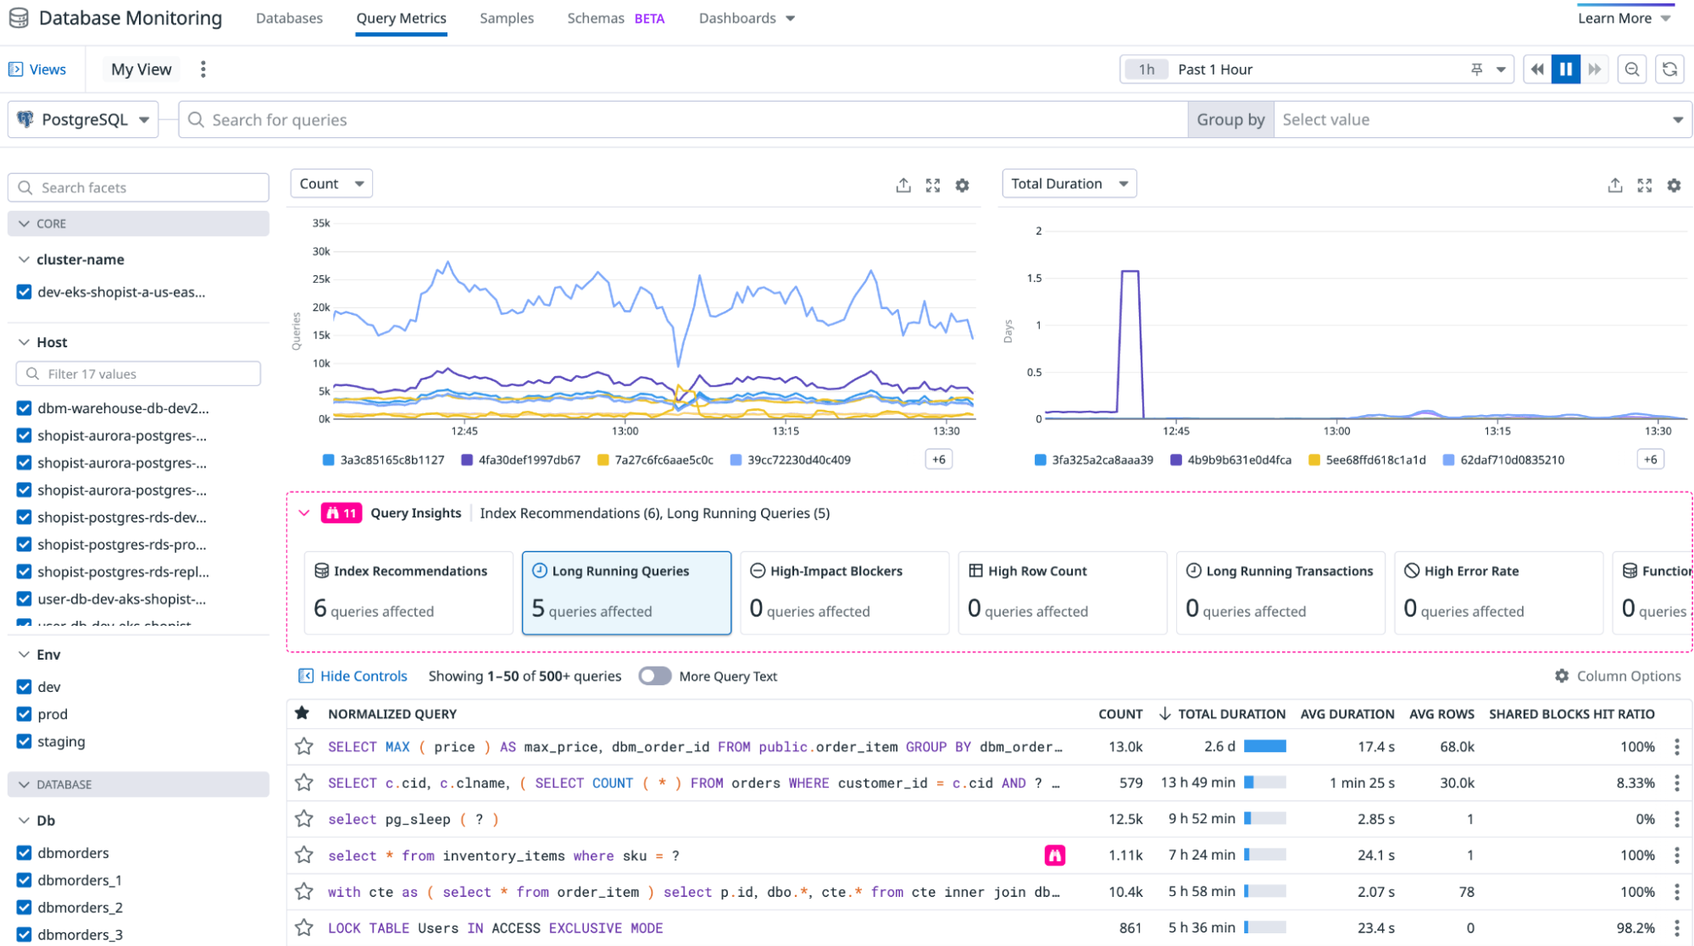
In order to help you to identify problems more quickly and focus troubleshooting efforts before customer impact, Datadog DBM now automatically detects common failure modes and antipatterns—such as long-running queries, functions in filters, missing indexes on tables, anomalous wait event activity, or high blocking activity—and provides recommended remediation steps to maintain and improve database performance proactively, before an incident occurs.
For example, identifying slow queries early allows you to address the issue by optimizing the query or the underlying data structure. If the slowdown is caused by blocking, DBM automatically detects and highlights this behavior, making it easy to identify the offending query and reduce contention. If this issue is caused by a poorly written query, such as a using a function in a filter, DBM will detect and suggest remediation steps as well.
With automated performance degradation detection and remediation recommendations, Datadog reduces the manual effort required to maintain a database. This means your team can spend more time building applications and less time troubleshooting database issues.
Get deeper insights into each level of your PostgreSQL databases with Datadog
In this post, we looked at how Datadog Database Monitoring provides visibility into your PostgreSQL databases beyond core performance. With DBM, application developers and SREs can explore data models and schemas across their database fleet, see configuration settings, and drill down to monitor query performance and database load from multiple angles. By providing all teams with this information, Datadog makes it easier to identify opportunities for optimization and to respond to incidents more effectively. See our documentation to get started with Datadog DBM for PostgreSQL. Or, if you’re not a customer, sign up for a free 14-day trial.
