When you need to troubleshoot an issue in your Node.js application, logs provide information about the severity of the problem, as well as insights into its root cause. You can use logs to capture stack traces and other types of activity, and trace them back to specific session IDs, user IDs, request endpoints—anything that will help you efficiently monitor your application. Node.js includes built-in logging capabilities with console.log, but a dedicated logging library like Winston provides greater flexibility for creating application logs.
In this guide, we will walk through collecting, customizing, and enriching your Node.js logs with Winston, and then show you how to centralize those logs to get deep visibility into your applications. You will learn how to:
- Create your own logger and customize its output
- Enrich your logs with metadata, custom formats, and exception handling
- Dig into your Node.js logs with Datadog
Collect your Node.js logs
Winston is a popular, highly flexible logging library for Node.js. It includes a robust set of features for customizing the metadata and format of your logs, as well as how they should get routed and stored.
First, if you haven’t done so already, you will need to install Winston:
npm install --save winston
Create a custom logger for your application
To get started, you need to create a logging configuration file (e.g., logger.js) that your application code will import. Though a default logger is available through the winston module, creating your own logger gives you greater control over log formatting, exception handling, and where logs will get routed (e.g., console, file, or stream). In the logging file, you can create a logger for your application, and configure it to output logs to a destination (also known as a transport):
logger.js
const { createLogger, format, transports, config } = require('winston');

const logger = createLogger({
   transports: [
       new transports.Console()
     ]
 });
 module.exports = logger;
The example above shows a basic logger that you can immediately begin using in your application. Winston requires at least one transport for every logger, though you can also combine several transports. As you build out your application and infrastructure, it’s a best practice to create and configure a different logger for each major component of your application in order to quickly identify where logs come from. This helps you easily identify the relevant service or function when debugging an issue. You can do this by creating separate loggers for different application services:
logger.js
[...]
const userLogger = createLogger({
   transports: [
       new transports.Console()
     ]
});
const paymentLogger = createLogger({
   transports: [
       new transports.Console()
     ]
});

module.exports = {
 userLogger: userLogger,
 paymentLogger: paymentLogger
};
This enables you to customize the configuration of each of your loggers, based on the application service. You can then use a specific logger (e.g., userLogger, paymentLogger) in your application code by importing the logger.js configuration in an application file and calling it:
/routes/users.js
// require logger.js
const {userLogger, paymentLogger} = require('./logger');

[...]
userLogger.info('New user created');
The logger will log to the console and automatically use default values for the following parameters:
- level: the minimum severity (i.e., maximum priority) level that is logged (
info) - levels: the log priority protocol (
npm.levels) - format: the log format (
json, one of several format types)
The logger will automatically log the message to the console:
{"message":"New user created.","level":"info"}
When you specify the log level for a log, Winston automatically creates a level attribute and applies the npm info logging level. In the next section, we’ll take a closer look at the log priority protocols that are available in Winston, and show you how to add a logging level to your logs to ensure that they get logged at the desired priority level.
Incorporate the right levels for your logs
Logging levels indicate the severity of an issue and help categorize application activity. For example, info logs inform you of normal application workflows such as connecting to a database, while error logs indicate a problem in your application. By default, Winston uses the npm log priority protocol, which prioritizes logging levels from 0 (highest level of severity) to 5 (lowest level of severity):
0: error
1: warn
2: info
3: verbose
4: debug
5: silly
You can also create your own custom levels, or configure Winston to use the syslog protocol by using the levels parameter, as seen below:
logger.js
const userLogger = createLogger({
   levels: config.syslog.levels,
   transports: [
       new transports.Console()
     ]
 });
Regardless of the log priority protocol you’re using, you can specify the logging level directly in your code. For example, the error logging level allows you to easily categorize high-priority events such as dependency deprecations or operation errors:
/routes/users.js
//require logger.js
const {userLogger, paymentLogger} = require('./logger');

userLogger.error(`Unable to find user: ${err}`);
The resulting log would look similar to the following:
{"message":"Unable to find user: user doesn't exist","level":"error"}
Logging levels help you categorize application activity so you can easily pinpoint errors. If you forward your logs to a log management service, you can easily sift through large volumes of logs, determine the severity of an issue, and investigate by correlating your Node.js logs with other application data such as database logs and metrics.
How you store these logs is important to consider when managing large and complex applications. Winston provides several transports for your logs that you can combine and further customize to ensure that all of your logs get routed to the right places.
Log to the console or to a file
With Winston, you can configure your logger to route logs to one or more built-in transports, or destinations, including:
- Console: to debug issues locally
- File: to log to a locally stored file
- HTTP: to stream logs to an HTTP endpoint via a logging daemon like winstond
Although Winston and other logging libraries provide several options for storing logs, logging to a file is advantageous for complex applications or systems that generate large volumes of logs. Following this best practice ensures that you always have a copy of your logs stored locally on your servers. It also means that you won’t lose critical visibility if there is a network-related error that prevents your application servers from streaming logs to your transport. Logging to one or more files also makes it easy to configure a log management service to tail your log files in real time, so you can analyze them in one platform, and correlate them with monitoring data from the rest of your infrastructure and applications.
You can configure your logger to output logs to a file by adding it as a transport:
logger.js
const userLogger = createLogger({
   levels: config.syslog.levels,
   transports: [
       new transports.Console(),
       new transports.File({ filename: 'combined.log' })
     ]
 });
In the example snippet above, your logger will log to the console in addition to a combined.log file. This ensures that you can see logs when debugging issues locally and easily forward your logs to a log management service. You can also specify a different level for each transport. The example below shows how you can configure the logger to route error logs to the console, and log anything at info level and below (i.e., warn and error logs, if you’re using the npm protocol) to a file:
logger.js
transports: [
     new transports.Console({ level: error }),
     new transports.File({ filename: 'combined.log', level: 'info' })
   ],
Though Winston provides some basic, default options for logs, we’ve seen how easy it is to customize your logger’s logging levels and transports for greater control over your log data. In the next section, we’ll look at how you can enrich your logs with metadata, custom formats, and exception handling.
Enrich your logs with custom metadata and formats
As your infrastructure grows, you may want to include more diagnostic information for easier troubleshooting. Having enough information in your logs is critical for efficiently pinpointing issues in your application, especially in environments that generate a large volume of logs across multiple servers. Winston provides options for adding metadata at both a global and local level. This means that you can automatically incorporate helpful data into all of your logs and customize the data that is captured in individual logs. For example, you may find it useful to see the user ID, request endpoint, and/or IP address in each log message for a specific service. By adding this kind of information to your log metadata, you can pinpoint issues that may only affect a smaller subset of your users.
Add global metadata to your logs
Metadata at the global level can be useful for querying and analyzing your logs after you’ve centralized them in a log management platform, as well as identifying the application service associated with a specific logger. You can use Winston’s defaultMeta parameter to configure a logger to add global metadata to every log it generates:
logger.js
const userLogger = createLogger({
   levels: config.syslog.levels,
   defaultMeta: { component: 'user-service' },
   transports: [
       new transports.Console(),
       new transports.File({ filename: 'combined.log' })
     ]
 });
With the example above, the logger will automatically include a component attribute in all of your logs:
{"component":"user-service","level":"info","message":"Session connected"}
Using global metadata, as seen in the example above, helps you quickly identify the application component associated with your logger. In a complex application, seeing this kind of information in your logs is critical for troubleshooting issues because it immediately points you to the component you should look at first.
Add metadata directly to individual logs
In addition to automatically applying metadata to all of your logs, Winston gives you the flexibility to add new attributes directly to individual logs. This is useful if you need to track data for activities such as creating new client sessions and only need that information in a subset of logs. For example, you can log the unique identifier for a client’s session by creating a new sessionID attribute in your log:
/routes/users.js
//require logger.js
const {userLogger, paymentLogger} = require('./logger');

userLogger.info('Session connected', { sessionID: `${req.id}` });
Your logger will automatically append the sessionID as a new attribute to your log:
{"component":"user-service","level":"info","message":"Session connected","sessionID":"ak6xayY_UENoqJqXAAAA"}
In addition to logging normal application workflows, logs provide valuable information about your users. For example, you can capture the response to a POST request in your logs so that you can debug issues with creating new users in your application:
/routes/users.js
//require logger.js
const {userLogger, paymentLogger} = require('./logger');

userLogger.info('User created!',
     {userID: `${res._id}`,
     name: `${res.name}`,
     email: `${res.email}`,
     );
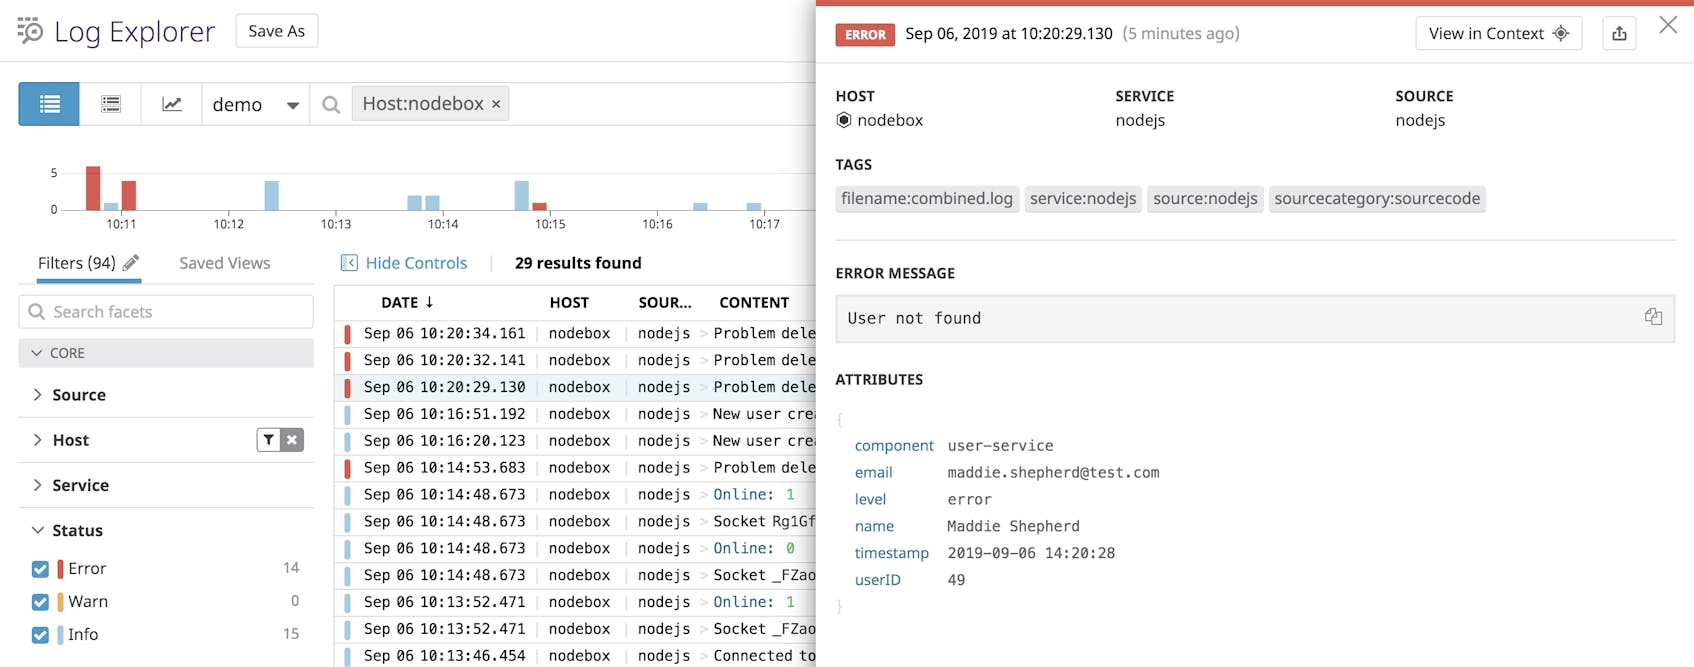
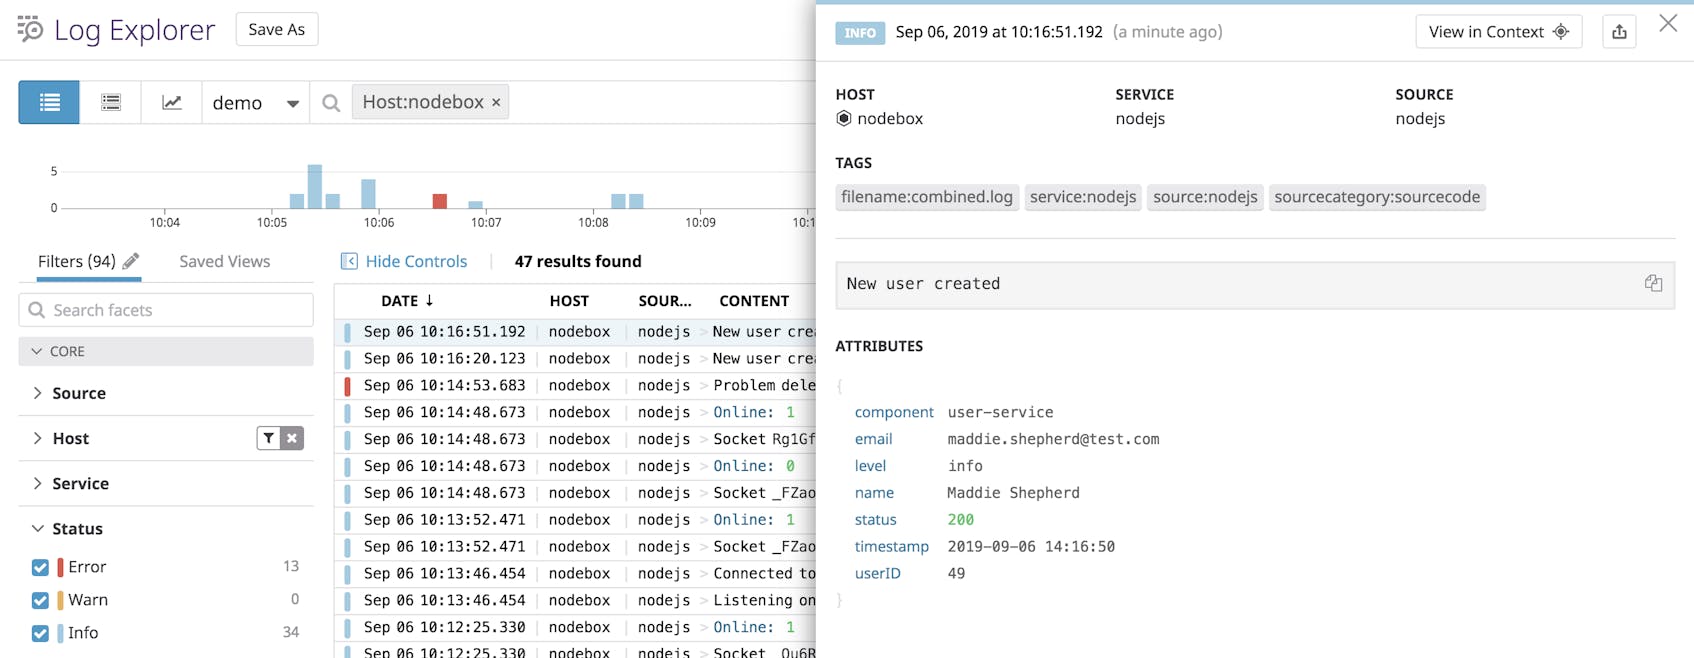
A log management platform can then parse this information so that you can further analyze and alert on the attributes extracted from those logs.
By using global and custom attributes in your logger, you can add more contextual information in your log data. This enables you to quickly pinpoint the root cause of an issue when debugging locally and easily search for key attributes in a log management service. For example, you can use your log’s metadata to debug issues with a specific user account by searching for the attributes seen in the example log above, such as name, email, or userID.
If you need greater control over your logs’ structure and metadata, you can also customize their format by using one (or combining several) of Winston’s built-in formatters.
Customize the format of your logs
A key feature of the Winston library, and many other Node.js logging libraries, is that it automatically structures logs in JSON format by default. In the previous section, you saw how easy it was to add attributes (i.e., metadata) to your JSON logs. Logging in JSON is also a best practice because it makes it easier for a log management service to automatically parse the metadata you added to your logs, and removes the need to change any of your log processing pipelines whenever you add or remove attributes.
Winston supplies built-in formats that allow you to customize your JSON logs and control how logs will look in transports. This gives you the flexibility to use a single format, combine several formats, or create your own. This example combines Winston’s timestamp and json formats to add a timestamp to JSON-formatted logs:
logger.js
const { createLogger, format, transports, config } = require('winston');
const { combine, timestamp, json } = format;

const userLogger = createLogger({
   levels: config.syslog.levels,
   defaultMeta: { component: 'user-service' },
   format: combine(
       timestamp({
           format: 'YYYY-MM-DD HH:mm:ss'
       }),
       json()
     ),

   transports: [
       new transports.Console(),
       new transports.File({ filename: 'combined.log' })
     ]
 });
You can also customize how the timestamp should look, by specifying a format parameter, as shown above. The resulting log will look similar to the following:
{"component":"user-service","level":"info","message":"Session connected","sessionID":"ak6xayY_UENoqJqXAAAA","timestamp":"2019-07-29 21:13:11"}
Adding a timestamp to your logs is a critical aspect of debugging application errors because it enables you to see when an issue occurred. Timestamps also enable you to correlate application logs with other events, which can be useful for investigating why your application generated an error (e.g., the server went offline) or threw an unhandled exception.
Automatically capture uncaught exceptions in your logs
Logging any exceptions thrown by your application helps you quickly debug the root cause of a problem in your code. Winston’s logging library doesn’t capture unhandled exceptions by default, but it does provide an exception handler that will automatically log uncaught exceptions. To enable it, call exceptionHandlers in your logger configuration:
logger.js
const userLogger = createLogger({
  [...]
   exceptionHandlers: [
       new transports.Console(),
	new transports.File({ filename: 'combined.log'})
     ]
 });
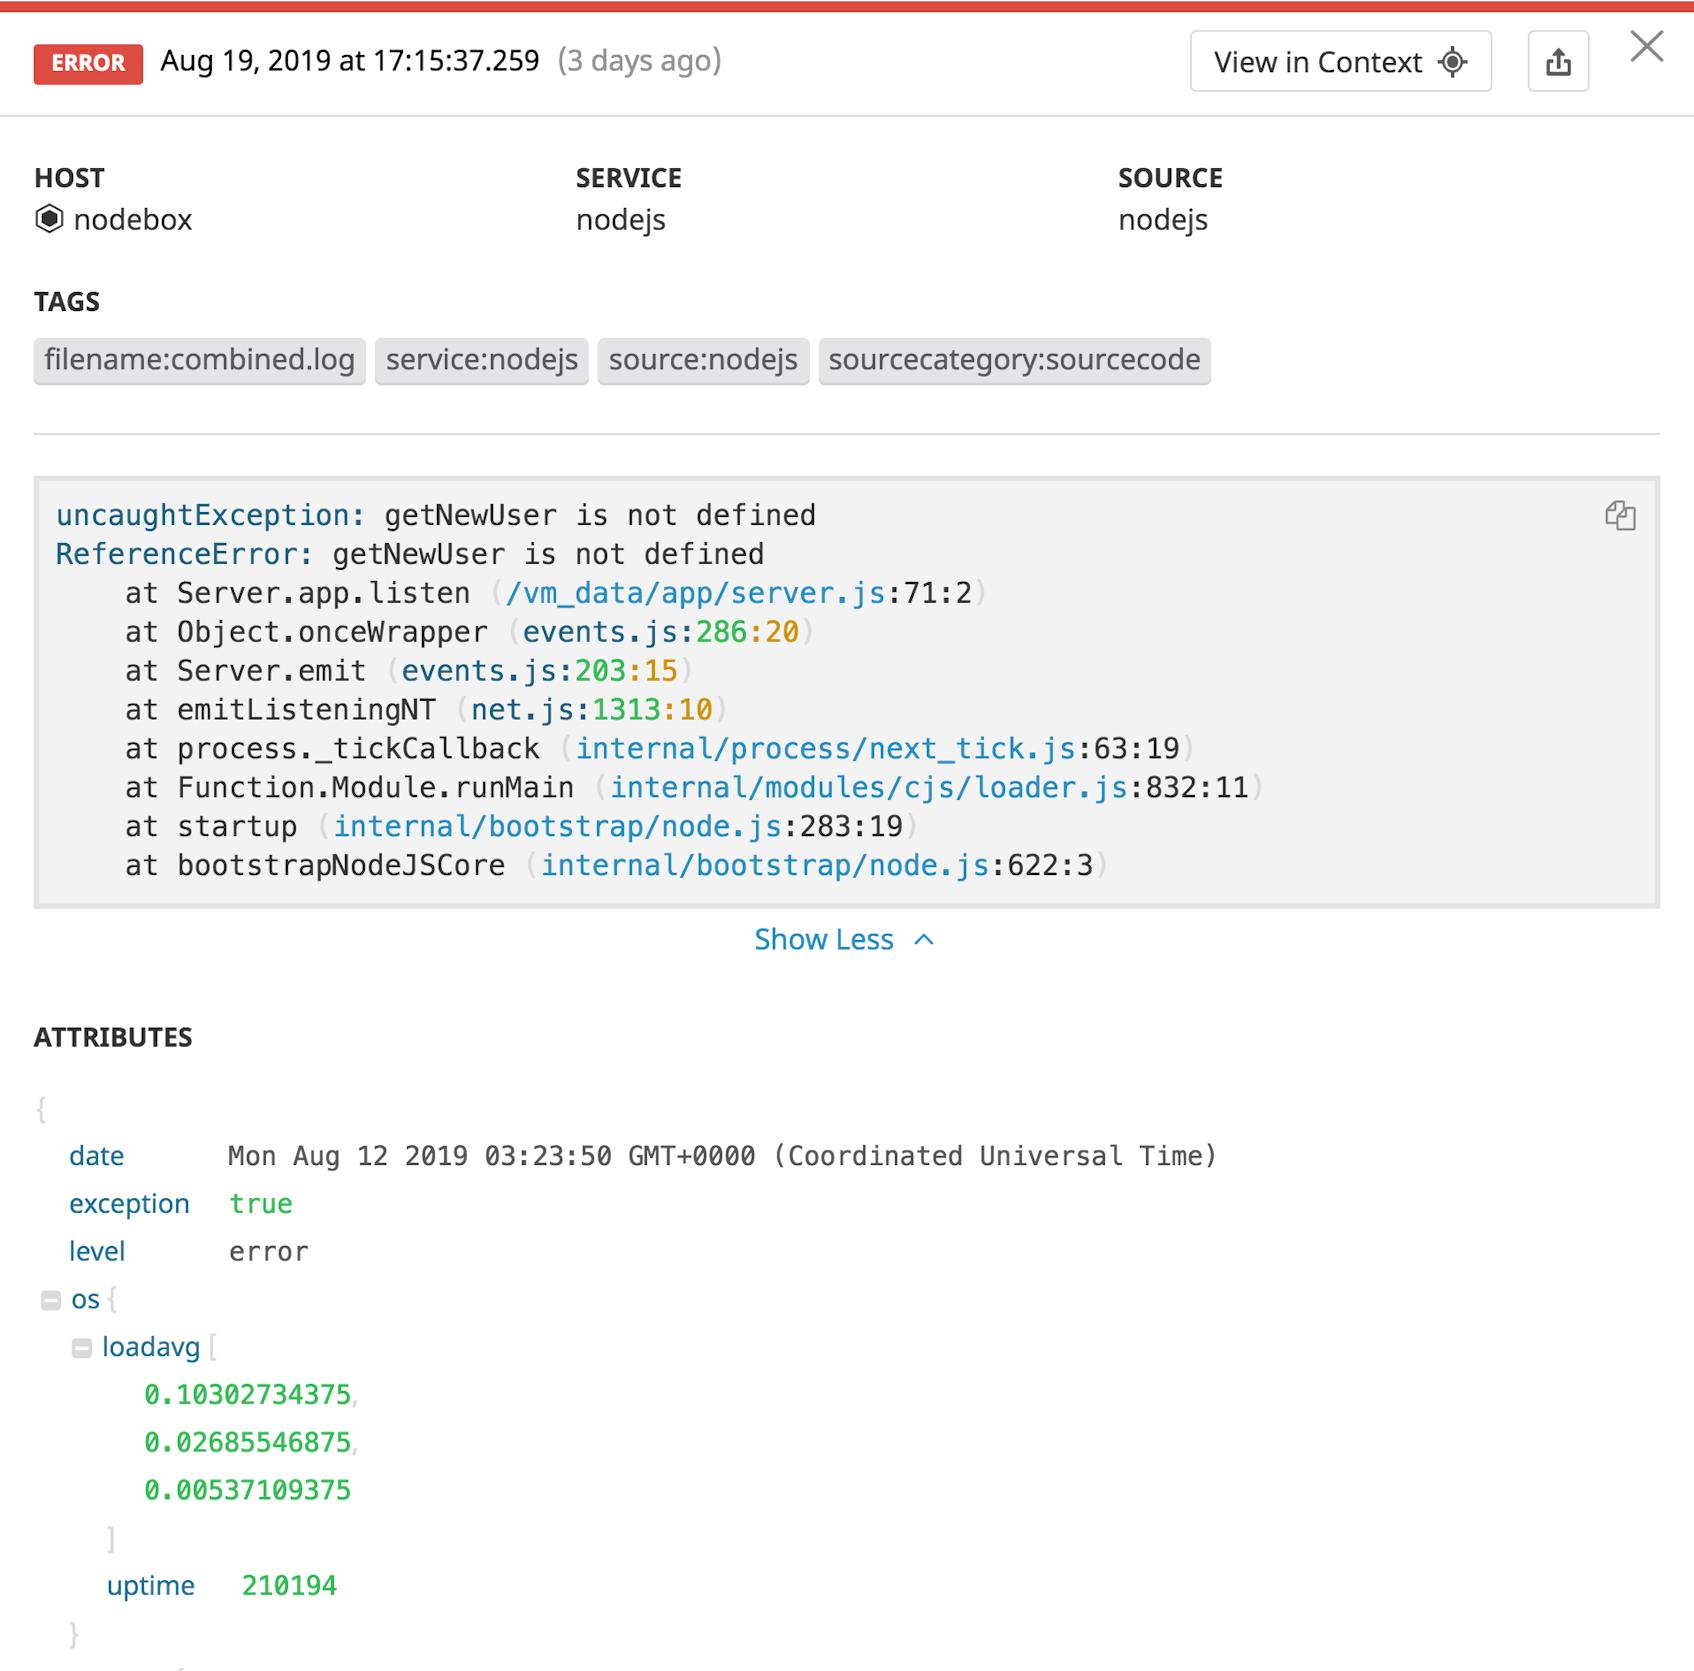
With the example above, your logger will automatically log all uncaught exceptions to the console and the same combined.log file used for your other logs. Your log management service can then automatically parse error logs and extract useful information for any logged exception—including uncaught exceptions. The example log below shows an exception that was thrown for calling a custom getNewUser() function that doesn’t exist in the application.
Your logs automatically include the full stack trace as well as information about process arguments and memory usage associated with the exception, giving you a comprehensive view for better root cause analysis.
Dig into your Node.js logs and visualize trends
Your logs provide valuable insights into the overall health of your application—but as your environment grows in complexity and generates larger volumes of data, it becomes more difficult to sift through all of those logs when you need to troubleshoot an issue. Centralizing all of your logs in one platform allows you to explore and correlate all of that data with monitoring data from other services in your environment.
By using a single platform to centralize, analyze, and alert on all your logs, you can extract critical insights without losing sight of the details. If you’re logging in JSON format (or using a library like Winston that automatically logs in JSON), your log management service can automatically parse your JSON logs for useful attributes.
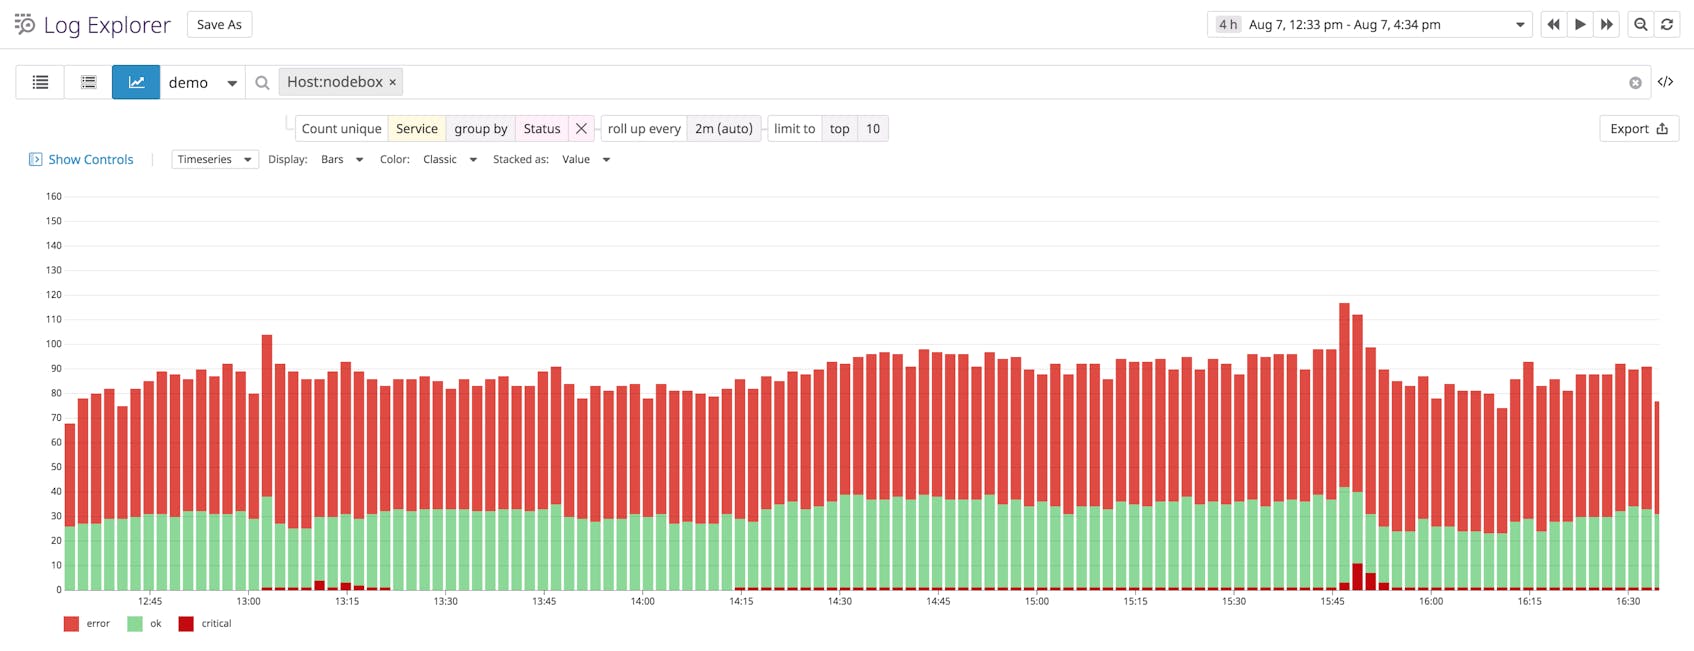
With log analytics, you can search and filter by any log attribute, including any custom metadata you incorporated into your logs (e.g., status, account information, IP addresses, session IDs). You can analyze these attributes to visualize trends in application or server activity. In the example below, we are graphing Node.js logs by the status attribute to visualize the rate of critical errors (in dark red) the server generates within a specific timeframe.
You can create custom metrics from these attributes in order to aggregate high-value logs and apply algorithms such as anomaly detection and forecasting to identify trends in application activity. Along with your application metrics and traces, logs provide a comprehensive view into your infrastructure so you can proactively monitor application workflows, incoming requests, and critical issues.
Connect logs to request traces
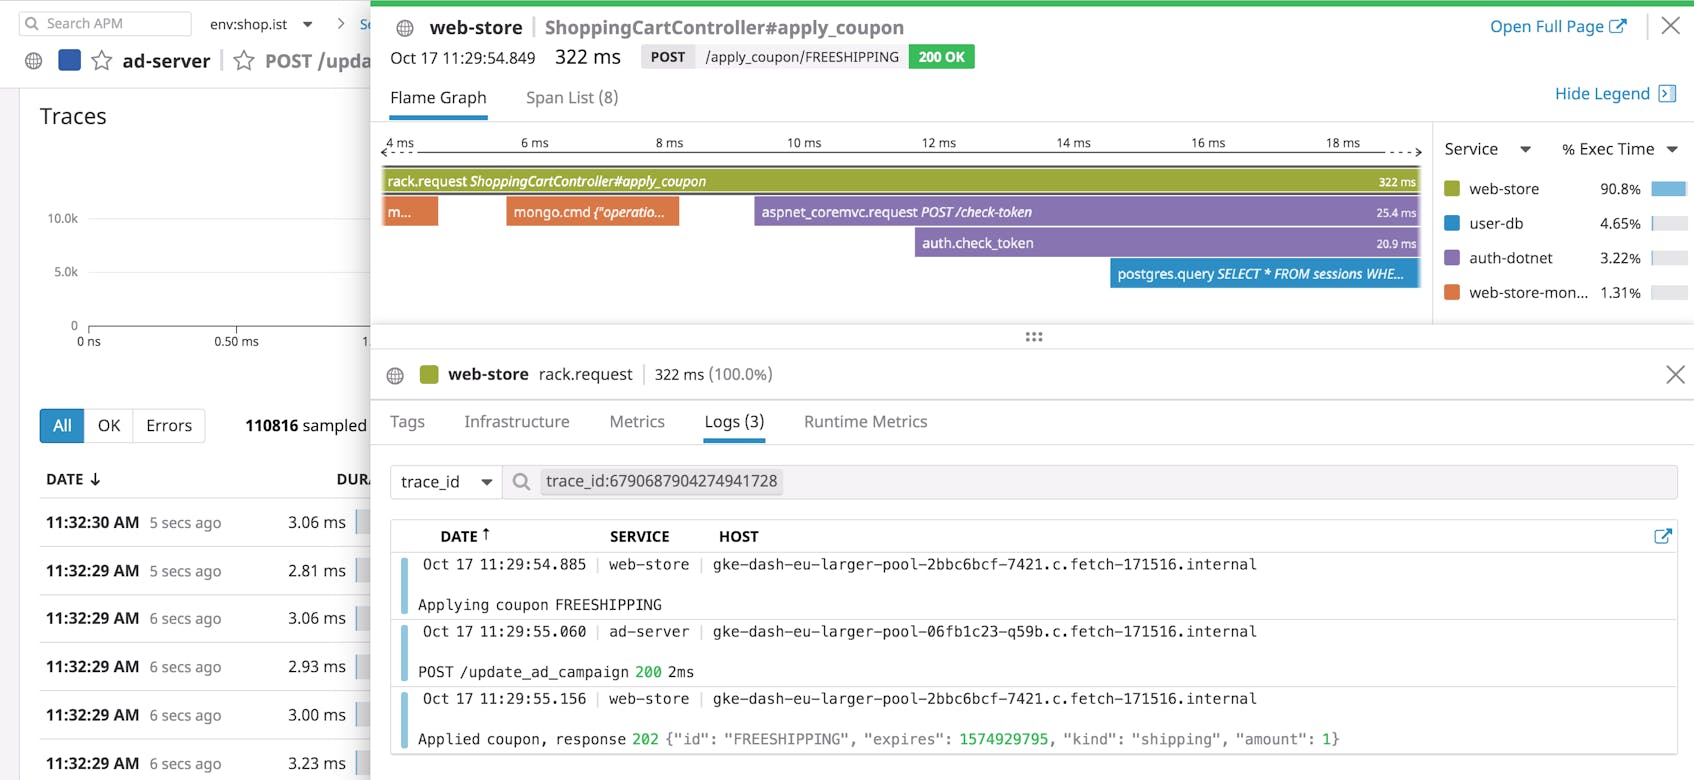
Once you’re collecting your Node.js logs, you can use a service like Datadog APM to seamlessly correlate logs with distributed request traces for added context. This gives you greater visibility into all of the services that processed a request. Datadog’s Node.js tracing library can automatically inject trace and span IDs in your logs so you can pivot from a log to a specific trace, or see the exact logs associated with a particular trace.
Start collecting your Node.js logs
By enriching your Node.js logs, and centralizing them with a service like Datadog, you can seamlessly monitor all of the services that make up your application. Check out our documentation for more information on monitoring Node.js logs. Or you can sign up for a free trial and start monitoring your Node.js application logs today.


