For many organizations, the success of their business depends on their ability to maintain on-prem or hybrid infrastructure. For instance, some companies rely on data centers for security reasons or to support their large, static workloads, while others must execute their critical business processes as close to the edge as possible to ensure minimal latency. This on-prem infrastructure can be composed of thousands of network appliances, such as servers, routers, switches, and firewalls, and any one of them can be a point of failure. This makes it important for teams to employ a monitoring strategy that provides full visibility into every network component, so they can identify issues before they impact their business.
Today, we’re pleased to introduce Network Device Monitoring, a device-first view that makes it easier than ever to monitor your network equipment from within the Datadog platform. In this post, we’ll discuss how Network Device Monitoring lets you get a high-level view of all of your network infrastructure, regardless of its scale, and troubleshoot issues on individual devices and their interfaces.
All of your devices and interfaces in one place
Datadog’s SNMP integration already enables users to automatically discover and monitor thousands of network devices from many of the leading vendors. Network Device Monitoring builds on our existing support by displaying key health and performance metrics from every layer of your network hardware in a device-oriented view.
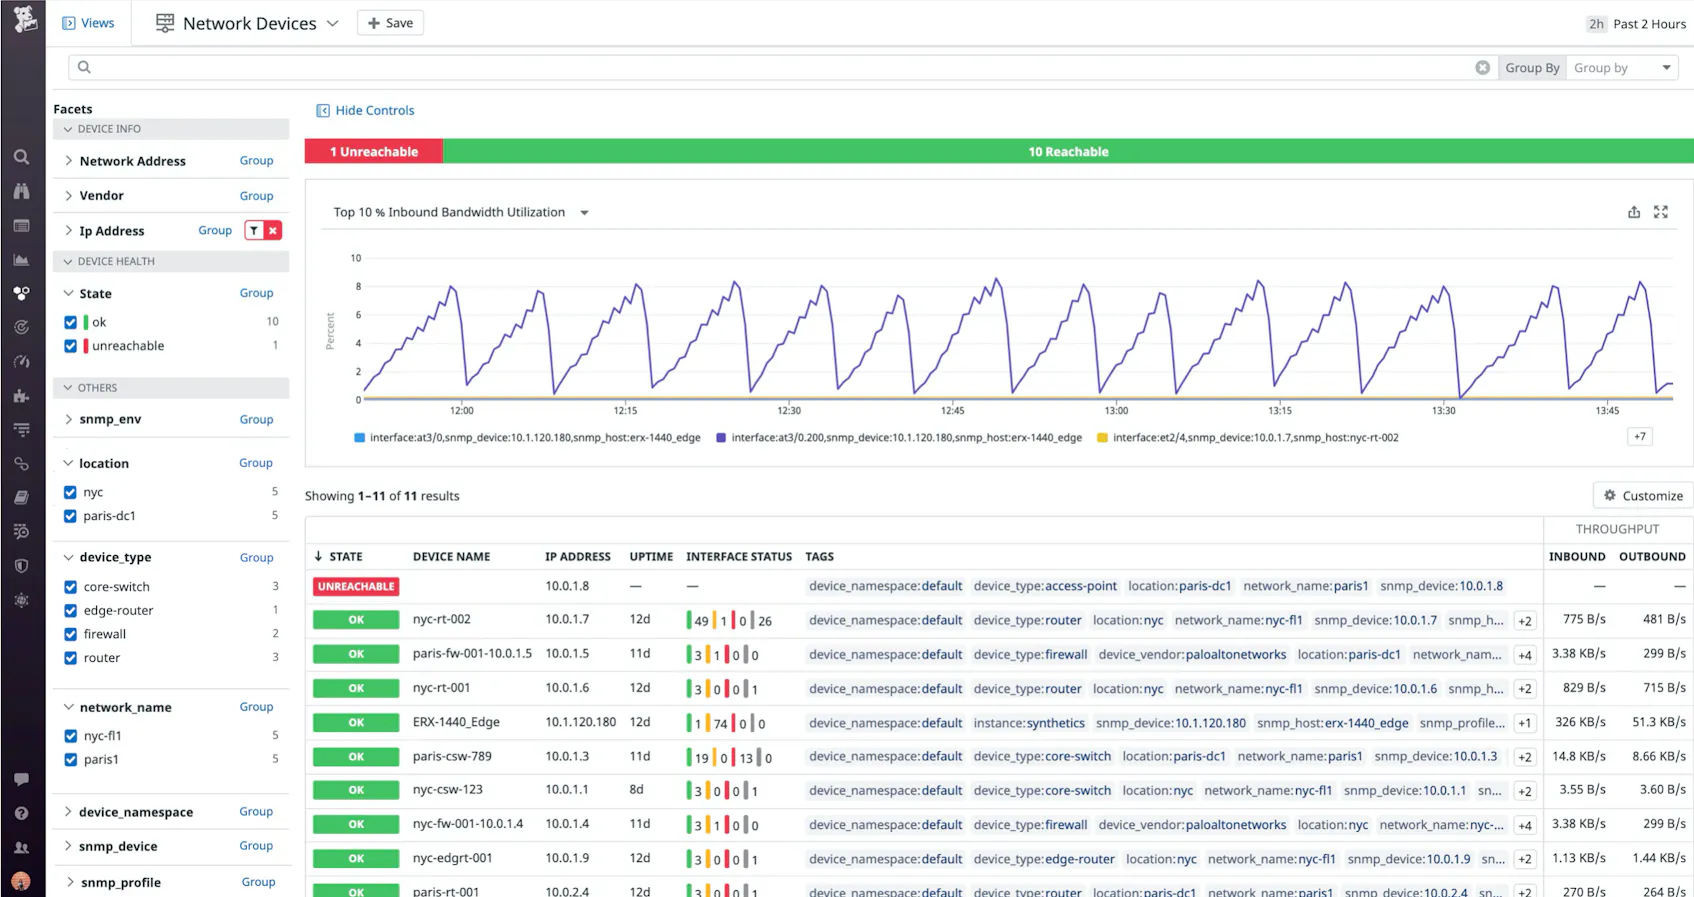
This new view lets you see at a glance whether there has been a sudden spike in the total number of unreachable devices. It also provides a comprehensive list of every device in your fleet, which includes a summary of its interfaces’ states, as well as its uptime, key tags and metadata, and total inbound and outbound throughput metrics. This data makes it easy to swiftly identify and investigate concerning activity in your on-prem or hybrid network. For example, latent network communication could be caused by widespread power loss, which you can quickly spot by checking whether all of your devices at a single site have suddenly had their uptimes reset back to zero.
Network latency may be caused by a single interface on a single device consuming excessive amounts of bandwidth, but for organizations with enormous device fleets, isolating the problematic interface can feel like searching for a needle in a haystack. Network Device Monitoring includes a timeseries graph of the top bandwidth utilization by interface, so you can easily identify which interfaces are top consumers of your allotted bandwidth—and spot individual interfaces that are oversaturated.
Devices can be tagged with identifying information such as device type, location, and network name, which enables your teams to easily isolate and keep track of the hardware components for which they are responsible. For instance, a team that manages networking gear at the edge can group the device list by location, and then filter for edge devices to ensure their equipment is performing optimally. They can also leverage Saved Views to keep their most used queries close at hand.
Drill down to the details
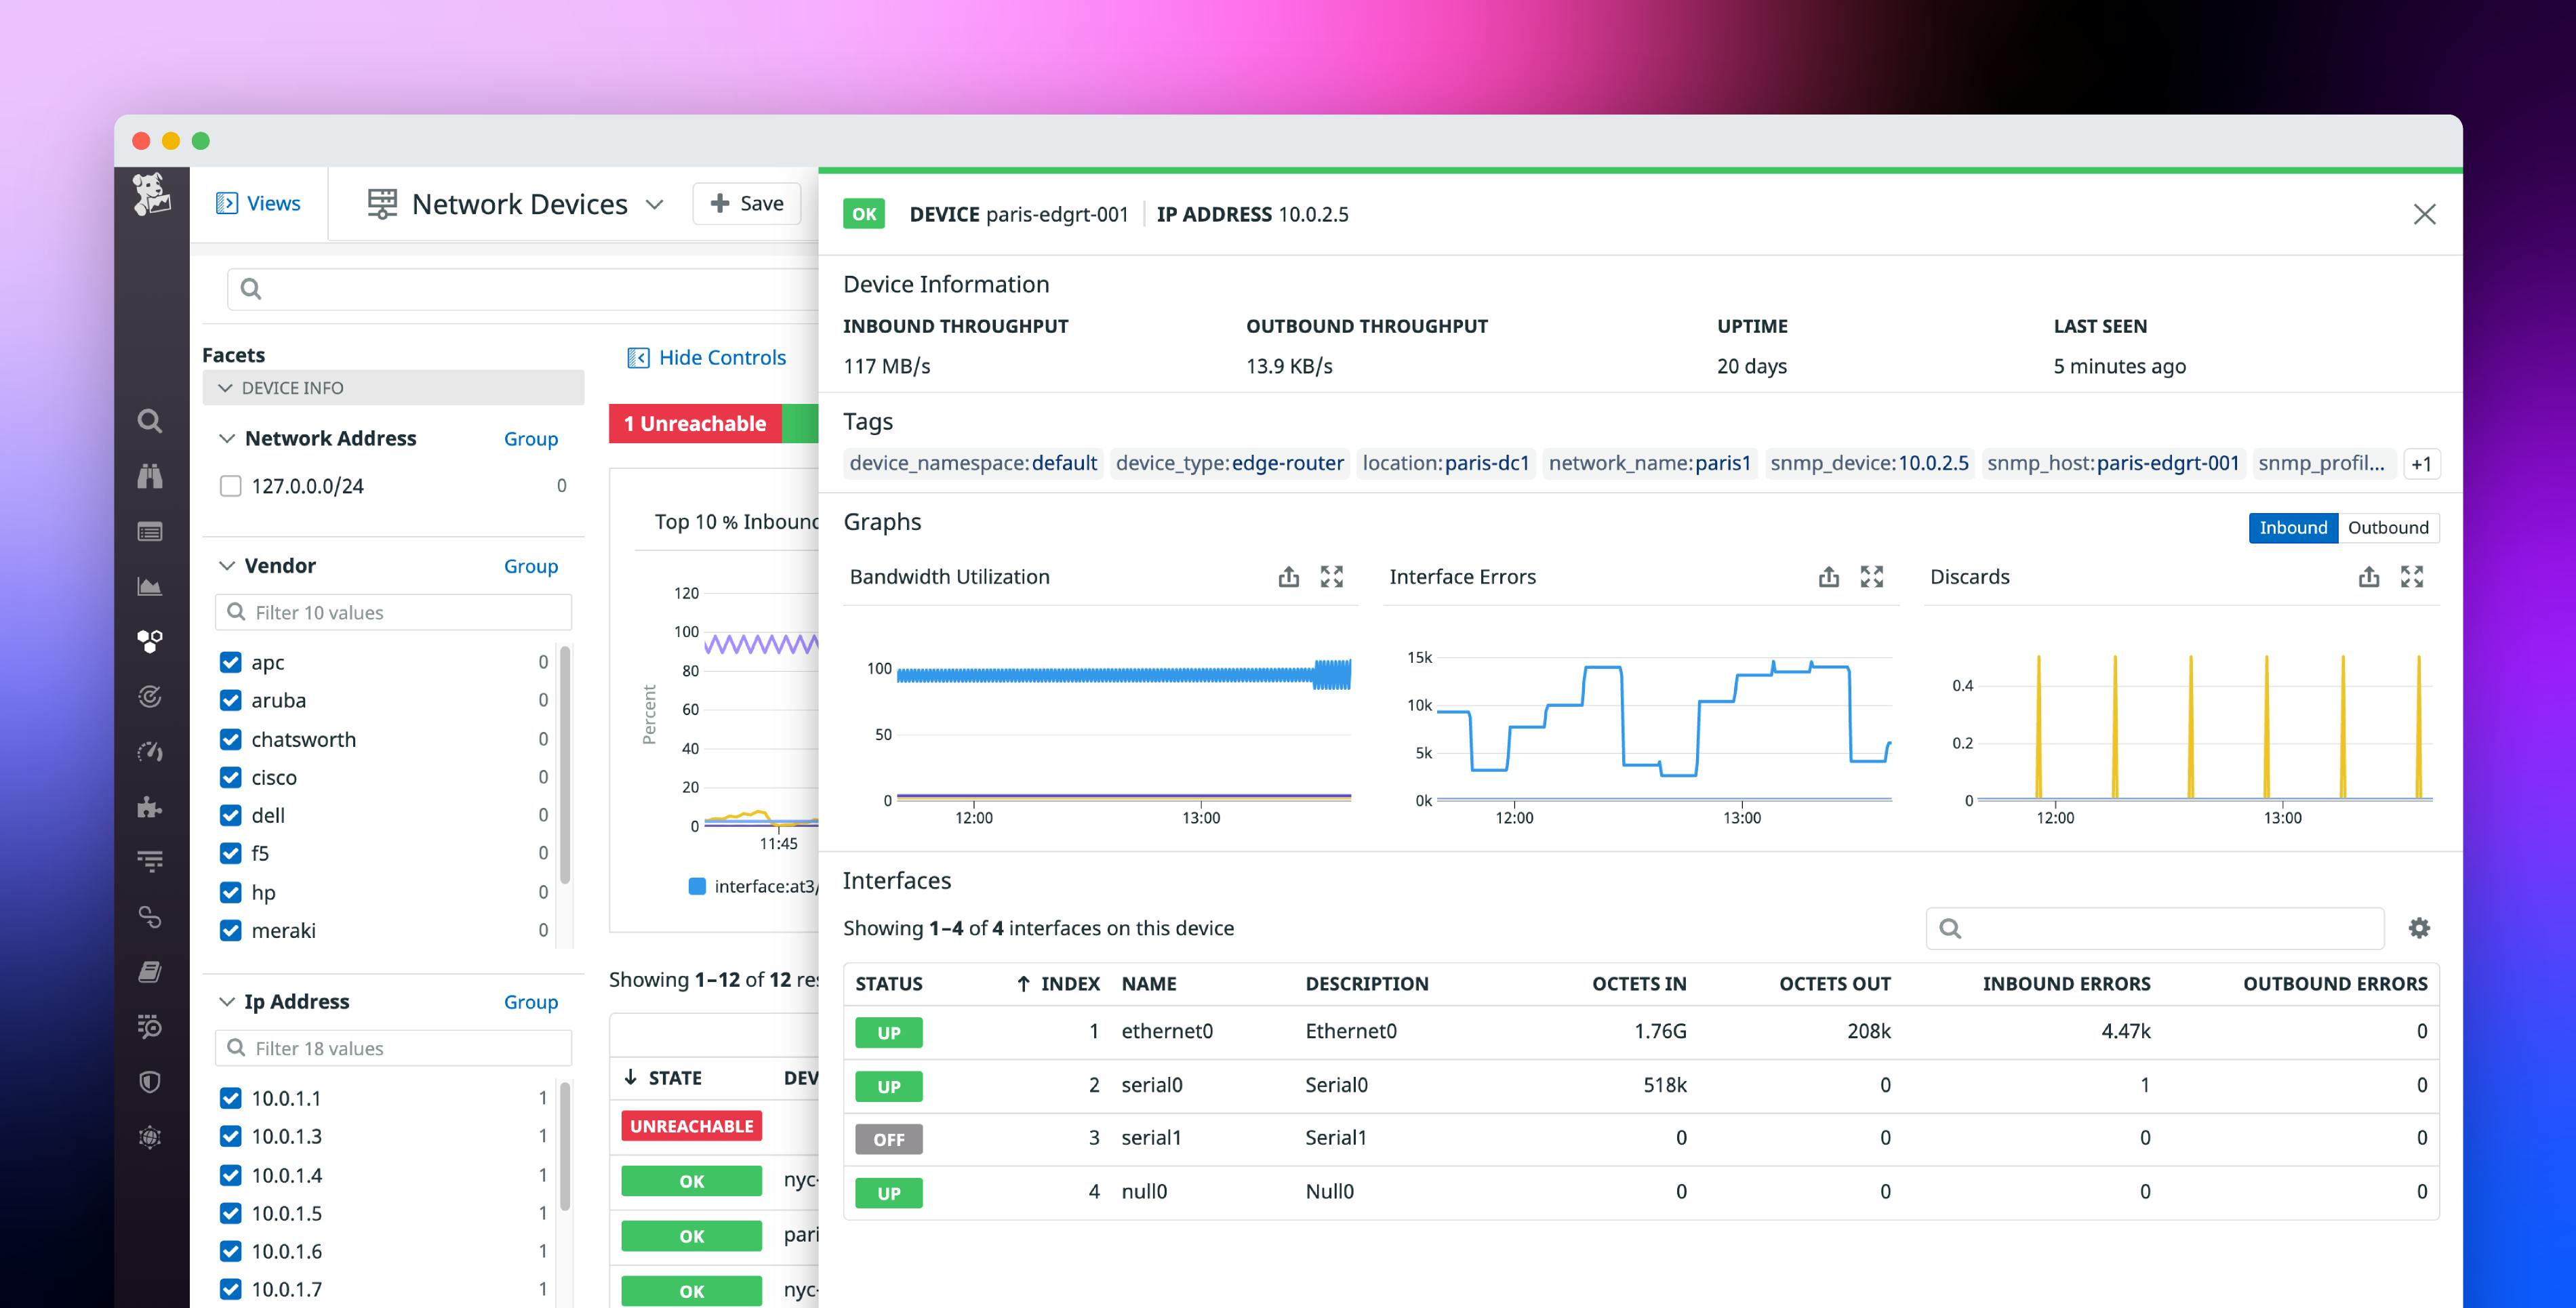
If you notice an issue with an individual device in the list view, you can click on it to view more granular details about its performance. This includes key metrics from every interface on the device, such as inbound and outbound errors, discards, and the total volume of data that it has sent or received.
These interface-level details ensure that teams have the information they need to resolve any issues before customers experience them. For instance, a spike in errors on an interface may indicate that data is not being successfully sent across the network. Once you’ve addressed the issue, you can configure machine learning-powered monitors on the problematic edge link, which will alert you to future anomalous activity as soon as it occurs.
Get started today
Datadog Network Device Monitoring allows network engineers to monitor their critical equipment, regardless of whether their environment is hybrid or fully on-prem. By collecting device-level data in the same platform as service-level metrics, traces, and logs, Datadog breaks down silos between DevOps and Network teams so they can work together to pinpoint the root cause of customer-facing issues.
You can get started by enabling Network Device Monitoring from the Datadog Agent. If you’re not yet a Datadog customer, sign up for a 14-day free trial.


