
Paul Gottschling

Addie Beach

Anjali Thatte
In Part 2 of this series, we've seen how RabbitMQ ships with tools for monitoring different aspects of your application: how your queues handle message traffic, how your nodes consume memory, whether your consumers are operational, and so on. While RabbitMQ plugins and built-in tools give you a view of your messaging setup in isolation, RabbitMQ weaves through the very design of your applications. To better understand your applications, you need to see how RabbitMQ performance relates to the rest of your stack.
Datadog gives you an all-at-once view of key RabbitMQ metrics, out of the box, with our RabbitMQ dashboard. You can also set alerts to notify you when the availability of your messaging setup is at stake. In this post we'll show you how to set up comprehensive monitoring using Datadog's RabbitMQ integration.
Installing the Agent
The Datadog Agent checks your host for RabbitMQ performance metrics and sends them to Datadog. The Agent can also capture metrics and trace requests from the rest of the systems running on your hosts. Instructions for installing the Agent are here. For some systems this only takes a single command. Check our documentation for more details on the Agent.
To integrate Datadog with RabbitMQ, you can use the management plugin or the Prometheus plugin. Note that the Prometheus plugin is enabled by default for RabbitMQ v3.8 and above.
Integrating RabbitMQ using the management plugin
The RabbitMQ integration provides support for the management plugin (see Part 2), which creates a web server that reports metrics from its host node and any nodes clustered with it. To configure the integration, first enable the RabbitMQ management plugin. Then follow the integration's instructions for adding a configuration file.
You'll want to edit the configuration file to reflect the setup of your hosts. A basic config looks like this:
init_config:
instances: - rabbitmq_api_url: http://localhost:15672/api/ rabbitmq_user: datadog rabbitmq_pass: some_passwordThe configuration file gives the Agent access to the management API. Within the instances section, change rabbitmq_api_url to match the address of the management web server, which should have permission to accept requests from the Agent's domain (see Part 2). Monitoring a cluster of RabbitMQ nodes requires that only one node exposes metrics to the Agent. The node will aggregate data from its peers in the cluster. For RabbitMQ versions 3.0 and later, port 15672 is the default.
While an API URL is required, a user is optional. If you provide one, make sure you've declared it within the server. Follow the RabbitMQ user management documentation to create users and assign privileges. If your system has more than 100 nodes or 200 queues, you'll want to specify the nodes and queues the Agent will check. See our template for examples of how to do this, along with other configuration options.
Once you've restarted the Agent, RabbitMQ should be reporting metrics, events, and service checks to Datadog. Verify this by running the info command and making sure the "Checks" section has an entry for "rabbitmq".
rabbitmq (5.21.0) ----------------- - instance #0 [OK] - Collected 33 metrics, 0 events & 2 service checksSince this version of the integration is based on the RabbitMQ management plugin, it gathers most of the same metrics. See Part 1 for what this entails, and our documentation for a full list of metrics.
The integration tags node-level metrics with the name of a node and queue-level metrics with the name of a queue. You can graph metrics by node or queue to help you diagnose RabbitMQ performance issues and compare metrics across your application.
Integrating RabbitMQ using the Prometheus plugin
In addition to the management plugin, you can also connect the RabbitMQ integration to Datadog via the Prometheus plugin as of February 2022. This plugin is geared towards users who want metrics in Prometheus’s OpenMetrics format. To get started, you’ll first need to enable the Prometheus plugin in RabbitMQ. You’re then able to add a configuration file by following the installation instructions.
Once the configuration file is ready, you can add the following host details to set up the Prometheus plugin:
instances: - prometheus_plugin: url: http://<HOST>:15692The RabbitMQ Prometheus plugin communicates with Datadog by sending OpenMetrics data over the HTTP API. You can access many of the same metrics as the management plugin—for a full list, view the RabbitMQ integration documentation. Datadog automatically translates OpenMetrics labels to tags, making it easy to query and categorize these metrics. The integration also allows you to collect aggregate and per-object data by choosing between two endpoints: /metrics and /metrics/detailed, with /metrics enabled by default.
The RabbitMQ dashboard
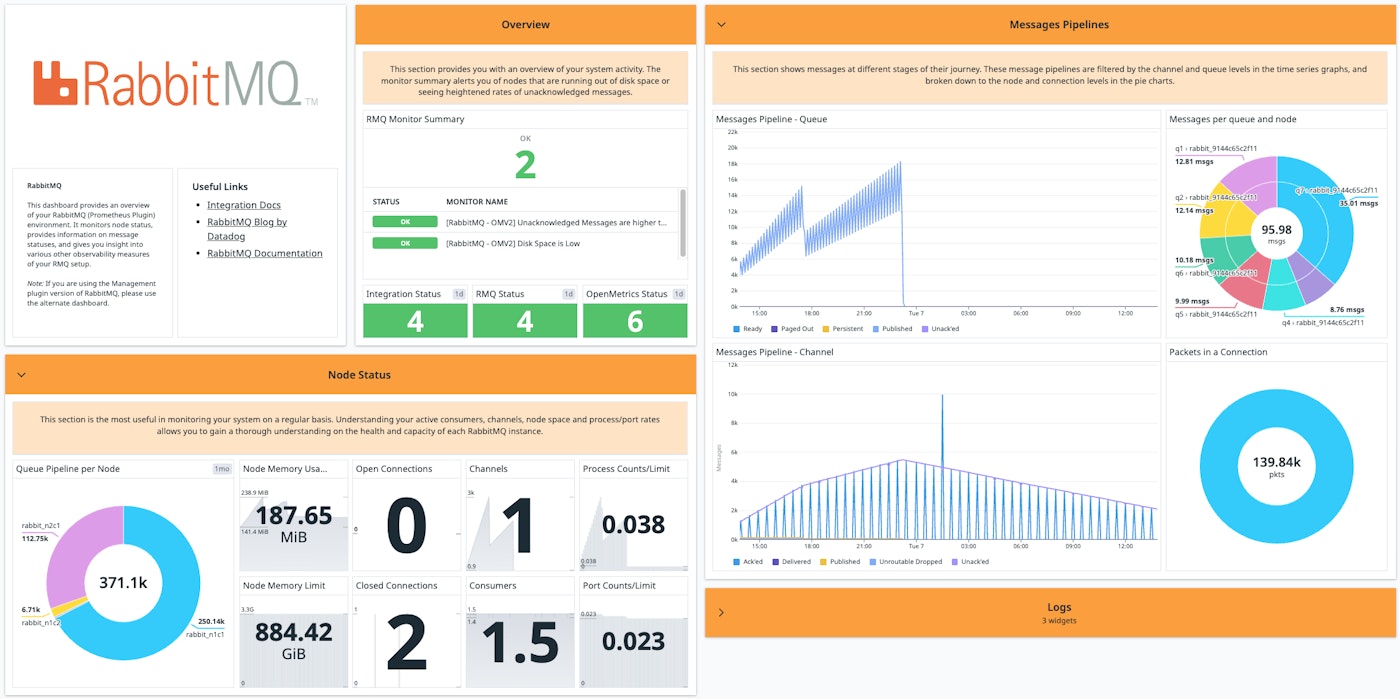
The RabbitMQ dashboard comes in two versions, depending on which plugin you used during the installation: the management dashboard or Prometheus dashboard.
The management dashboard
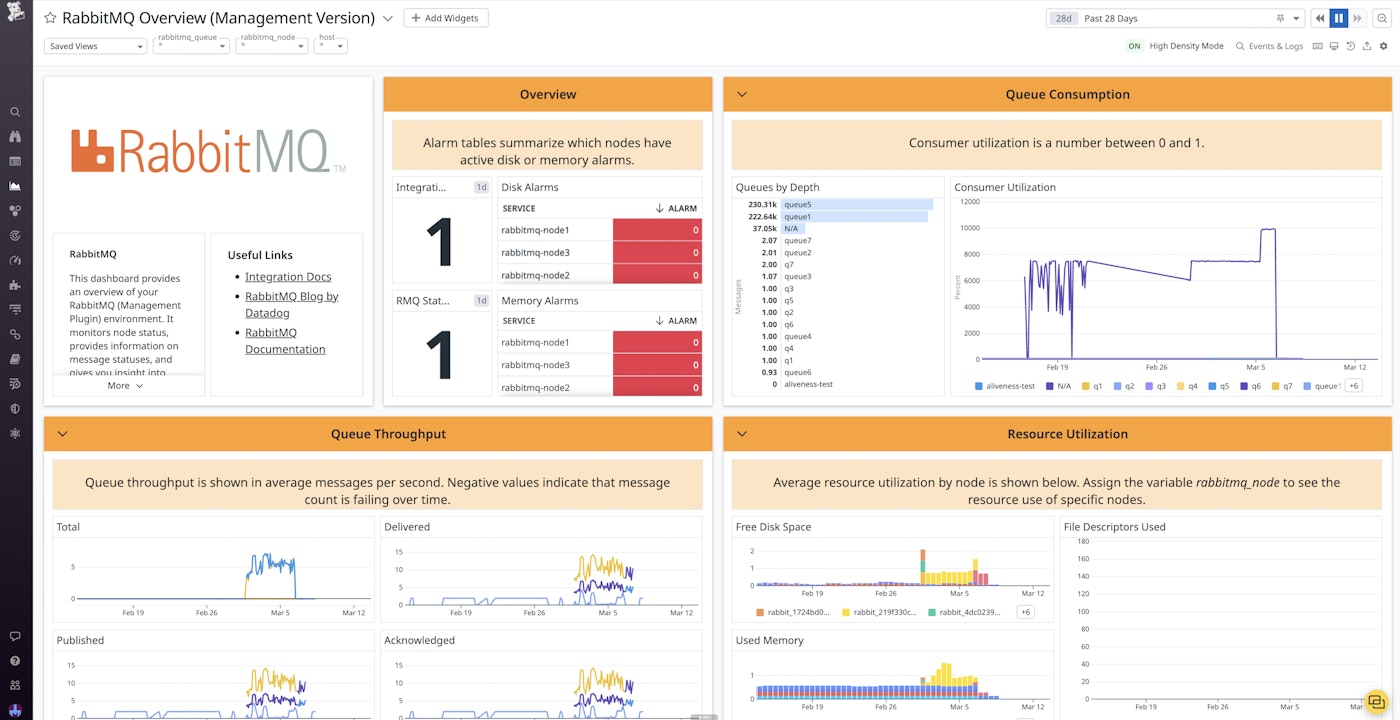
Because the RabbitMQ integration is able to gather metrics from the management plugin, it can take data that the plugin reports as static values and plot it over time.
For instance, the integration can use Datadog's built-in tags to visualize the memory consumption of either one or all of your queues. This example uses the demo application from Part 2, which handles data related to different boroughs in New York City. Our application queries an API, publishes the resulting JSON to a queue, consumes from the queue to aggregate the data by borough, then publishes to a final queue, where the data waits for a database to store it.

Graphing memory consumption is especially useful because of the way RabbitMQ handles the sizes of messages (see Part 1). You can see whether your messages take up more memory as they're processed, even as queue depths remain constant.
You can also use the RabbitMQ integration to correlate metrics for your queues with system-level metrics outside the scope of the RabbitMQ management plugin. The integration's out-of-the-box timeboard makes it easy to compare your network traffic, system load, system memory, and CPU usage with the state of your queues over time.
The Prometheus dashboard
If you configure the RabbitMQ integration using the Prometheus plugin, you can access an out-of-the-box dashboard tailored to your Prometheus metrics. Like the management dashboard, you can view information about your node status to optimize performance, including open/closed channels, active consumers, and memory utilization. However, you can also access pipeline visualizations that enable you to quickly spot bottlenecks. Color-coded node and queue graphs enable you to visualize the flow of messages among the different states: unacknowledged, published, persistent, paged out, and ready. The dashboard also comes with summaries of the built-in RabbitMQ monitors, so you can quickly identify any issues that need further investigation.
Alerts
Once you are collecting and visualizing RabbitMQ metrics, you can set alerts in Datadog to notify your team of performance issues.
As we've discussed in Part 1, RabbitMQ will block connections when its nodes use too many resources. With Datadog, you can identify resource shortages and use alerts to give your team time to respond.
To do this, determine the level of memory or disk use at which RabbitMQ will start blocking connections. You may want to check your configuration file for the value of vm_memory_high_watermark or disk_free_limit, then set an alert to trigger when that threshold is approaching. You can also use Datadog’s preconfigured monitors to notify you when disk usage or the message unacknowledged rate exceed our recommended limits. In the following screenshot, the threshold for memory use is set at 35 percent, which is a bit less than the 40-percent threshold at which RabbitMQ triggers an internal alarm.
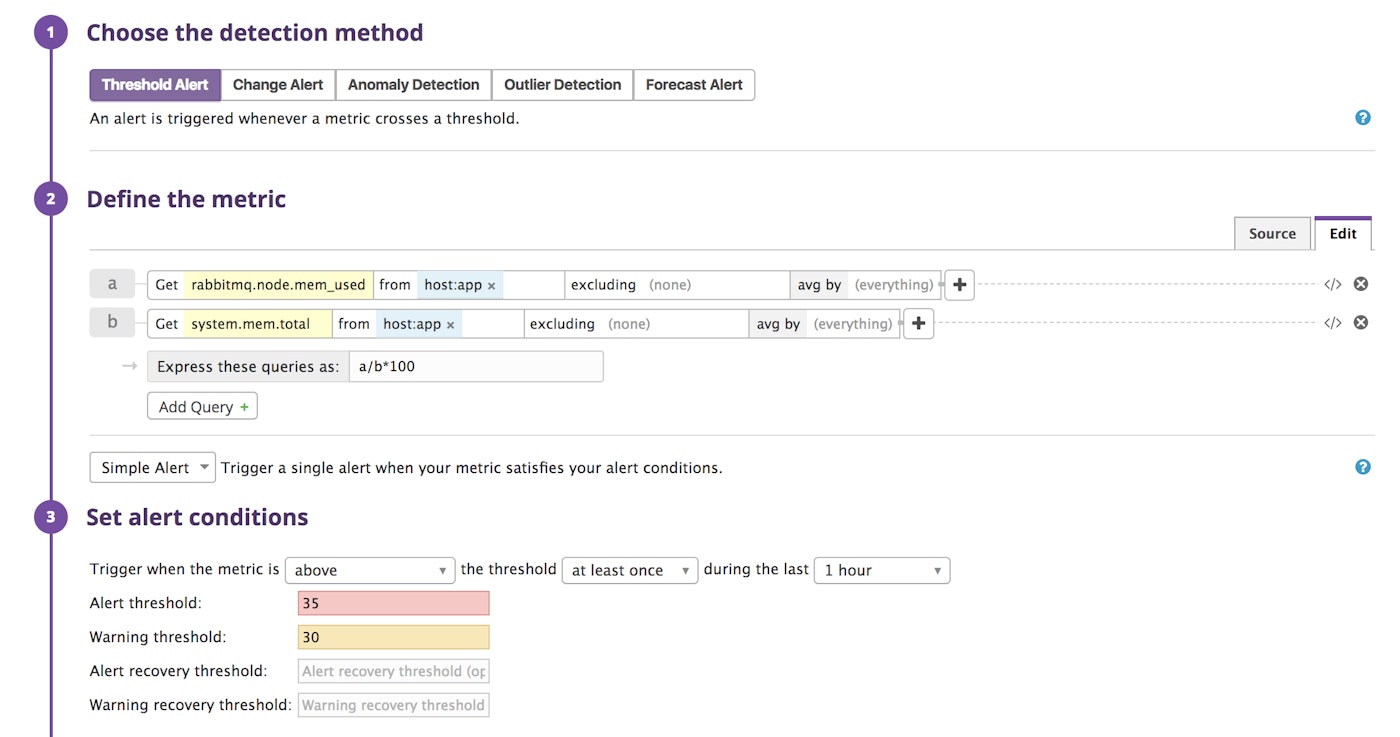
Datadog will notify your team using the channel of your choice (Slack, PagerDuty, OpsGenie, etc.) when RabbitMQ approaches its disk or memory limit.
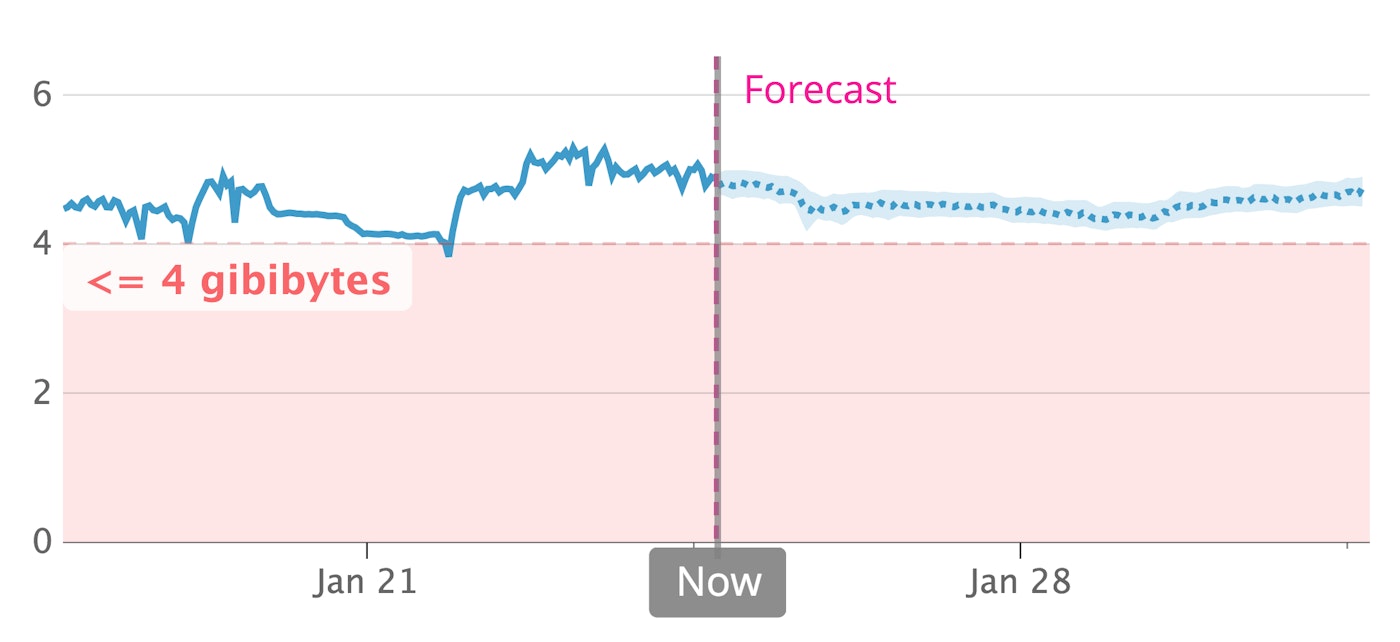
With Datadog forecasts, you can predict when RabbitMQ will reach a resource threshold and set alerts for a certain time in advance. For example, you can fire off a notification two weeks before RabbitMQ is likely to set a disk alarm, giving your team enough time to take action.
Application performance monitoring
Datadog can also help you understand the role RabbitMQ plays within your applications—how often RabbitMQ handles traffic from your HTTP servers, for example, and when RabbitMQ presents a bottleneck. Distributed tracing and APM visualizes the latency of RabbitMQ operations in the context of all the services that handle a request, so you can know when to tune RabbitMQ for a smoother user experience.
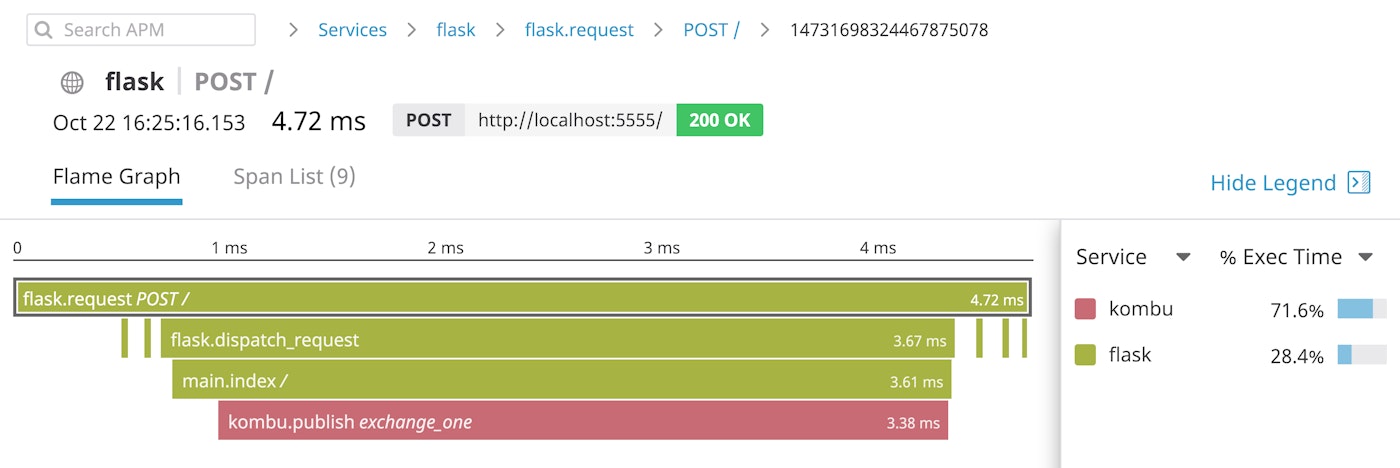
The flame graph above is from a Flask application that uses the Kombu AMQP client to publish user request data to the RabbitMQ exchange called exchange_one. We can see that our application takes longer to publish messages to exchange_one than to perform any other task.
Datadog can generate traces from RabbitMQ client libraries automatically. The Flask application above includes the following code, which configures the Datadog Agent to auto-instrument the Kombu client and Flask web framework:
from ddtrace import patch
patch(kombu=True)patch(flask=True)Datadog supports auto-instrumentation for RabbitMQ clients in several languages, including Node.js and Java. If there's not yet support for your own RabbitMQ client, you can instrument your code with Datadog's tracing libraries.
Distributed messaging, unified monitoring
In this post, we've shown how to install the Datadog Agent and the RabbitMQ integration. We've learned how to view RabbitMQ metrics in the context of your infrastructure, and how to alert your team of approaching resource issues.
Using Datadog, you can observe all aspects of your RabbitMQ setup, all in one place. And with more than 850 supported integrations for out-of-the-box monitoring, it's possible to see your RabbitMQ performance metrics alongside those of related systems like OpenStack. If you don’t yet have a Datadog account, you can sign up for a free trial and start monitoring your applications and infrastructure today.
Source Markdown for this post is available on GitHub. Questions, corrections, additions, etc.? Please let us know.


