Maxim Brown
When it comes to monitoring EC2 instances and any connected AWS services, Amazon CloudWatch is an excellent starting point. Connecting CloudWatch to Datadog will give you an even more detailed and comprehensive view of your entire infrastructure. Datadog automatically collects all available performance metrics for EC2, as well as for other AWS services, and retains your data for 15 months at full granularity.
Installing the Datadog Agent on your instances enables you to collect additional system-level metrics at 15-second resolution, including memory, disk latency, and others. And, with Datadog’s more than 1,000 integrations, you can visualize, correlate, and alert on metrics from AWS and your other systems from one place. Datadog APM lets you trace requests as they propagate through distributed services and cloud instances, helping you troubleshoot and identify bottlenecks in your cloud applications. And, with the addition of logging, Datadog provides a fully unified monitoring platform.

EC2 + Datadog: better together
There are two ways to start monitoring your EC2 instances with Datadog:
- Enable the AWS integration to automatically collect all EC2 metrics outlined in the first part of this series.
- Install Datadog’s Agent to collect detailed metrics from your instances, applications, and infrastructure.
These approaches are complementary. The AWS integration allows you to pull the full suite of AWS metrics into Datadog immediately, whereas the Agent allows you to monitor your applications and infrastructure with greater detail and depth.
Quickly reference key metrics and commands in our Amazon EC2 monitoring cheatsheet.
Enable the AWS integration
The fastest way to start monitoring EC2 metrics in Datadog is to enable the AWS integration. This lets Datadog collect metrics from EC2 and the rest of the AWS platform via the CloudWatch API without installing anything on your instances.
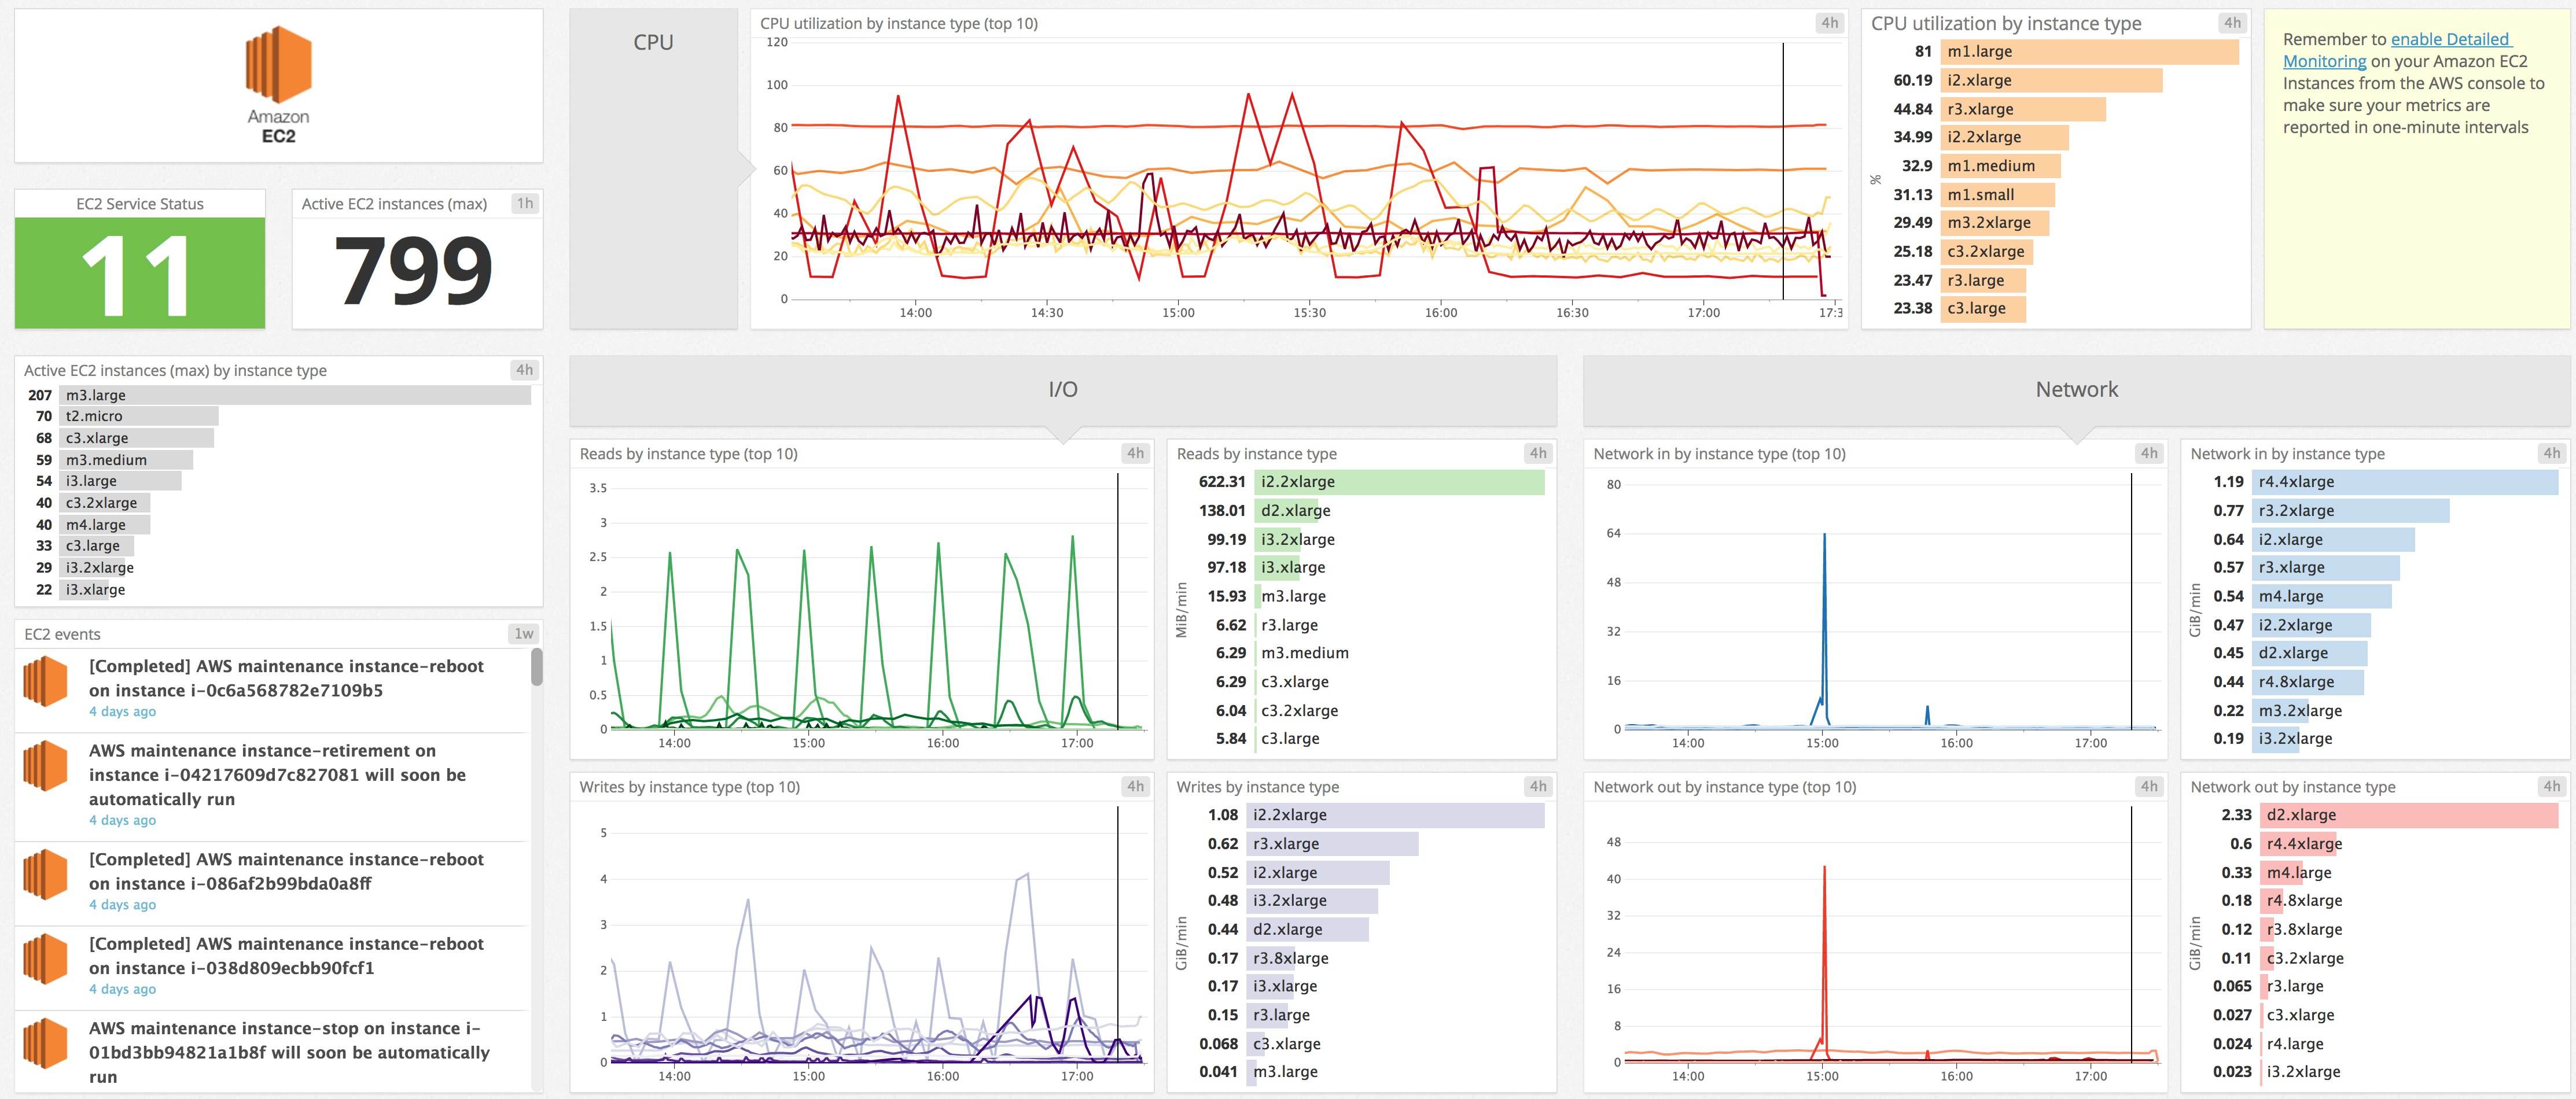
Activating the integration requires correctly delegating AWS IAM roles and giving the Datadog role read-only access. Once you’ve set up the Datadog role within AWS and connected it to your Datadog account, you will see a customizable, out-of-the-box EC2 dashboard on your Datadog dashboard list (as well as dashboards for any other AWS service you are monitoring with Datadog). This dashboard displays a number of key metrics organized to surface the instances with the highest levels of resource usage.
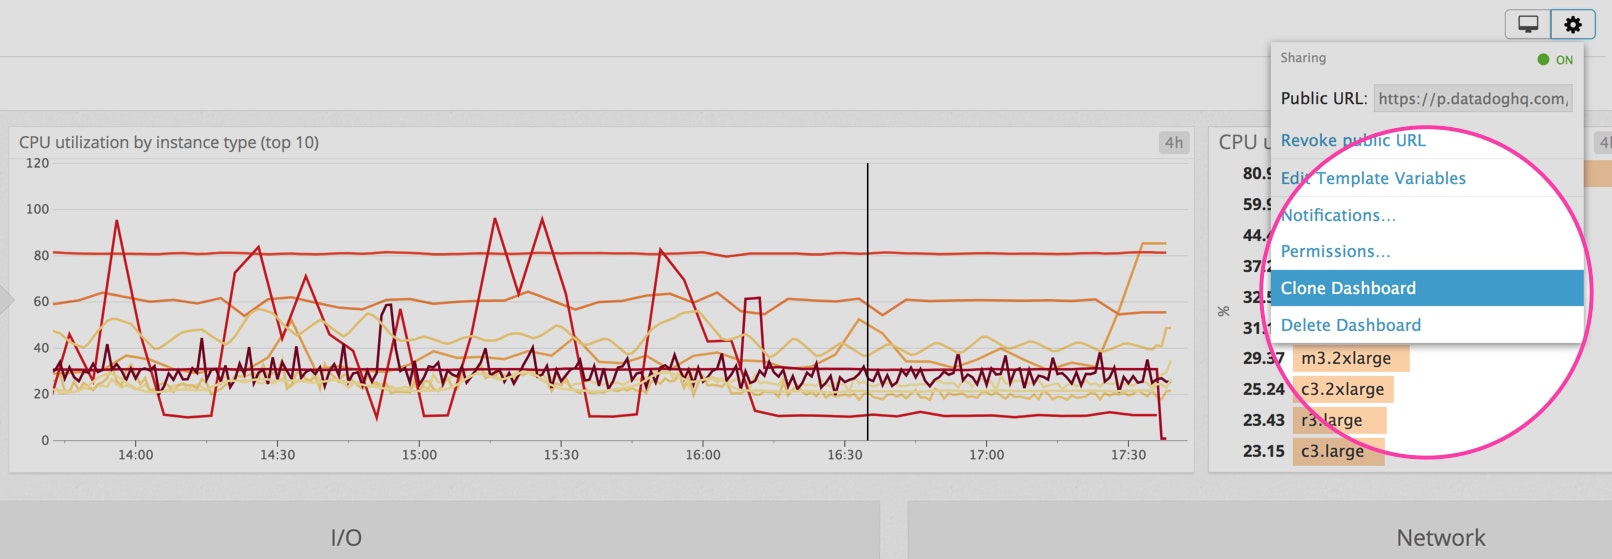
You can fully customize and extend the template EC2 dashboard to meet your specific monitoring needs. For instance, you might want to visualize your EC2 metrics alongside those from other AWS services, or from infrastructure technologies like Kubernetes or Docker. You can also bring in application performance metrics to correlate throughput, errors, and latency with key resource metrics from the underlying instances. To get started, simply click on the gear icon in the upper-right corner of the dashboard and select Clone Dashboard.

Deploying the Agent
The Datadog Agent is open source software that collects and forwards metrics from your instances. Any instances running the Agent will automatically appear in Datadog and begin reporting system-level metrics. You can also enable integrations for any supported applications and services that are running on your instance.
Installing the Agent
Installing the Agent on most platforms can be done with just a one-line command. For example, to get started on an instance running Amazon Linux, simply use the following:
DD_API_KEY=<API_KEY> DD_AGENT_MAJOR_VERSION=7 bash -c "$(curl -L https://raw.githubusercontent.com/DataDog/datadog-agent/master/cmd/agent/install_script.sh)"You should then see your instance reporting metrics in your Datadog account. You can also quickly and easily automate deployment of the Agent across your entire infrastructure with popular configuration management tools like Chef, Puppet, and Ansible, or to your container fleet via Docker or Kubernetes.
See the Datadog Agent documentation for more information.
Making the most of the Agent
Installing the Agent also means you can begin tracing requests with Datadog APM after instrumenting your applications. And, the Datadog Agent includes out-of-the-box support for log collection for AWS cloud services as well as popular technologies like Apache, NGINX, HAProxy, IIS, Java, and MongoDB.
If you are running containers on your instances, Datadog’s Live Container view gives you complete coverage of your fleet, with metrics reported at two-second resolution. And Live Process monitoring means you have the same level of visibility into all processes running across your entire distributed architecture.
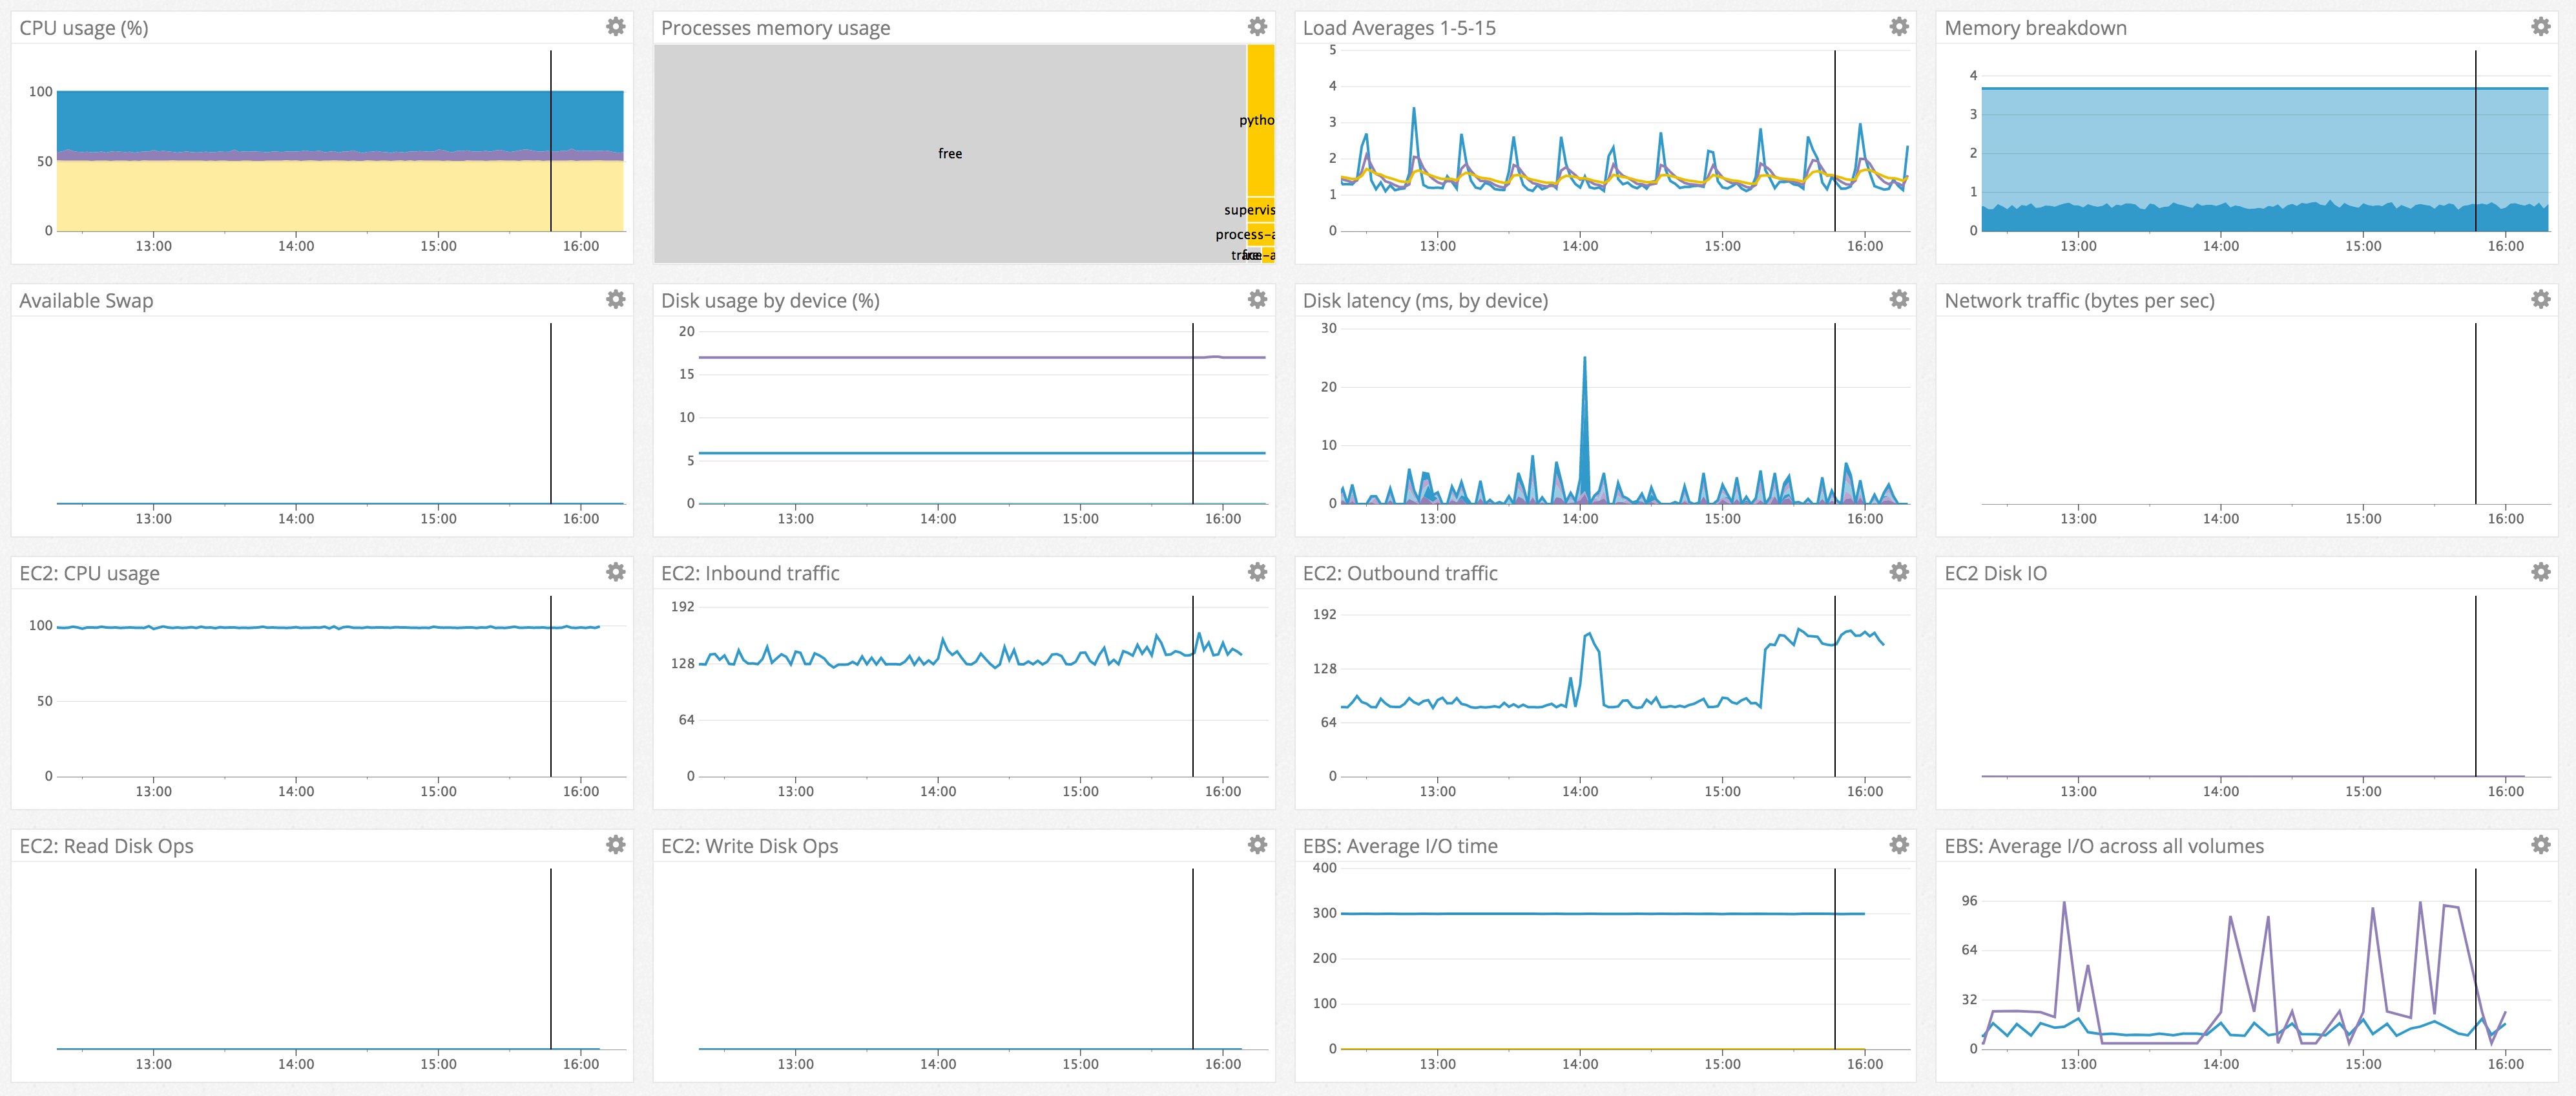
The screenshot below shows a default host dashboard for an EC2 instance with the Agent installed. Because the AWS EBS integration is also enabled, you can see that both CloudWatch EC2 and EBS metrics are automatically gathered. In addition, there are instance-level metrics not available through CloudWatch, such as a breakdown of CPU usage (as opposed to the virtualized CPU load for the instance), memory usage, and disk latency.

Breaking it down
All EC2 metrics collected by Datadog include CloudWatch’s EC2-specific dimensions as default tags: autoscaling-group, image, instance-type, and instance_id. Datadog automatically collects metrics from instances across all regions, so region and availability-zone are also imported as additional tags attached to all of your instances. Other EC2 metadata that is available as tags in Datadog includes name and security-group, as well as any custom tags you might have added. If the instance is part of an ECS cluster, the cluster name will also be included as a tag.

These tags enable you to easily filter your EC2 instances and any metrics collected from them. You can add additional tags in Datadog to allow even greater precision when you want to slice your hosts and drill down into particular problem areas in your infrastructure.
Alerts
Once Datadog is gathering your EC2 metrics and events, you can easily set up alerts for any potential issues. The ability to precisely scope your alerts using tags means it’s easy to automatically keep tabs on specific EC2 instance types, images, or Auto Scaling groups. You can also create alerts based on events from AWS. As we discussed in part one, it is important to monitor events to head off potential availability issues, or to know if you need to migrate important data from a soon-to-be-terminated instance. Datadog can alert your team, for example, if more than a set number of instances in a single availability zone are scheduled for maintenance.
Datadog alerts allow you to move beyond monitoring based on fixed thresholds to effectively identify issues in dynamic environments. With sophisticated alerting features like anomaly and outlier detection, Datadog can automatically notify you of unexpected instance behavior. And forecasting lets you stay ahead of future problems in your infrastructure and applications.
Getting started monitoring EC2 instances
In this post, we’ve walked you through integrating Amazon EC2 with Datadog so you can visualize and alert on key metrics from all your instances. Monitoring EC2 with Datadog gives you critical visibility into what’s happening in your core application infrastructure, and the rich suite of Datadog integrations with other applications and services means you can get a complete view of your entire environment.
If you don’t yet have a Datadog account, you can sign up for a free 14-day trial and start monitoring your cloud infrastructure, your applications, and your services today.


