Bruce Wang
Django is an open source Python-based web framework that dynamically renders web content based on the incoming HTTP request. Designed to follow the MVT design pattern and provide out-of-the-box functionality, the Django framework prioritizes rapid development and clean, reusable code. Django also puts an emphasis on versatility: the framework can support most web content formats, such as HTML and XML, and since Django is Python-based, it can run on all common server operating systems.
Deploying a Django application requires a few supporting technologies. A database stores application data. A web server listens for incoming HTTP requests and is responsible for sending responses back to clients, as well as serving static files and routing any other requests to the Web Server Gateway Interface (WSGI). A WSGI facilitates communication between the web server and the Python application. We will be using PostgreSQL for our database, NGINX as our web server, and Gunicorn as our WSGI in this guide.
This guide will cover how to monitor your Django application performance (along with PostgreSQL, NGINX, and Gunicorn) using Datadog so that you can collect metrics, logs, and request traces from the various parts of your application. Command snippets in this guide are provided for Linux hosts; if you are using a different operating system, some commands may differ from the ones presented.
Getting started with Datadog
To collect metrics, request traces, and logs from your application, you’ll need to install the latest version of the Datadog Agent on your application host. You can download and install the Agent with the following command, which will prompt you for your system root password:
DD_API_KEY=<API_KEY> DD_AGENT_MAJOR_VERSION=7 bash -c "$(curl -L https://raw.githubusercontent.com/DataDog/datadog-agent/master/cmd/agent/install_script.sh)"If you have a Datadog account set up, you can find your API key here. If you haven’t tried Datadog yet, you can get started with a free trial.
Log collection, which we’ll cover below, requires version 6 of the Agent. If you’re using a previous version, run the following command to upgrade the Agent and carry over your pre-existing configuration files:
DD_UPGRADE="true" DD_API_KEY=<API_KEY> DD_AGENT_MAJOR_VERSION=7 bash -c "$(curl -L https://raw.githubusercontent.com/DataDog/datadog-agent/master/cmd/agent/install_script.sh)"Configuring the Datadog Agent
Next we’ll ensure that the Agent is properly configured to collect logs and request traces. Open up the datadog.yaml configuration file in the Agent directory:
sudo vi /etc/datadog-agent/datadog.yamlBy default, APM request tracing is enabled on versions 5.13 and greater of the Datadog Agent. To enable APM tracing on older compatible versions (5.11 or greater), add the parameter apm_enabled: true to the configuration file.
To enable log collection (Agent version 6), set log_enabled: true in /etc/datadog-agent/datadog.yaml. Restart the Agent to reload the configuration file:
sudo service datadog-agent restartSetting up Django performance monitoring
Using Datadog APM, you can trace requests across all the different services supporting your application. With our Django integration, requests, template renders, and database queries are all automatically traced. To set up the trace client for Python applications, install the ddtrace library in your application’s environment:
pip install ddtrace
After installing the ddtrace client, run the ddtrace-run wrapper with your Gunicorn command, keeping all the arguments intact:
ddtrace-run gunicorn [...] myapp.wsgi:application [...]To enable the Django integration, add the following under the INSTALLED_APPS header in your application’s settings.py file:
INSTALLED_APPS = [ # your Django apps... 'ddtrace.contrib.django',]Restart Gunicorn to reload your settings configuration:
sudo service gunicorn restartAfter sending a few requests to your web app, services should start showing up in the Datadog APM page under your app’s environment tag.
Keeping track of PostgreSQL
Datadog is now automatically recording services and request traces from your Django application. In this section, you’ll learn how to integrate Datadog with PostgreSQL directly, allowing you to visualize and alert on dozens of database-specific metrics, as well as any data contained in your Postgres logs.
PostgreSQL metrics
To prepare PostgreSQL for metric collection, start a psql session as a user with CREATEROLE privileges. In your session, run these commands to create a datadog user with access to pg_stat_database:
create user datadog with password '<PASSWORD>';grant SELECT ON pg_stat_database to datadog;To confirm that the new user has the right read access, run the following shell command:
psql -h localhost -U datadog postgres -c \ "select * from pg_stat_database LIMIT(1);" && echo -e "\e[0;32mPostgres connection - OK\e[0m" || \ || echo -e "\e[0;31mCannot connect to Postgres\e[0m"If you see Postgres connection - OK, then you have successfully created the correct user.
To configure the Agent to collect PostgreSQL metrics, create a conf.yaml file from the provided template.
sudo cp /etc/datadog-agent/conf.d/postgres.d/conf.yaml.example /etc/datadog-agent/conf.d/postgres.d/conf.yamlAdd the following to your newly created file:
init_config:
instances: - host: localhost port: 5432 username: datadog password: <PASSWORD>
PostgreSQL logs
To set up PostgreSQL for log collection, edit the /etc/postgresql/<version>/main/postgresql.conf file and make sure the following parameters are set under the Error Reporting and Logging header:
logging_collector = onlog_directory = '/var/log/postgresql'log_filename = 'pg.log'log_statement = 'all'log_line_prefix= '%m [%p] %d %a %u %h %c 'log_file_mode = 0644Restart PostgreSQL to reload the configuration.
sudo service postgresql restartIf you restart PostgreSQL and the log file at /var/log/postgresql/pg.log isn’t showing up, or is empty, you may have to create the file yourself and give ownership of the /var/log/postgresql directory to user postgres.
sudo chown postgres /var/log/postgresql/To configure the Datadog Agent to collect PostgreSQL logs, add the following lines to the end of /etc/datadog-agent/conf.d/postgres.d/config.yaml:
logs: - type: file path: /var/log/postgresql/pg.log source: postgresql sourcecategory: database service: my_databaseRestart the Datadog Agent to reload the configuration.
sudo service datadog-agent restartYou can check to see if your configuration is correct by running the following command:
sudo datadog-agent statusYou should see output similar to the following:
Collector=========
Running Checks ============== postgres -------- Total Runs: 5 Metrics: 29, Total Metrics: 145 Events: 0, Total Events: 0 Service Checks: 1, Total Service Checks: 5
[...]
Logs-agent========== postgres -------- Type: file Path: /var/log/postgresql/pg.log Status: OK Inputs: /var/log/postgresql/pg.logIntegrating NGINX with Datadog
In this section, you’ll learn how to collect NGINX metrics and logs with Datadog, giving you insights into the traffic coming in and out of your application, as well as the overall health of your web server.
NGINX metrics
The NGINX Agent Check retrieves metrics from the NGINX status page, which depends on the stub status module. If you don’t have the stub status module installed, you may need to reinstall or rebuild NGINX. Use the following command to check if your version of NGINX was compiled with the module:
nginx -V 2>&1| grep -o http_stub_status_moduleIf the stub status module is installed, the command will output http_stub_status_module.
To prepare NGINX for metrics reporting, create a status.conf file in /etc/nginx/conf.d and populate it with the following, replacing stub_status; with status; if you are using NGINX Plus:
server { listen 81; server_name localhost; access_log off;
allow 127.0.0.1; deny all;
location /nginx_status { stub_status; }}To configure the agent for NGINX metric collection, create a conf.yaml file from the provided example.
sudo cp /etc/datadog-agent/conf.d/nginx.d/conf.yaml.example /etc/datadog-agent/conf.d/nginx.d/conf.yamlAdd the following to your newly created file to start collecting NGINX metrics from the status page:
init_config:instances: - nginx_status_url: http://localhost:81/nginx_status/NGINX logs
For collection of NGINX logs, uncomment the following lines in the same conf.yaml file:
logs: - type: file path: /var/log/nginx/access.log service: my_web_app source: nginx sourcecategory: http_web_access
- type: file path: /var/log/nginx/error.log service: my_web_app source: nginx sourcecategory: http_web_accessRestart the Datadog Agent to reload the configuration.
sudo service datadog-agent restartYou can check to see if your configuration is correct by running the following command:
sudo datadog-agent statusError-free NGINX sections should appear under both the Collector and Logs-agent headers.

Gathering Gunicorn metrics
This section will cover the collection of Gunicorn metrics using Datadog, giving you access to important information about the requests being handled by your application.
The Gunicorn Agent Check requires the setproctitle Python package to be installed in the Gunicorn application’s Python environment. To install the package, activate your app’s Python environment and run:
pip install setproctitleTo start collecting Gunicorn metrics, create a conf.yaml file from the provided example.
sudo cp /etc/datadog-agent/conf.d/gunicorn.d/conf.yaml.example /etc/datadog-agent/conf.d/gunicorn.d/conf.yamlAdd the following to your newly created conf.yaml file, where my_web_app is the name of your application (you can check your application’s name using the command ps -ef | grep 'gunicorn'):
init_config:
instances: - proc_name: my_web_appRestart the Datadog Agent to reload the configuration.
sudo service datadog-agent restartDatadog’s Gunicorn integration collects information on the number and status of worker processes. To collect metrics about request rates, status codes, request durations, and more, you can configure Gunicorn to send metrics to the Datadog Agent using the StatsD protocol. Simply append --statsd-host=localhost:8125 to your Gunicorn command and restart Gunicorn to see your changes take effect.
sudo service gunicorn restartRunning sudo datadog-agent status should give output similar to the following:
[...]
gunicorn -------- Total Runs: 1 Metrics: 2, Total Metrics: 2 Events: 0, Total Events: 0 Service Checks: 1, Total Service Checks: 1
[...]
=========DogStatsD=========
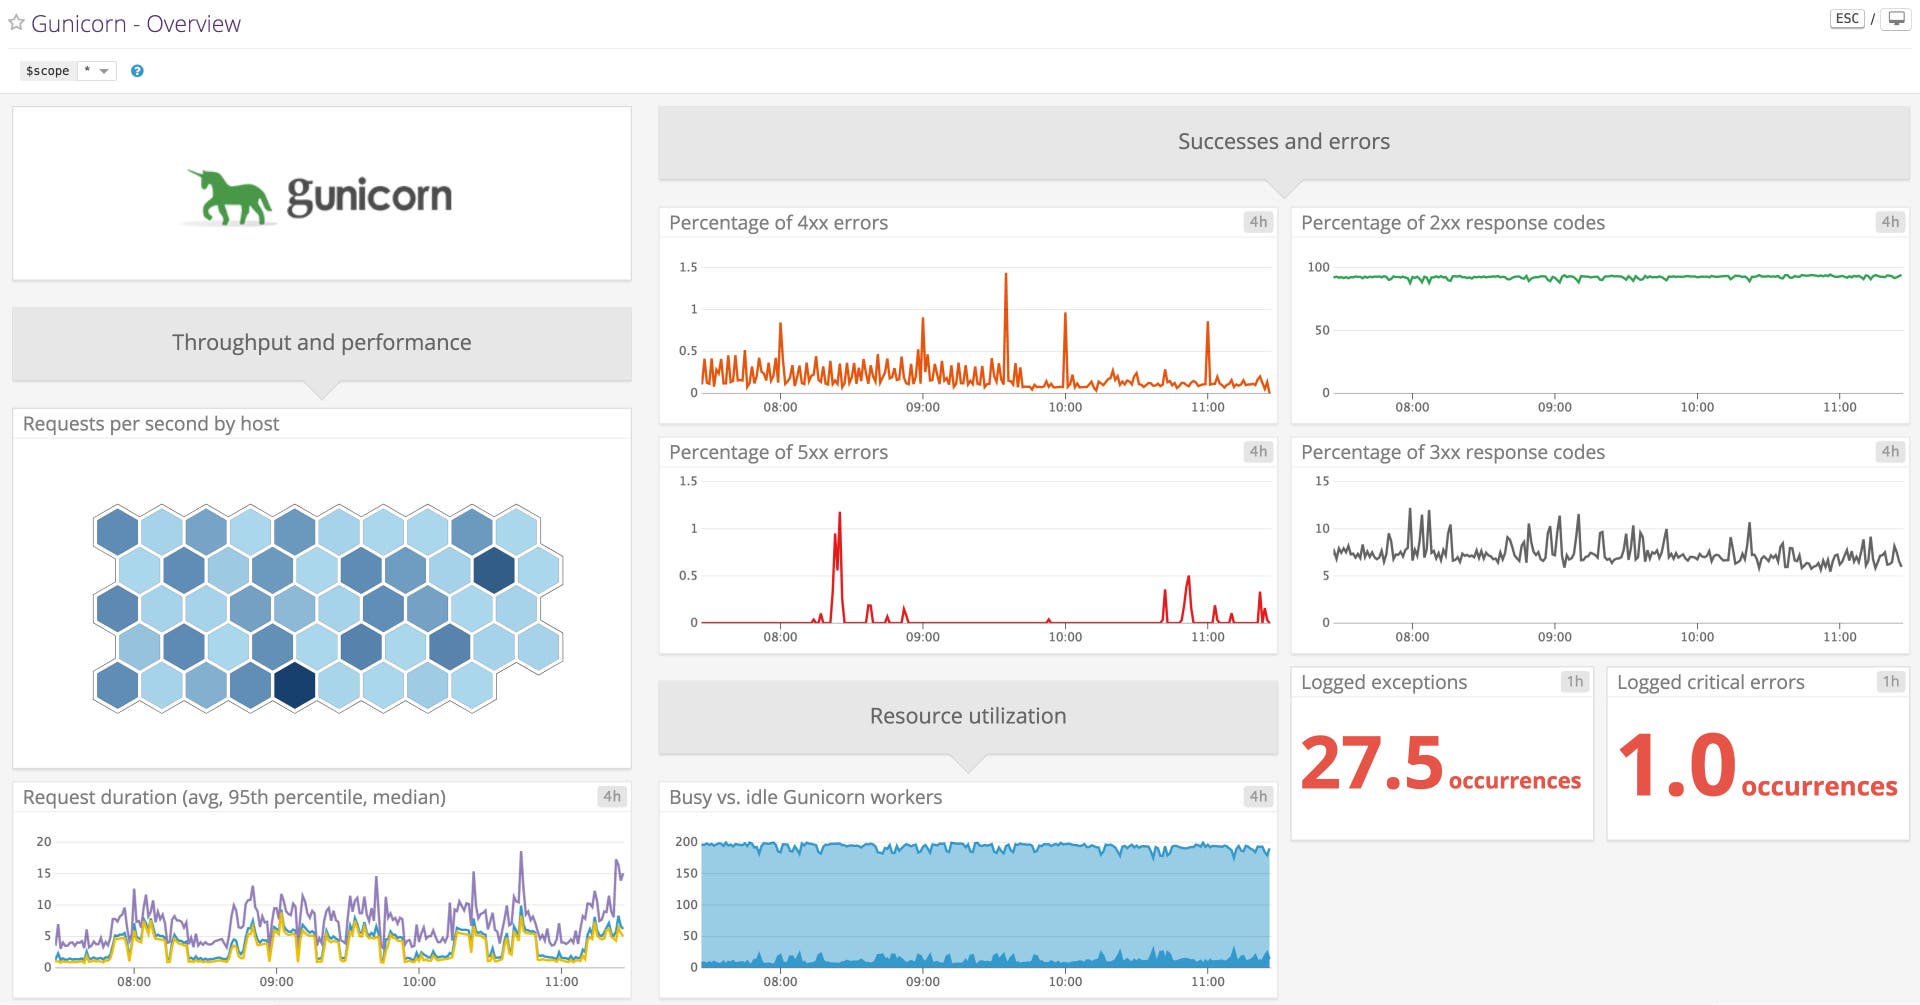
Checks Metric Sample: 882Event: 1Events Flushed: 1Number Of Flushes: 4Series Flushed: 403Service Check: 64Service Checks Flushed: 52You should also see metrics start to show up on Datadog’s out-of-the-box Gunicorn dashboard.

Custom Python metrics and events
If you’d like to collect your own custom metrics and events, install Datadog’s Python library in your application’s environment:
pip install datadogOnce you’ve installed the library, you gain access to the Datadog HTTP API, DogStatsD, and ThreadStats Python modules. With these tools, you can instrument your code to send custom metrics and events to the Datadog Agent.
Django-specific dashboards
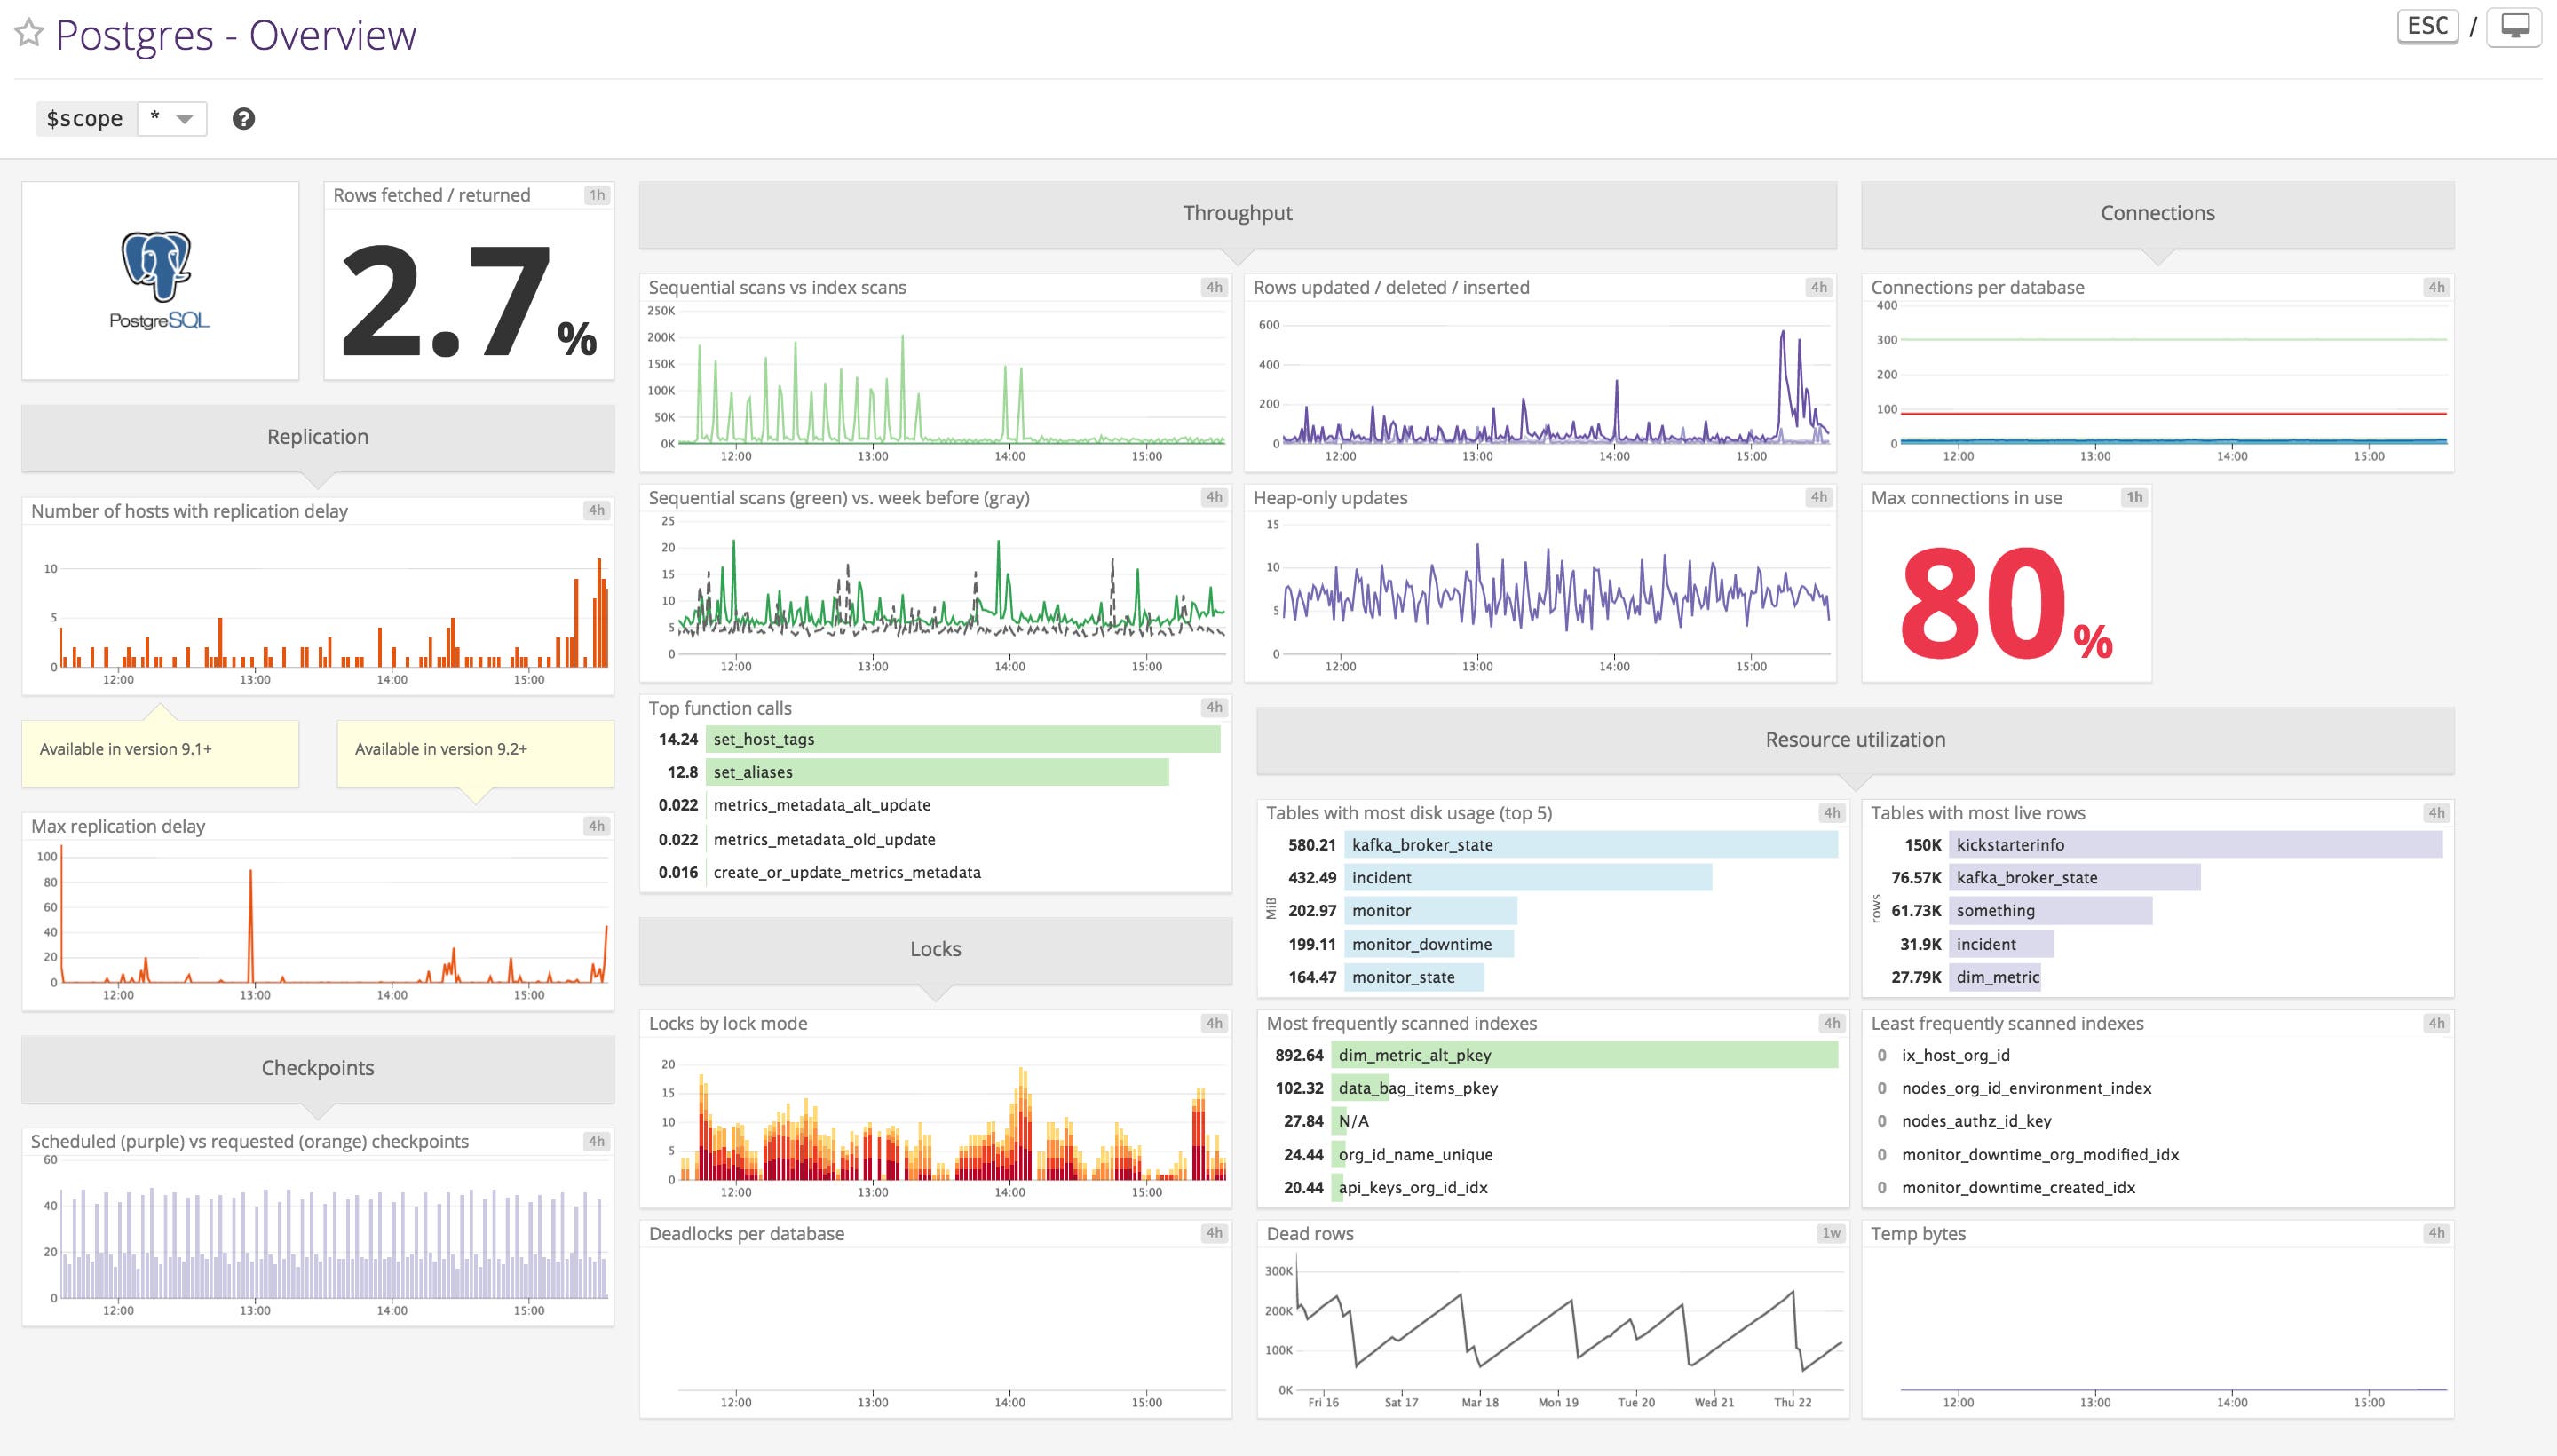
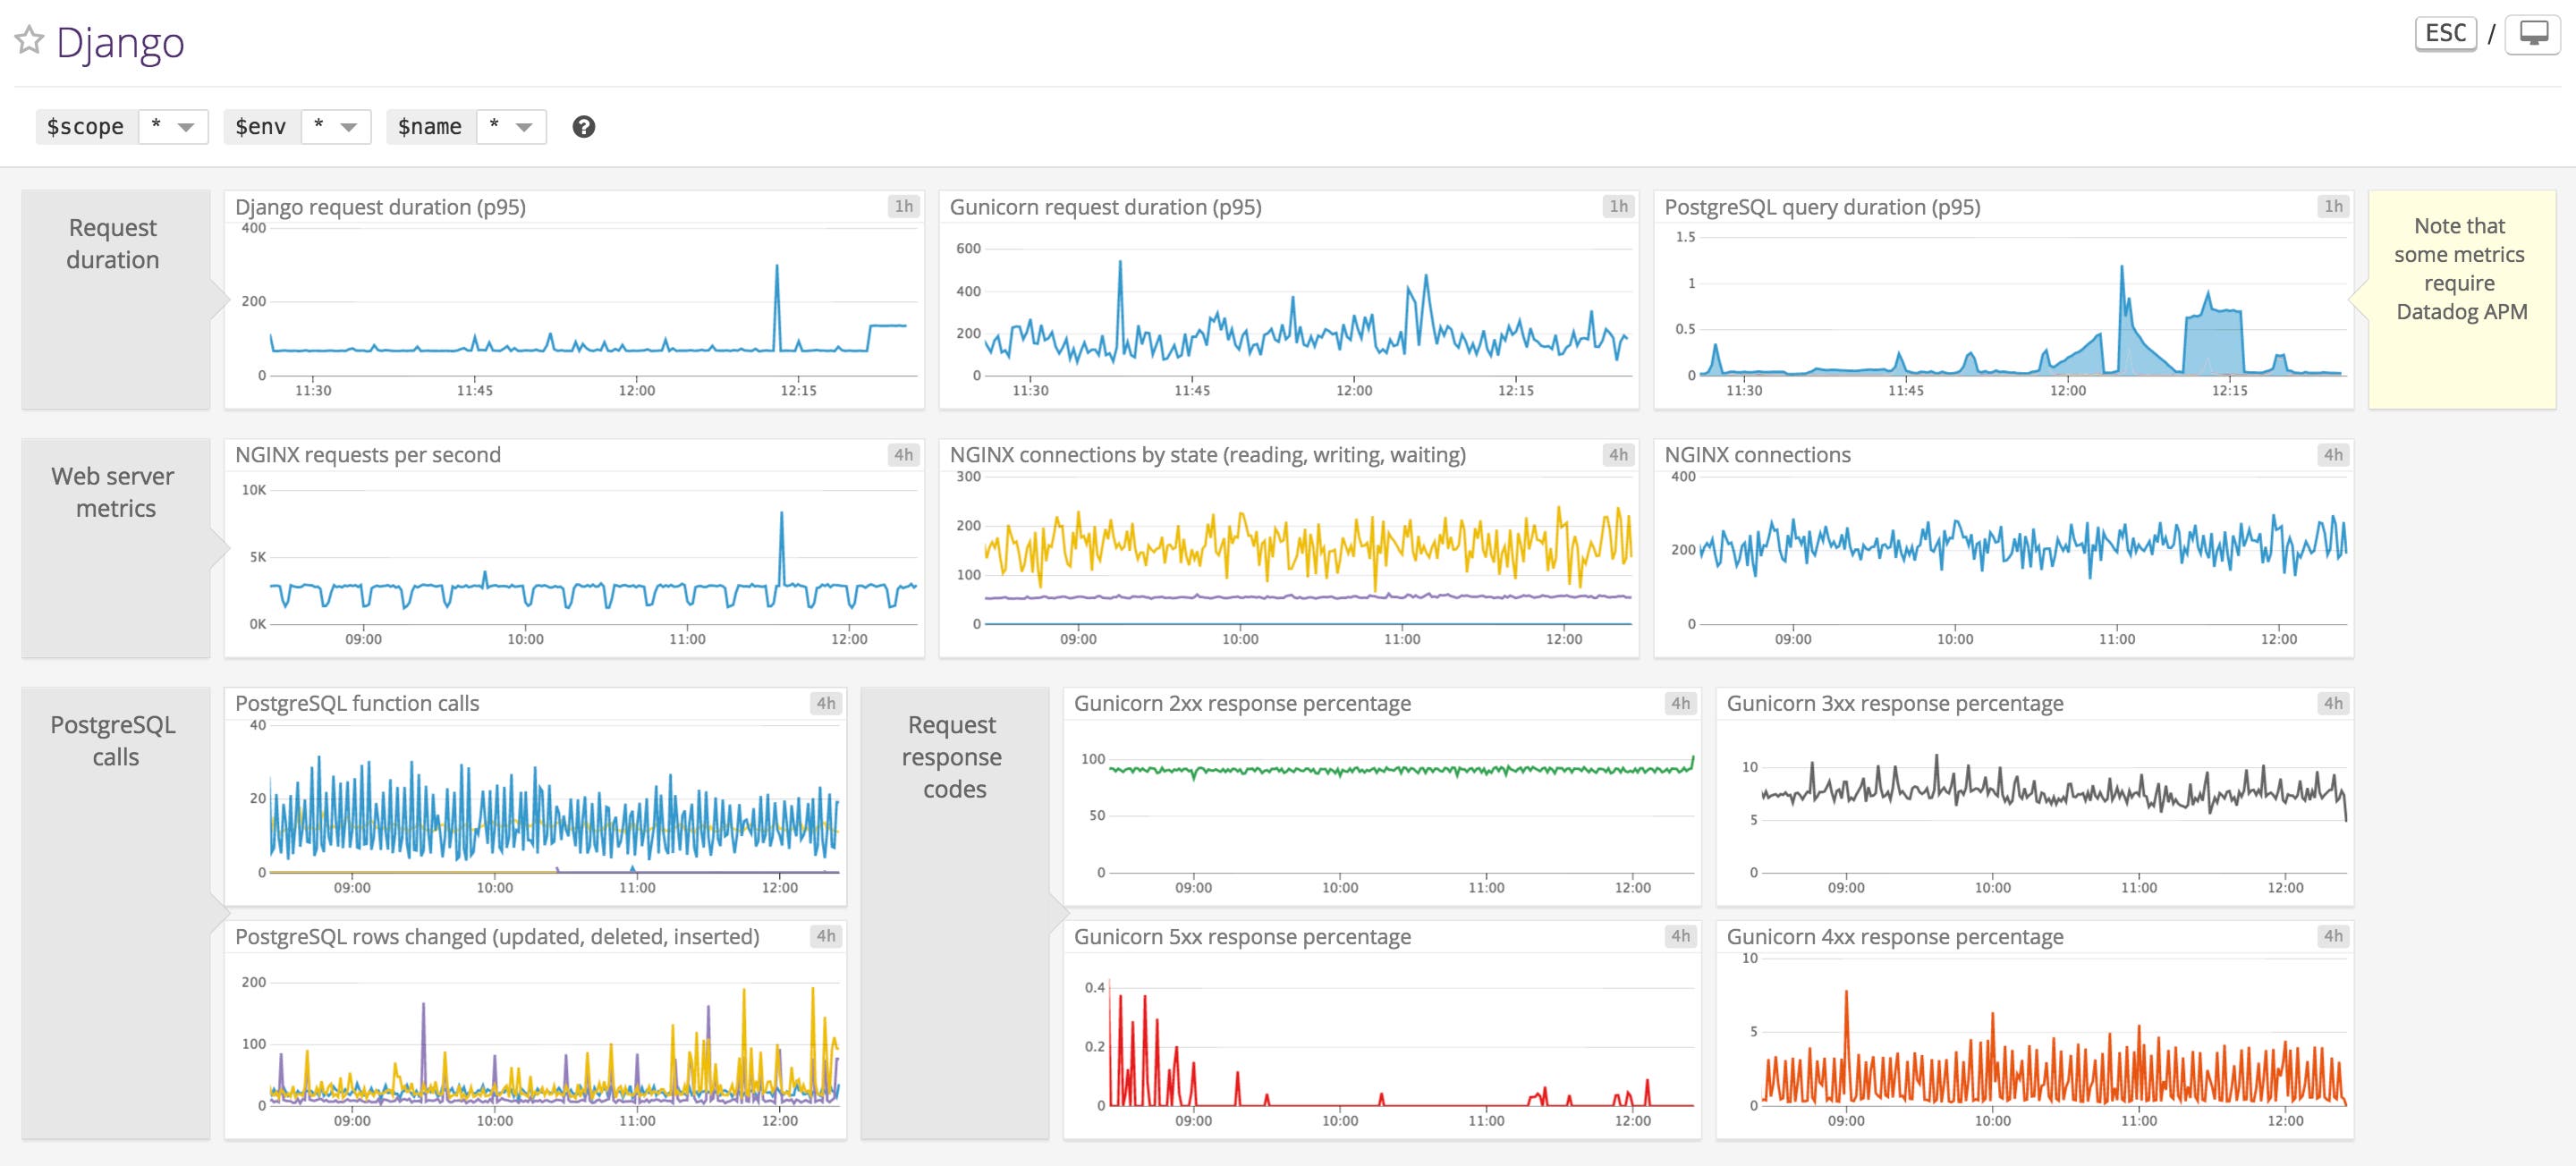
Creating a custom dashboard allows you to monitor your Django application at a glance. If you aren’t sure what to put on your dashboard, see the out-of-the-box dashboards for Gunicorn, NGINX, or Postgres.
Track Django applications and their associated technologies with Datadog.
To import the example dashboard into your Datadog app, run the following curl command:
curl -X POST -H "Content-type: application/json" \-d '<CONTENTS_OF_EXAMPLE_JSON_GIST>' \"https://app.datadoghq.com/api/v1/screen?api_key=${<YOUR_DATADOG_API_KEY>}&application_key=${<YOUR_DATADOG_APP_KEY>}"
Diving into Django application performance
After configuring Datadog to monitor your Django application, you’ll have access to data from across your stack for performance monitoring and rapid troubleshooting. Let’s look at an example scenario: you’ve just received a Datadog alert notifying you that Gunicorn is reporting a large number of 5xx responses.

You can dive right into a dashboard graph for some further context. It’s clear that some event—in this case, a code change, which is overlaid on the graph as a pink bar—has caused the number of 5xx responses to spike.

To gather more information on the nature of the errors, you can pivot to Datadog APM, drilling down to all the traces returning 5xx codes in the relevant timeframe. It seems that the request error is the result of a faulty PostgreSQL query. Also note that the error is being caused by a POST request to the /create/ URL path.

To find the issue with the PostgreSQL query, you can pull up the error logs for the query. The logs reveal the source of the problem: our application is attempting to insert a long string—longer than the limit of 3,000 characters.

Thanks to our comprehensive monitoring coverage, we can smoothly pivot between data from logs, metrics, and request traces to determine that the most recent code change is causing some POST requests to the /create/ URL path to attempt PostgreSQL string inserts that exceed the character limit.
Get started today
If you’re already using Datadog, check out our documentation for further information on how to monitor Django performance for your applications and their accompanying technologies. And if you don’t yet have a Datadog account, here’s a free trial to get you started.


