
David Lentz
In Part 1 of this series, we introduced you to the key metrics you should be monitoring to ensure that you get optimal performance from CoreDNS running in your Kubernetes clusters. In Part 2, we showed you some tools you can use to monitor CoreDNS. In this post, we'll show you how you can use Datadog to monitor metrics, logs, and traces from CoreDNS alongside telemetry from the rest of your cluster, including the infrastructure it runs on.
We'll show you how to:
- Integrate CoreDNS with Datadog
- Visualize your CoreDNS metrics
- Track CoreDNS performance with Network Performance Monitoring
- Collect and explore CoreDNS logs
Integrate CoreDNS with Datadog
In this section, we'll describe how to install and configure the Datadog Agent, the open source software that collects metrics, traces, and logs from your infrastructure and applications. We'll also walk through installing the Cluster Agent, which allows you to monitor your Kubernetes cluster. Then we'll walk through how to set up the CoreDNS integration. Together, these components allow you to track the performance of your CoreDNS Deployments to ensure that your Kubernetes applications can communicate efficiently with services in the cluster and resources on the internet.
Install the Datadog Agent and Cluster Agent
In this section, we'll show you how to use Helm to install the Datadog Agent with a single command. Helm is a package manager that combines Kubernetes manifests into charts to make it easy to install, configure, and update applications in your cluster. When you deploy the Datadog Helm chart, it will also install the Cluster Agent, which efficiently collects cluster-level data and allows you to use custom metrics to autoscale your Kubernetes applications.
If you're not already using Helm, you can install it from source code or use a script or package manager as described in the documentation. Once you've installed Helm, update it to add the Datadog chart repository using these commands:
helm repo add datadog https://helm.datadoghq.comhelm repo updateThen deploy the Helm chart using the command below. This creates a Helm release named datadog-agent and installs the Agent and Cluster Agent. Helm will automatically configure the installation to use the Datadog API key specified in the command.
helm install datadog-agent --set datadog.apiKey=<DATADOG_API_KEY> datadog/datadogThe Helm chart automatically applies the RBAC permissions necessary for the Agent to talk to the kubelet, and for the Cluster Agent to communicate with the Kubernetes API server. It also creates a secret token that is used to secure communication between the Agent and Cluster Agent.
When the chart is fully deployed, you can use kubectl to confirm that the Agent and Cluster Agent are running. The output of this command should list one replica of the Agent pod for each worker node in your cluster and one Cluster Agent replica, as shown below.
kubectl get pods | grep agent
NAME READY STATUS RESTARTS AGEdatadog-agent-blqhh 3/3 Running 0 95sdatadog-agent-cluster-agent-755ccb66d9-bnhlb 1/1 Running 0 95sdatadog-agent-q6w9d 3/3 Running 0 95sConfigure the Agent and Cluster Agent
Now that you've deployed the Datadog Helm chart, the Agent is ready to send metrics from your CoreDNS Deployment to your Datadog account. You can configure the Agent to apply custom tags to all of your metrics, as well as the traces and logs we'll show you how to collect later in this post. Also later on, we'll look at how you can leverage tags in Datadog to analyze the health and performance of your CoreDNS Deployments.
When you deploy a chart, Helm automatically applies configuration values that are specified in the chart's values file. For example, the Datadog chart's values file enables the Cluster Agent by default.
To update the Agent's configuration, you can define new settings in your values file—for example, to add tags to your metrics—and then use helm upgrade to apply the changes. You can also create your own YAML file to override the settings defined in the chart's values file. This is the approach we'll take throughout this post. In this section, you'll create a file named datadog-values.yaml and use it to apply a custom Agent configuration. In later sections, we'll show you how to revise the configuration by updating and reapplying your custom configuration file.
In the example below, the datadog-values.yaml file configures the Agent to add custom tags to all of the metrics, traces, and logs it collects. It applies the env and version tags, which enables you to leverage unified service tagging to tie together the telemetry data you collect from across your environment. The third unified service tag, service, will be applied automatically by the Agent based on the image name of the CoreDNS container (coredns).
This revised configuration also adds a custom tag to identify the team that owns the cluster—wre2—and sets the tlsVerify and useHostNetwork values to allow the Agent to monitor each worker node's kubelet and metadata. And it enables kube-state-metrics, which collects additional metrics and events to help you monitor the state of the objects in your cluster. (For information about how Datadog monitors kube-state-metrics, see this blog post.)
datadog: tags: - env: production version: 1.6 team: wre2 kubelet: tlsVerify: false # Setting this to false lets the Agent discover # the kubelet URL. kubeStateMetricsEnabled: true
agents: useHostNetwork: true # If your cluster is hosted on a cloud # provider, this is required for the Agent # to collect host-level metadata.To apply these changes, use the helm upgrade command and pass the names of your Helm release, your custom YAML file, and the chart's repository. You'll also need to include your Datadog API key, as shown here:
helm upgrade datadog-agent -f datadog-values.yaml --set datadog.apiKey=<DATADOG_API_KEY> datadog/datadogSee the Datadog Helm chart documentation for a complete list of Agent configuration options you can set using the helm upgrade command.
Set up the CoreDNS integration
The CoreDNS integration is enabled by default, and it uses an auto-configuration file named auto_conf.yaml to configure the Agent to discover the CoreDNS container running on the worker node where it's installed. The default configuration also defines a metrics endpoint named prometheus_url, from which the Agent scrapes Prometheus metrics. However, the current version of the CoreDNS integration supports OpenMetrics, which provides a more efficient way of collecting Prometheus metrics from the endpoint. You should revise your configuration to use OpenMetrics if possible, i.e., if the host where the Agent is running supports Python 3.
To configure your CoreDNS integration to use the OpenMetrics endpoint, you can update the Helm chart again. The code sample below shows an updated version of the datadog-values.yaml file we created in the previous section. This version first instructs the Agent to ignore the auto-configuration file. It then creates a coredns.yaml object that holds the revised configuration, which uses an Autodiscovery template variable to dynamically configure the URL of the OpenMetrics endpoint.
datadog:[...] ignoreAutoConfig: - coredns confd: coredns.yaml: |- ad_identifiers: - coredns init_config: instances: - openmetrics_endpoint: http://%%host%%:9153/metrics tags: - dns-pod:%%host%%[...]You can apply these changes using the same helm upgrade command shown in the previous section. Once you've deployed the revised Helm chart, you'll be able to see CoreDNS metrics in Datadog within minutes. In the next section, we'll walk through how to use dashboards, tags, and alerts to gain deep visibility into the performance of your CoreDNS Deployments.
Visualize your CoreDNS metrics
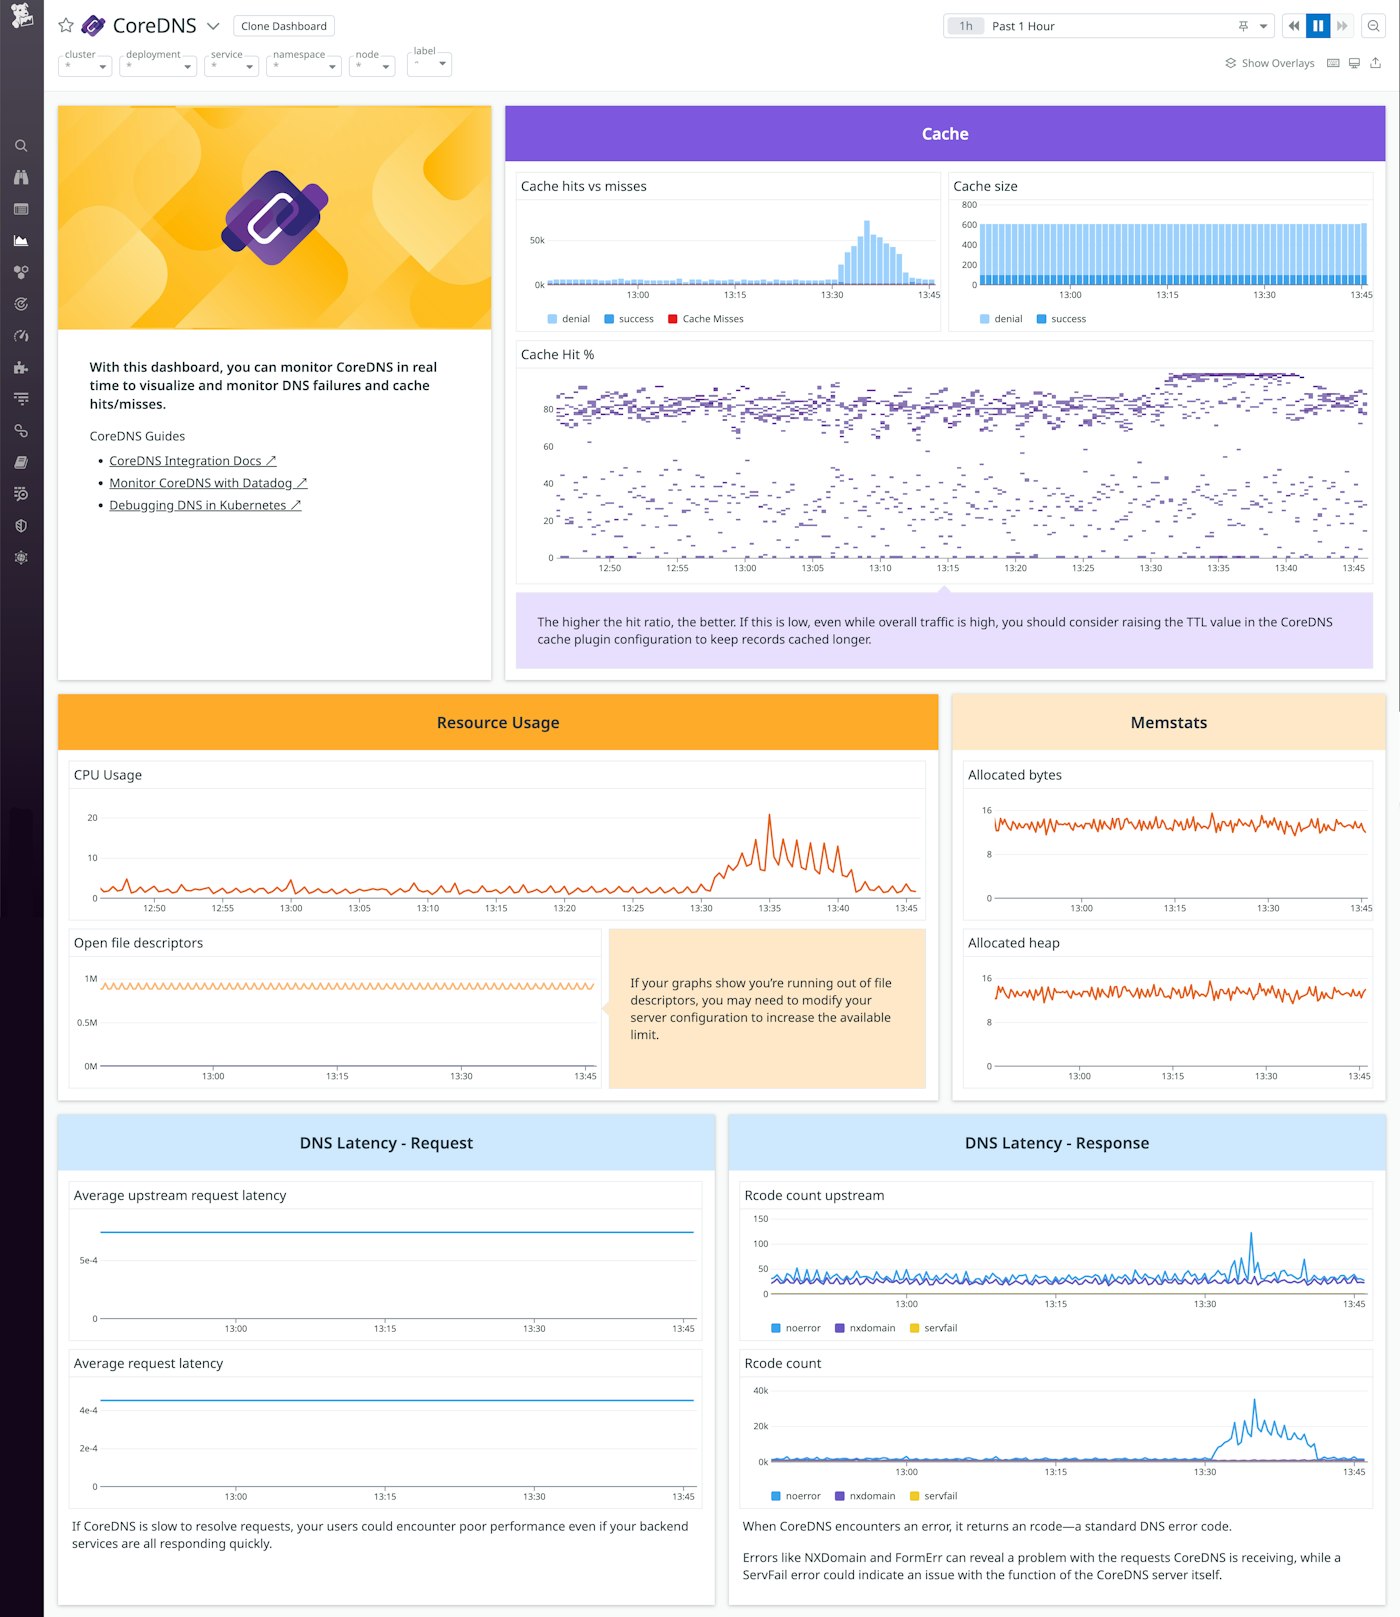
Datadog's out-of-the-box CoreDNS dashboard lets you visualize CoreDNS activity and performance. This dashboard graphs key metrics that illustrate the resource usage of your CoreDNS servers, the effectiveness of your cache, the latency per RCODE and per upstream server, and more.
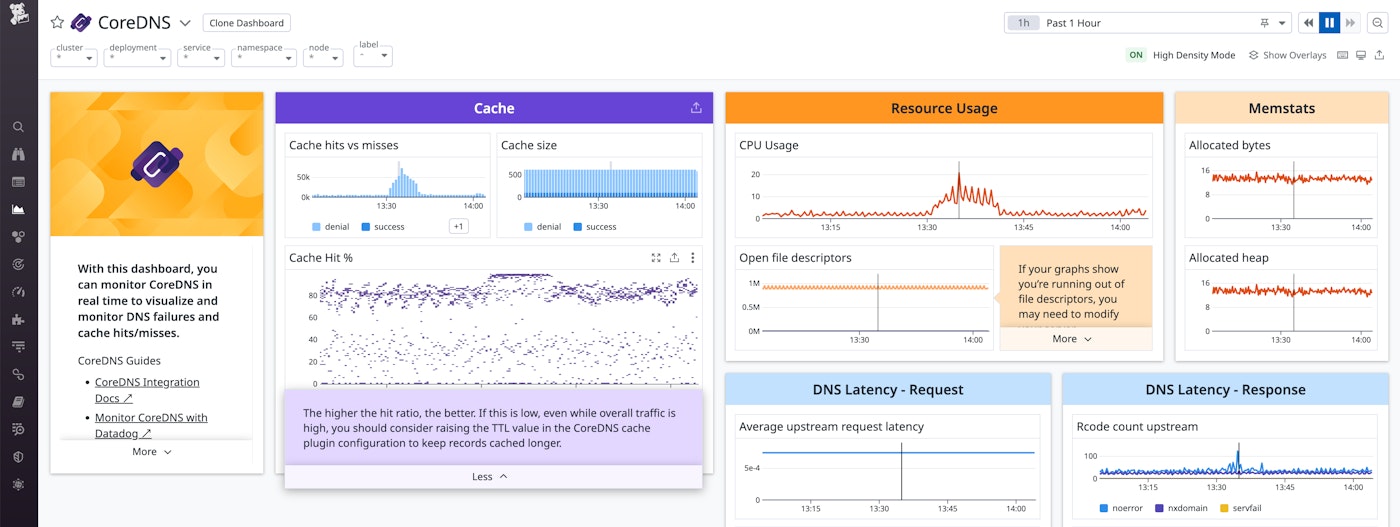
You can customize this dashboard to include other important data from your CoreDNS Deployment as well as your Kubernetes workloads, infrastructure, and cloud services. To create your own copy of the dashboard and make changes, first click the icon in the top-right corner, then, select Clone dashboard. Next, click Edit widgets to add new widgets so you can visualize data from CoreDNS and related technologies all in one place. You can also add Powerpacks, which are collections of widgets your organization can efficiently deploy across multiple dashboards to create standardized visualizations.
Use tags to analyze your CoreDNS data
Datadog lets you leverage tags as you explore data from your CoreDNS Deployments and other services running in your environment. Tags allow you to filter and aggregate metrics; correlate metrics, logs, and traces; and tie CoreDNS telemetry to the rest of your stack through unified service tagging.
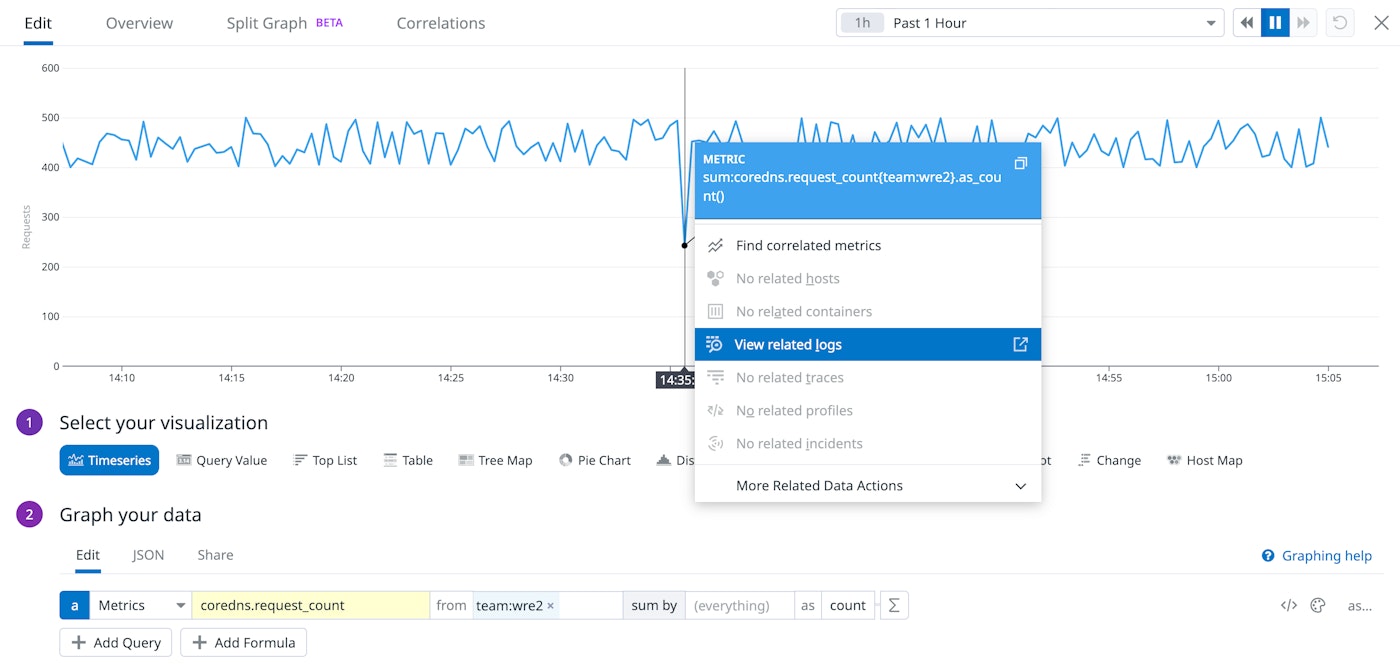
In the screenshot below, we've created a graph to show the coredns.request_count metric. The query uses a tag to filter for metrics from CoreDNS Deployments that belong to the wre2 team. If the graph shows changes that might indicate an issue with your CoreDNS performance—for example, a sudden dip in the rate of requests—you can click that point on the graph to quickly pivot to view logs that are also tagged team:wre2.
Monitor CoreDNS container resource usage in real time
Datadog gives you visibility into the resource usage of each container in your cluster, so you can track CPU, memory, network, and disk I/O metrics from your CoreDNS containers. The Live Container view—shown in the screenshot below—lets you group metrics from all of the containers in your CoreDNS service. Note that the service uses the legacy name kube-dns to provide backwards compatibility with clusters running older versions of Kubernetes (<v1.13), prior to the time when CoreDNS became the default cluster DNS provider.
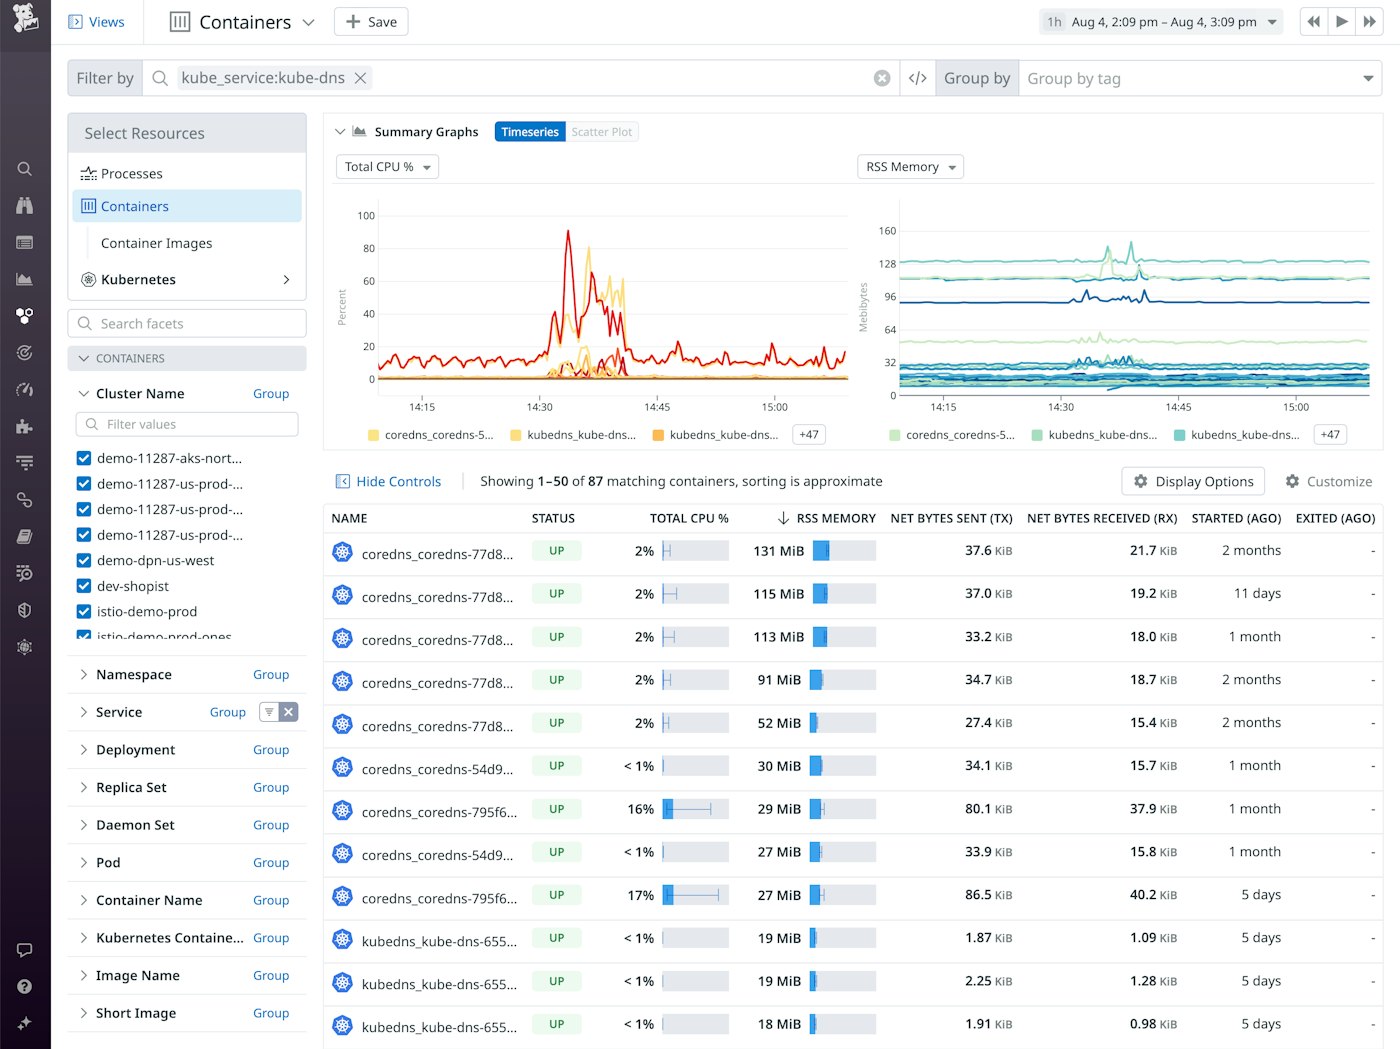
You can sort the Live Container view to highlight CoreDNS containers that are using the most resources and filter the view to examine the current performance and historical resource usage of any individual container.
Automatically get alerted to CoreDNS issues
Monitors can help alert you to CoreDNS performance issues even when your team isn't actively watching your dashboards. You can rely on monitors to notify you when important metrics indicate a possible issue with your CoreDNS servers, for example when they cross thresholds you define or stray from their normal range of values.
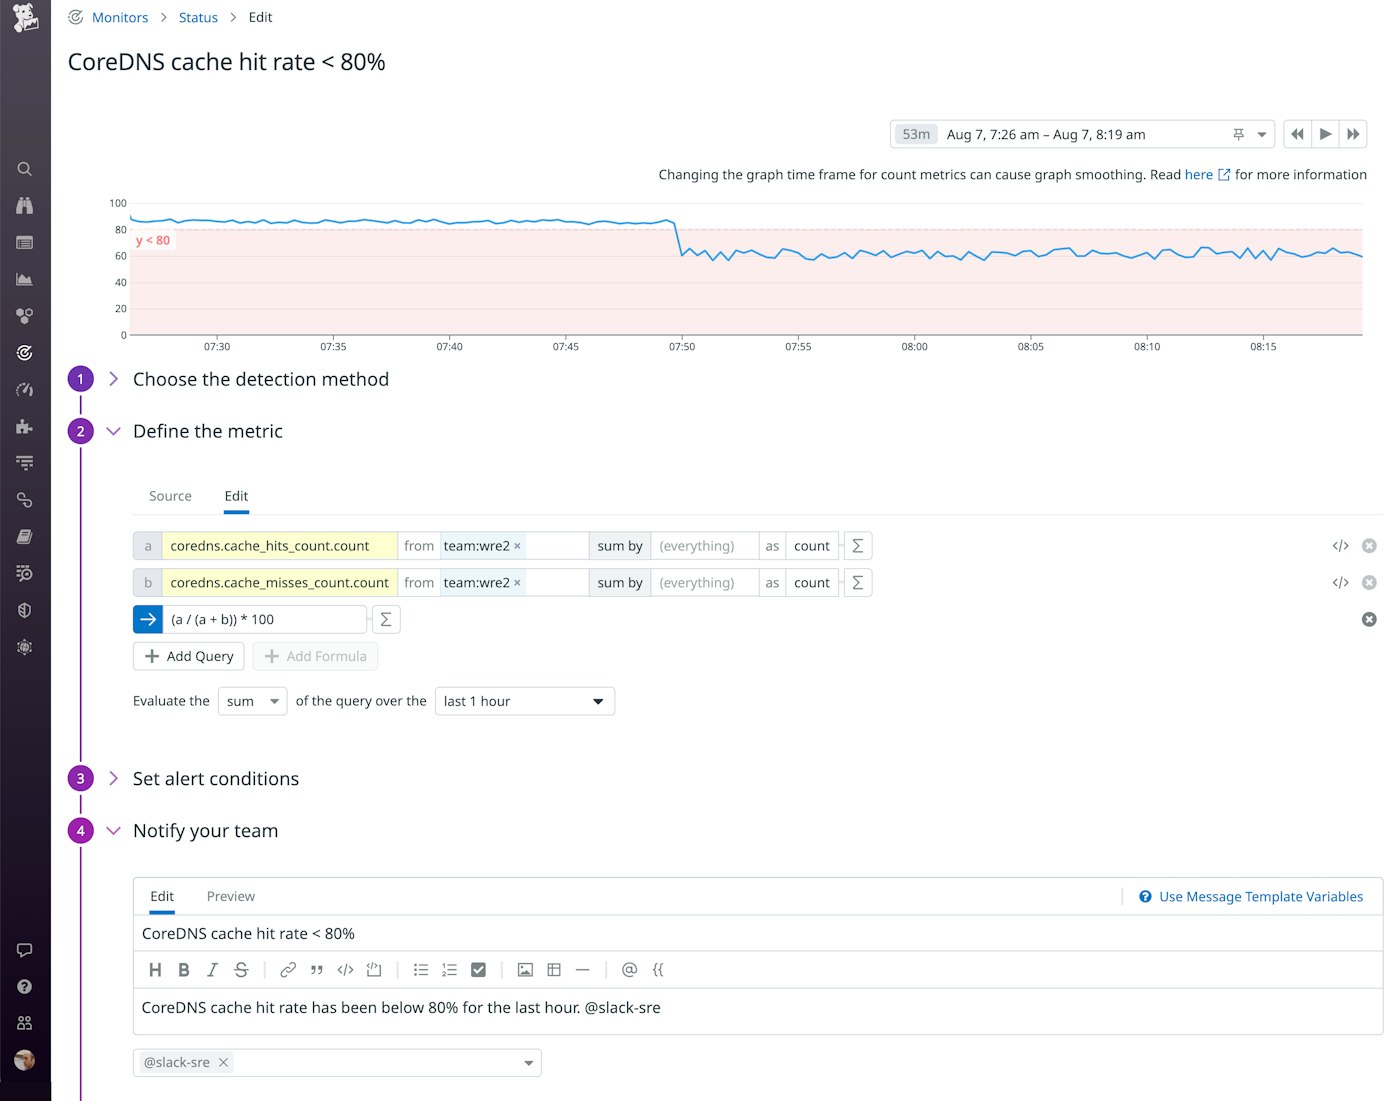
The screenshot below shows a monitor that tracks the effectiveness of the CoreDNS cache. This monitor will notify the SRE team's Slack channel if the cache hit rate (calculated from the coredns.cache_hits_count and coredns.cache_misses_count metrics) has fallen below 80 percent over the past hour. This could indicate a changing pattern of requests from application pods, and Deployment Tracking can help you see whether the falling hit rate correlates with errors introduced in a new version of the application.
Monitor CoreDNS performance and activity with NPM and distributed tracing
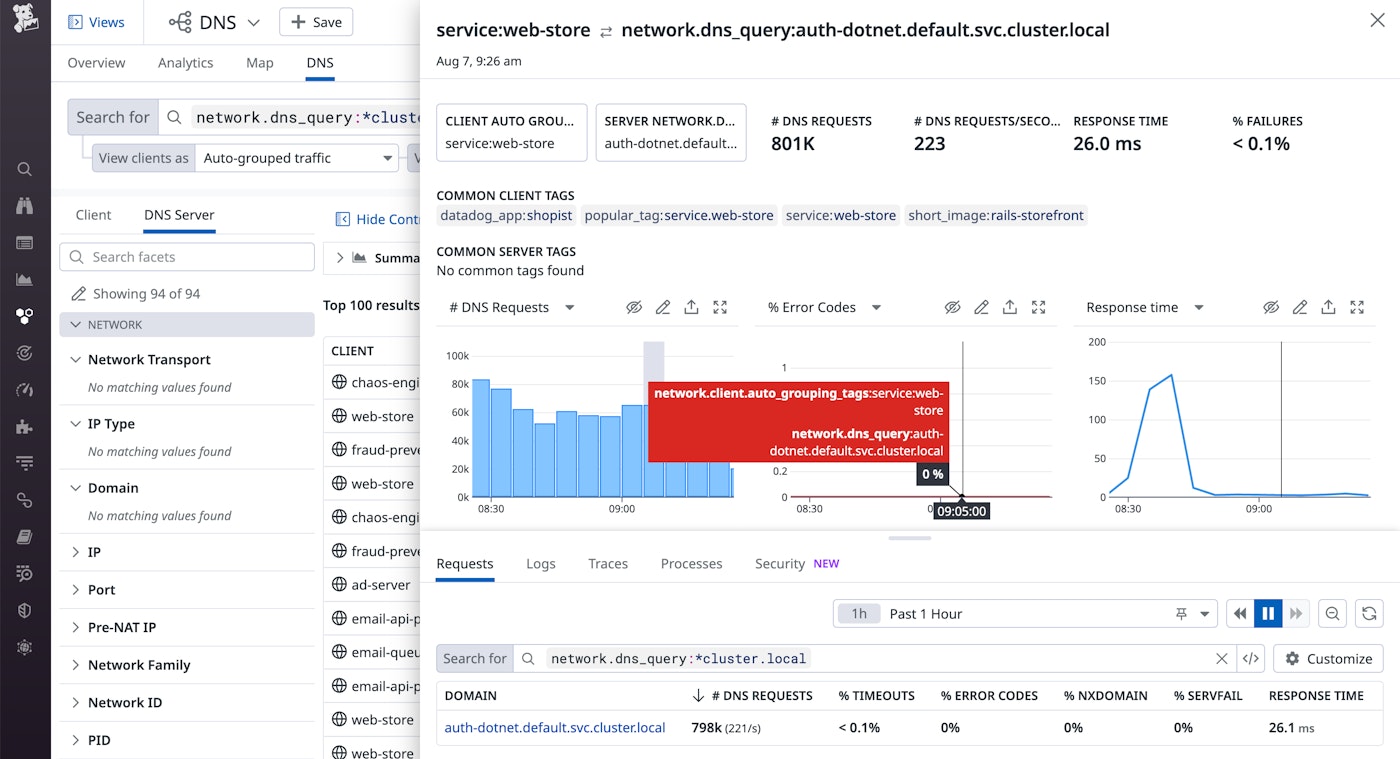
Datadog Network Performance Monitoring (NPM) allows you to get deep visibility into your network, including your CoreDNS service. You can visualize your network's DNS request volume, error rates, and latency to troubleshoot DNS issues that can cause degraded performance inside your cluster. And Synthetic DNS testing allows you to proactively detect increased latency and error rates, so you can prevent DNS performance issues from impacting your applications.
In the screenshot below, NPM's DNS view lists all queries to endpoints inside the cluster. The detail panel graphs metrics that illustrate how CoreDNS performed as it resolved requests for the auth-dotnet.default.svc.cluster.local endpoint.
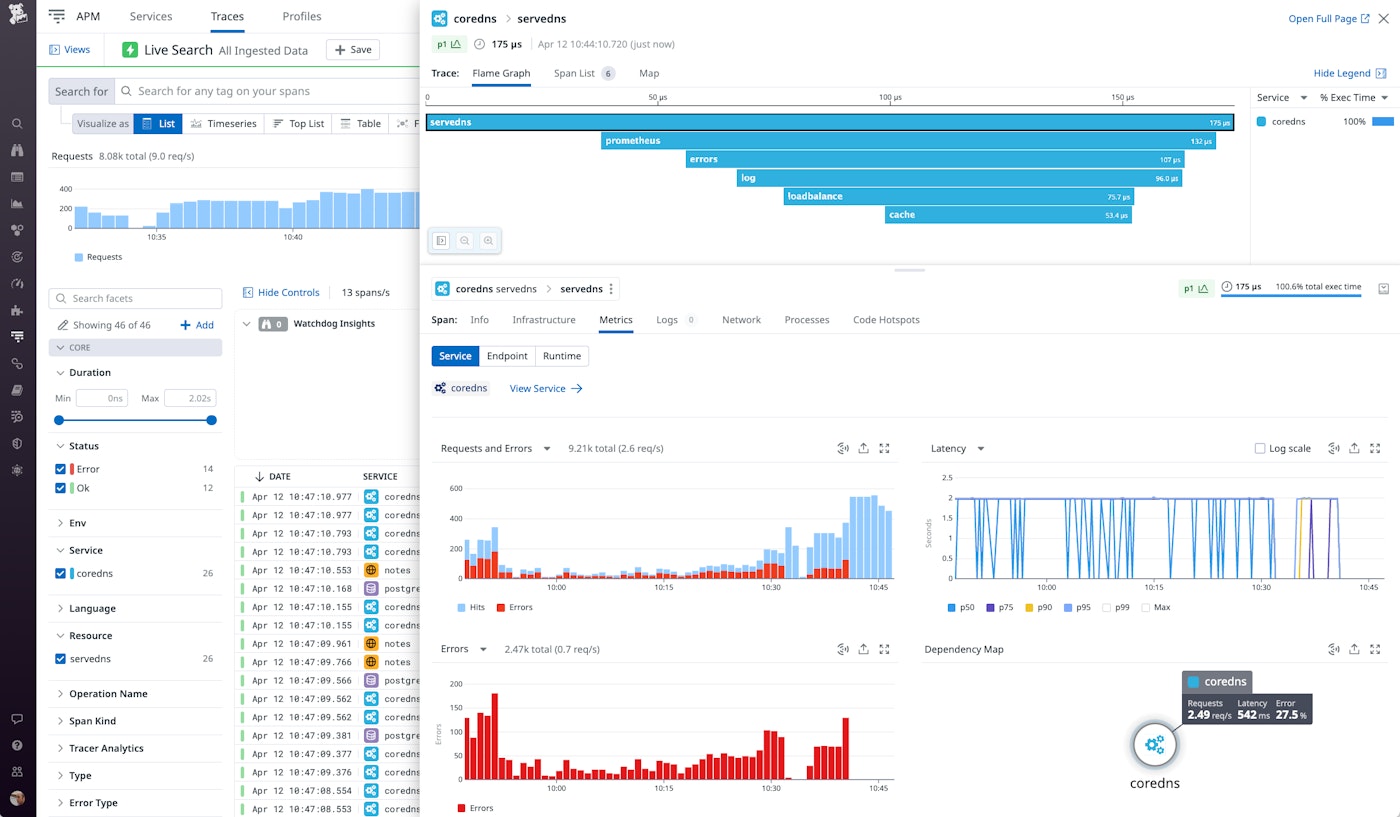
You can use the CoreDNS trace plugin—which allows you to trace requests through the CoreDNS plugin chain—to gain even deeper visibility into the performance of your CoreDNS service. Once you've installed the Agent, it will begin to collect trace data which you can visualize to see which plugins were involved in fulfilling a DNS request and how long each plugin took to do its work.
In the screenshot below, a flame graph visualizes the performance of a CoreDNS server as it processes a single request. The graph includes a span for each plugin that was involved in processing the request, allowing you to see whether a particular plugin in your chain is causing a bottleneck in CoreDNS performance. In this example, CoreDNS took 175 microseconds to process the request, and the cache plugin accounts for 53.4 microseconds.
To enable the trace plugin, you need to update your Corefile. In Kubernetes, the Corefile takes the form of a ConfigMap, and you can edit it using this command:
kubectl edit configmap coredns -n kube-systemAdd a stanza to enable the trace plugin, and specify the datadog endpoint type and the endpoint URL. The Agent listens for trace data on port 8126, so you need to specify that port on your endpoint. The sample code below shows a partial CoreDNS ConfigMap that defines a single server with the trace plugin enabled.
[...]Data====Corefile:----. { trace datadog localhost:8126 }You'll also need to configure the containers in your CoreDNS Deployment to use Datadog APM. You can find information about collecting traces from CoreDNS and other Kubernetes-based Go applications in the in-app documentation.
Collect and explore CoreDNS logs
In Part 2 of this series, we looked at the CoreDNS log plugin, which logs INFO-level messages describing DNS queries. We also covered the errors plugin, which logs ERROR messages from CoreDNS and other plugins. Both of these plugins write to standard output, so you can see these messages via the kubectl logs command.
Datadog Log Management allows you to collect and view the messages that the log and errors plugins write to standard output. You can explore your logs to find patterns and investigate performance issues, and correlate your CoreDNS logs with metrics, traces, and logs from other technologies in your stack. In this section, we'll show you how to send CoreDNS logs to Datadog and how to explore and analyze them alongside logs from other applications in your cluster.
Enable log collection
First, you'll need to enable log collection on the Agent. The Helm chart disables log collection by default, so you'll need to update the Agent's configuration by revising your datadog-values.yaml file. The code snippet below adds the necessary configuration to enable the Agent to collect logs from all containers in your Kubernetes cluster.
datadog:[...] logs: enabled: true containerCollectAll: true #Enable this to allow log collection for all containers.Apply these changes using helm upgrade:
helm upgrade -f datadog-values.yaml datadog-agent datadog/datadogSee the documentation for more information about configuring the Agent to collect logs.
Explore your CoreDNS logs
Once the Agent is collecting your CoreDNS logs and sending them to your Datadog account, you can use the Log Explorer to view, search, and analyze them. The Agent will automatically apply two additional tags—service, which ties these logs to CoreDNS metrics and traces, and source, which automatically applies the appropriate log processing pipeline to parse the logs. The Agent sets the value of these tags as coredns, based on the image name it detects on the CoreDNS container.
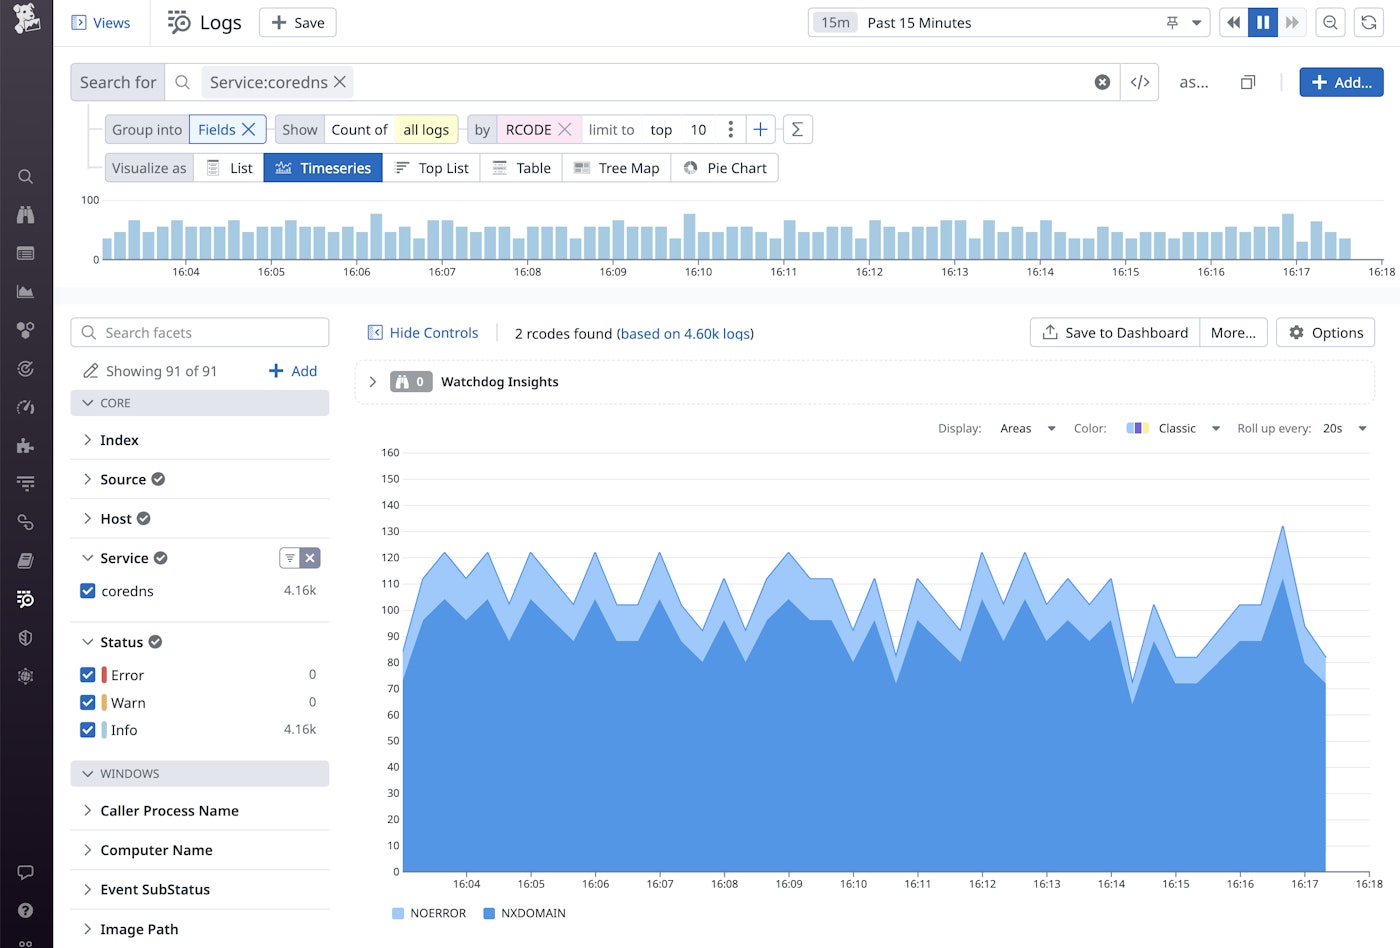
The Agent parses the logs using rules defined in the pipeline, allowing you to easily filter and aggregate your data based on the content of the logs. For example, the screenshot below shows the number of logs that contain different RCODE values—NOERROR and NXDOMAIN.
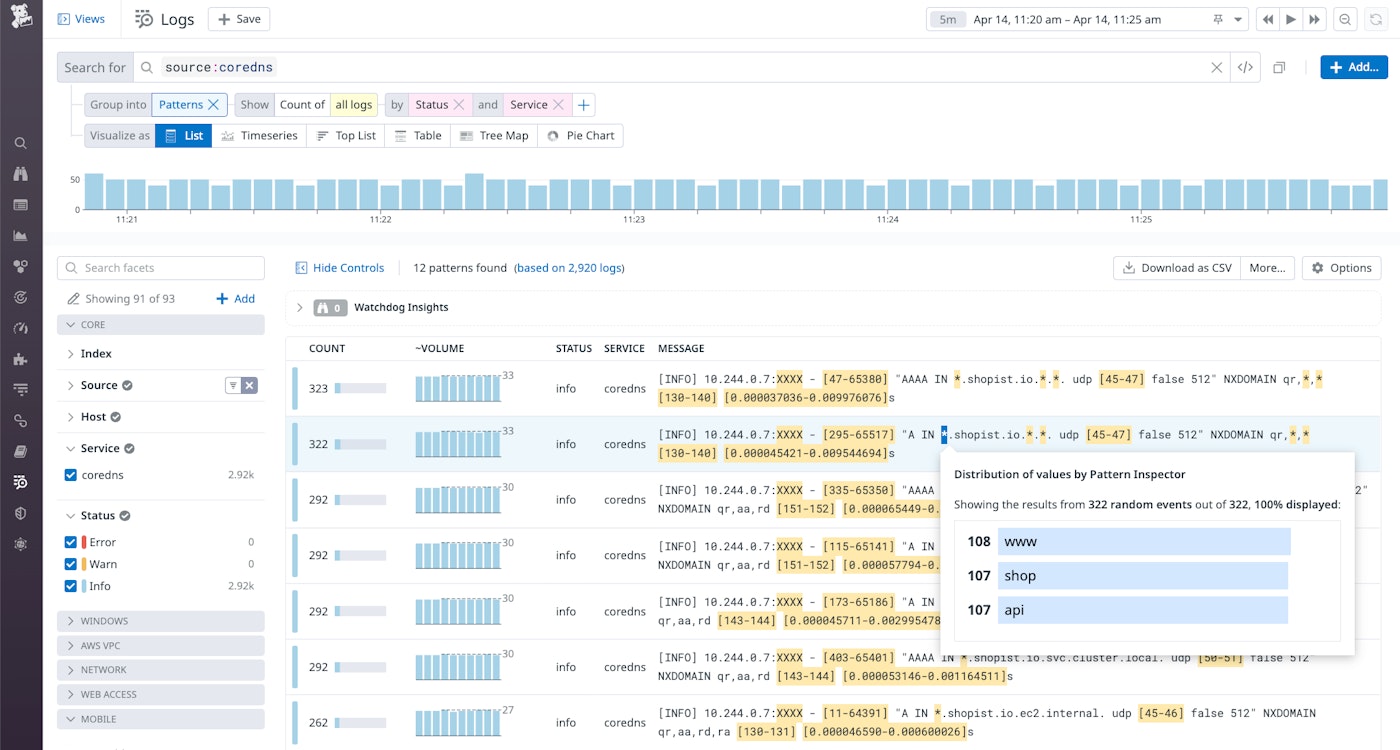
You can also filter logs based on any of the custom tags you've applied to your CoreDNS Deployment. For example, you can use the version tag to determine whether a particular error is present in multiple versions of your CoreDNS configuration. And you can use Log Patterns to highlight meaningful differences across similar logs. In the screenshot below, the Pattern Inspector shows the distribution of CoreDNS requests to different shopist.io subdomains over the last 15 minutes.
Extend your Kubernetes visibility with CoreDNS monitoring
A healthy CoreDNS service is critical to the performance of your Kubernetes applications. Datadog provides a single platform for monitoring CoreDNS alongside the rest of your stack, including the cloud services and infrastructure that powers it all. See our CoreDNS documentation for more information, and if you're not already using Datadog, get started with a free 14-day trial.


