As you operate and scale ActiveMQ, comprehensive monitoring will enable you to rapidly identify any bottlenecks and maintain the flow of data through your applications. Earlier in this series, we introduced some key metrics to watch and looked at some tools you can use to monitor your ActiveMQ Classic and ActiveMQ Artemis deployments. Comprehensive ActiveMQ monitoring requires visibility into your brokers, destinations, and addresses alongside the client applications that send and receive messages, and the infrastructure that runs it all. In this post, we’ll show you how you can monitor ActiveMQ and the related technologies throughout your stack using Datadog.
This post will show you how to:
- Configure ActiveMQ to send metrics to Datadog
- View ActiveMQ metrics in a customizable dashboard
- Collect and analyze ActiveMQ logs in Datadog
- Use tags to analyze your ActiveMQ metrics
- Create alerts in Datadog to keep you informed
First we’ll walk through how to connect your ActiveMQ infrastructure to your Datadog account. If you’re new to Datadog and you’d like to follow along, here’s a free trial.
Connecting ActiveMQ with Datadog
This section will describe how to configure ActiveMQ Classic and Artemis to send metrics to Datadog. To do this, you’ll need to enable JMX remote monitoring, install and configure the Datadog Agent, and enable the integration.
Monitoring JMX remotely
ActiveMQ exposes metrics via JMX. To make those metrics available to the Datadog Agent, you need to configure your ActiveMQ host to allow secure remote access to its MBean server, as shown in this document from Oracle. Next, you’re ready to install the Agent and integrate ActiveMQ with your Datadog account.
Installing the Agent
The Datadog Agent is open source software that runs on your hosts and sends metrics, traces, and logs to your Datadog account. You can often install the Agent with just a single command—see the installation instructions for your host’s OS for more information.
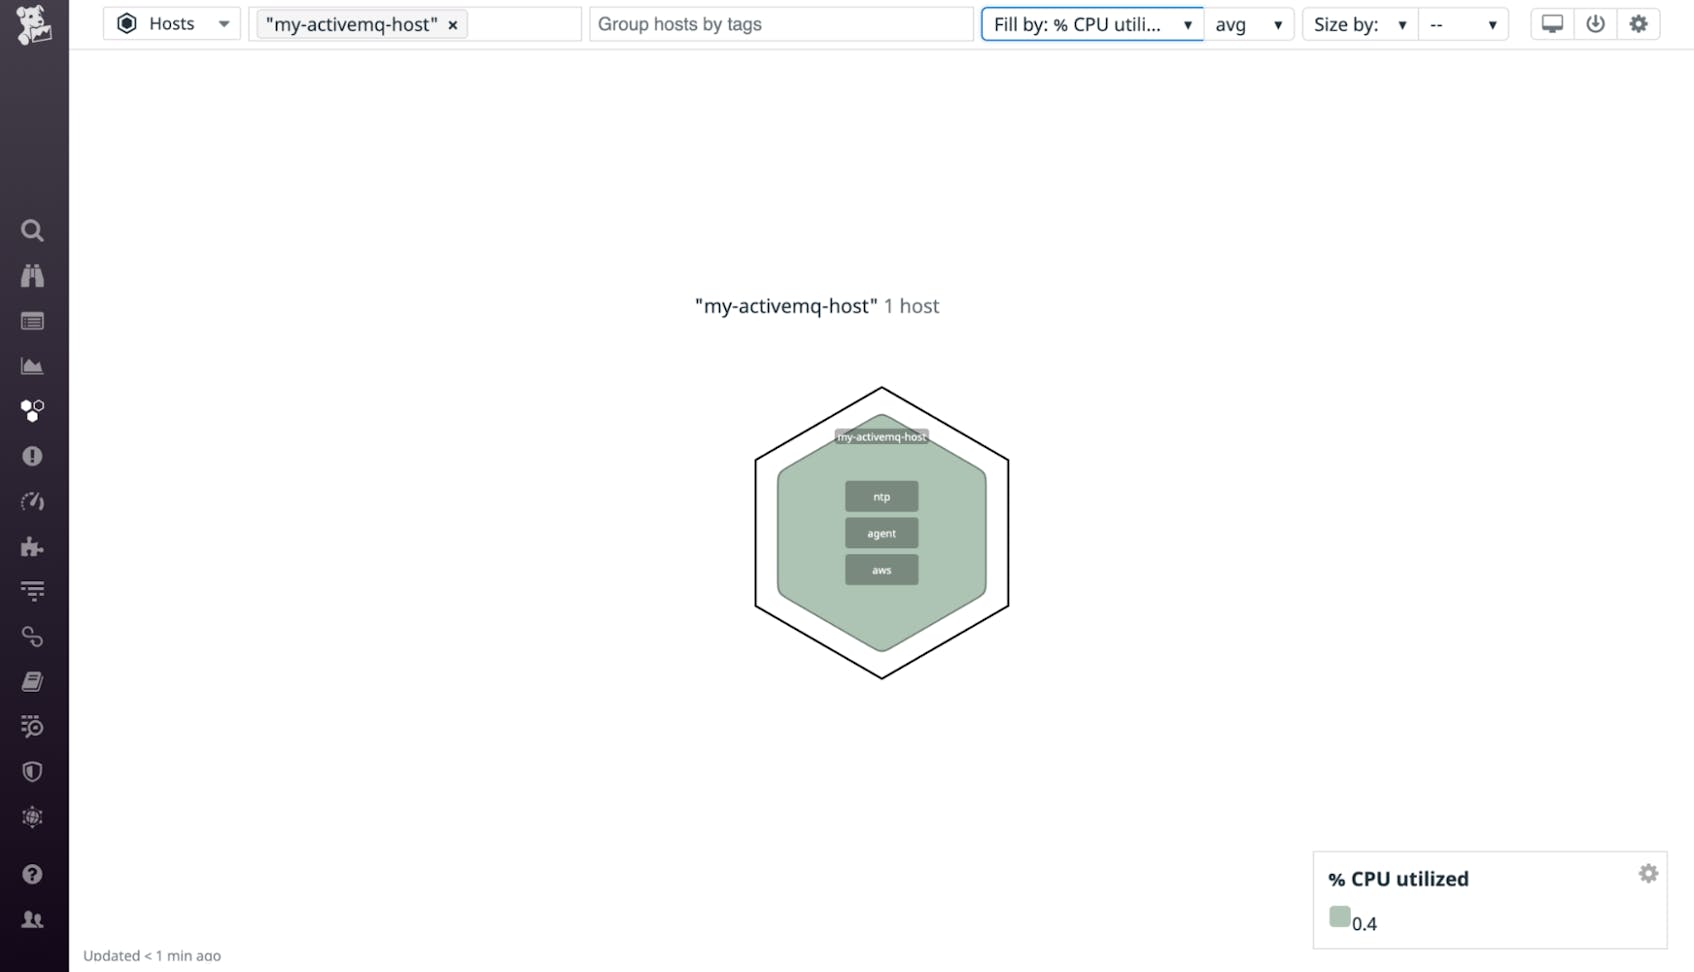
When you’ve completed the installation, you should be able to see your ActiveMQ host in the host map. If you’re already monitoring other hosts in Datadog, type your hostname in the Filter by field to limit the view to just your ActiveMQ host.
Your ActiveMQ host is now sending CPU, memory, and other system-level metrics to your Datadog account. Next we’ll show you how to configure the Agent to collect and send ActiveMQ metrics.
Configuring Datadog’s ActiveMQ integration
While both versions of ActiveMQ provide metrics via JMX, ActiveMQ Classic also exposes metrics on XML pages within the Web Console. See our documentation for a list of metrics the Agent collects from each of these two data sources.
By default, our integration collects the most important key metrics mentioned in Part 1, but you can also configure the Agent to collect other metrics from JMX, depending on your setup and priorities.
The Agent includes two sample ActiveMQ configuration files, one for the JMX data source (for both Classic and Artemis) and one for the Web Console data source (for Classic). It’s easy to modify the ActiveMQ configuration to collect JMX metrics that aren’t collected by default, and to avoid collecting those that you don’t need.
In this section, we’ll show you how to use the Datadog Agent’s JMX configuration file to designate which metrics to collect, and how to create custom configuration files to collect additional metrics. We’ll also walk through how to update the Web Console’s configuration file so the Agent can access that data source.
Data source: JMX (Classic and Artemis)
To configure the Agent to collect JMX metrics from ActiveMQ Classic and Artemis—and from the JVM in which ActiveMQ runs—find the activemq.d subdirectory under the Agent’s configuration directory and copy the conf.yaml.example file to conf.yaml. Update the host, port, user, and password values in the file to allow the Agent remote JMX access to your server.
In the same directory, the metrics.yaml file defines which ActiveMQ metrics the Agent will retrieve via JMX. Each metric is listed in this file as an attribute. The attribute names match those listed in the “JMX attribute” column of the key metrics tables in Part 1. Each attribute is followed by an alias (which specifies how the metric will be named in Datadog) and a metric_type (which determines how the metric will be interpreted and visualized).
You can comment out or delete any attribute—including its alias and metric_type—if you want the Agent to stop collecting that metric. If you want to begin collecting a new metric, add its information in metrics.yaml, using the appropriate domain value to indicate whether it’s a Classic metric or an Artemis metric.
Alternatively, you can create new configuration files in the conf.d/activemq.d/ directory to specify any additional metrics to be collected. You can name a new configuration file anything you like, and as long as it’s a valid YAML file that follows the format of metrics.yaml, the Agent will read its contents. The sample code below, saved as conf.d/activemq.d/broker_metrics.yaml, configures the Agent to collect the value of the UptimeMillis MBean to monitor the broker’s uptime.
activemq.d/broker_metrics.yaml
init_config:
  is_jmx: true

  conf:
    - include:
        destinationType: Broker
        attribute:
          UptimeMillis:
            alias: activemq.broker.uptimemillis
            metric_type: count
Restart the Agent to apply any configuration changes, then execute the status command to confirm your changes. Look for the activemq section in the status output, as shown below.
    activemq
      instance_name : activemq-localhost-1099
      message : <no value>
      metric_count : 93
      service_check_count : 0
      status : OK
Data source: Web Console (Classic)
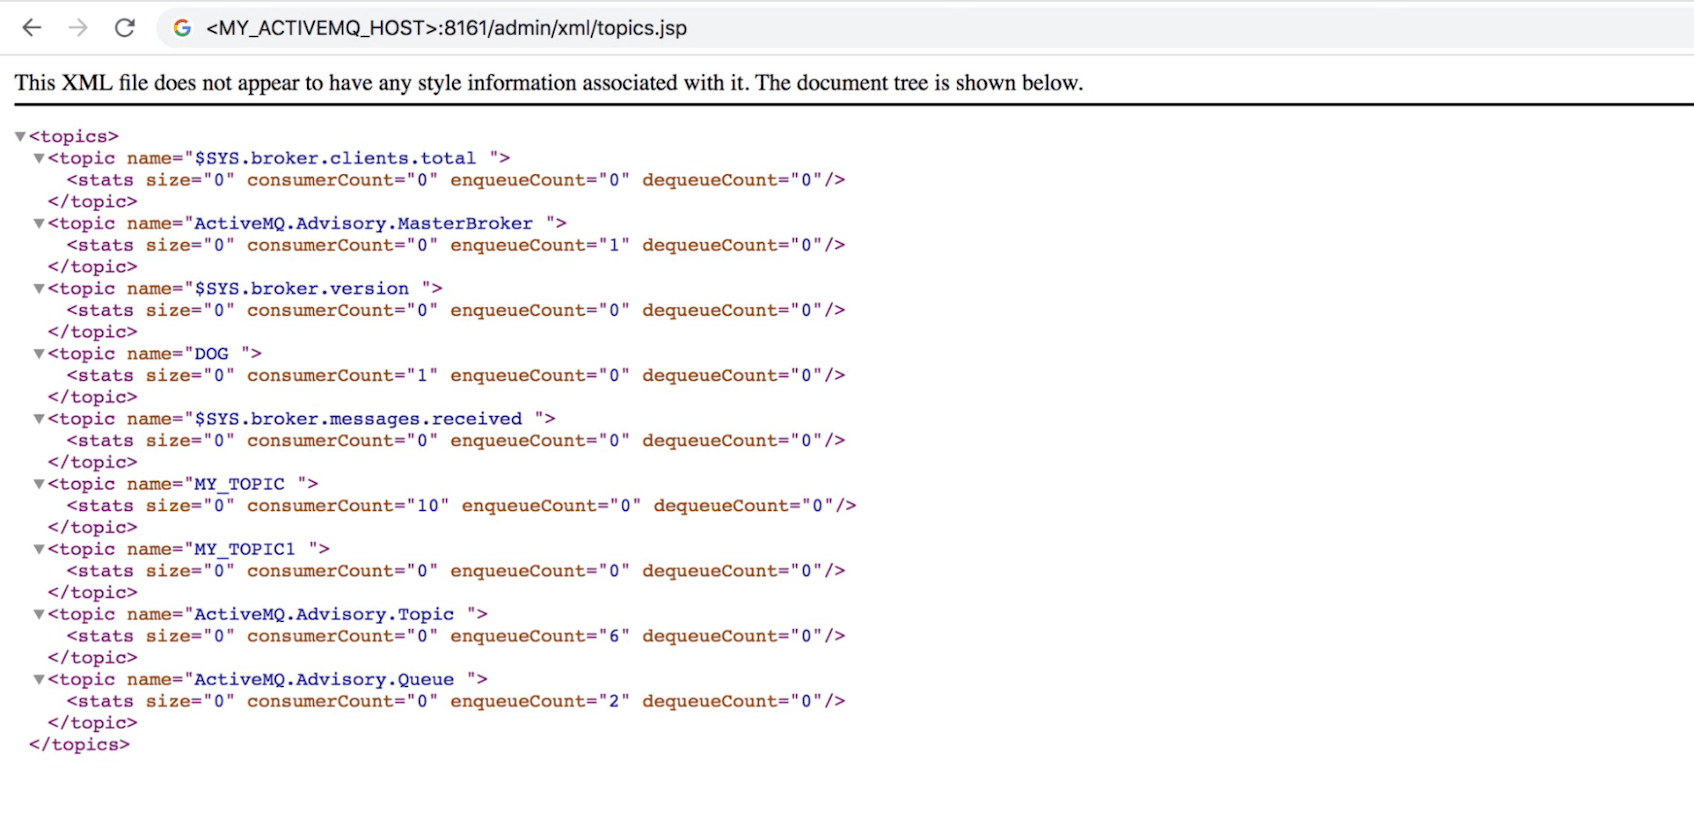
ActiveMQ Classic’s built-in Web Console includes three pages of XML data feeds—one each to show metrics from queues, topics, and subscribers. The screenshot below shows a Web Console page that serves as a data source for ActiveMQ topics.
If you’re monitoring ActiveMQ Classic, you’ll need to configure the Agent to access these pages so it can collect metrics from them. Inside conf.d/ is an activemq_xml.d/ subdirectory, which includes a configuration file that tells the Agent how to access metrics from the ActiveMQ Web Console. Copy the conf.yaml.example file in that directory to a new file named conf.yaml. Uncomment the username and password lines and update those values to match the authentication information for your Web Console. If you’ve updated your ActiveMQ configuration to use a port other than 8161, change the port on the url line to reflect that. Your conf.yaml should look like the example below:
activemq_xml.d/conf.yaml
init_config:

instances:
  - url: http://localhost:8161
    username: <MY_USERNAME>
    password: <MY_PASSWORD>
Restart the Agent so your configuration changes take effect. Then, execute the Agent’s status command to confirm that your changes were successful. Look for an activemq_xml section in the status output, as shown below.
    activemq_xml (1.11.0)
    ---------------------
      Instance ID: activemq_xml:6a534a08d66ad2ff [OK]
      Configuration Source: file:/etc/datadog-agent/conf.d/activemq_xml.d/conf.yaml
      Total Runs: 4
      Metric Samples: Last Run: 7, Total: 7
      Events: Last Run: 0, Total: 0
      Service Checks: Last Run: 0, Total: 0
      Average Execution Time : 38ms
      Last Execution Date : 2021-07-13 17:54:01 UTC (1626198841000)
      Last Successful Execution Date : 2021-07-13 17:54:01 UTC (1626198841000)
Now your Agent is collecting metrics from the ActiveMQ Classic Web Console and forwarding them to your Datadog account. If you have more than one ActiveMQ host to monitor, repeat the Agent installation and configuration steps on all your hosts. You can also use a configuration management tool like Ansible or Chef to automate the deployment and configuration of the Datadog Agent.
Installing the ActiveMQ integration
You’ve now configured the Agent to collect ActiveMQ metrics, as well as metrics that let you monitor the JVM’s resource usage and garbage collection activity. Next, you simply need to enable the ActiveMQ integration so you can visualize and monitor these metrics.
Visit the ActiveMQ integration tile in your Datadog account. Click the Configuration tab, then scroll down and click the Install Integration button. Now that your Datadog account is configured to collect and display ActiveMQ metrics, you’re ready to visualize and alert on them. The next section will show you how to start using dashboards in Datadog to view your ActiveMQ metrics.
Viewing ActiveMQ metrics in Datadog
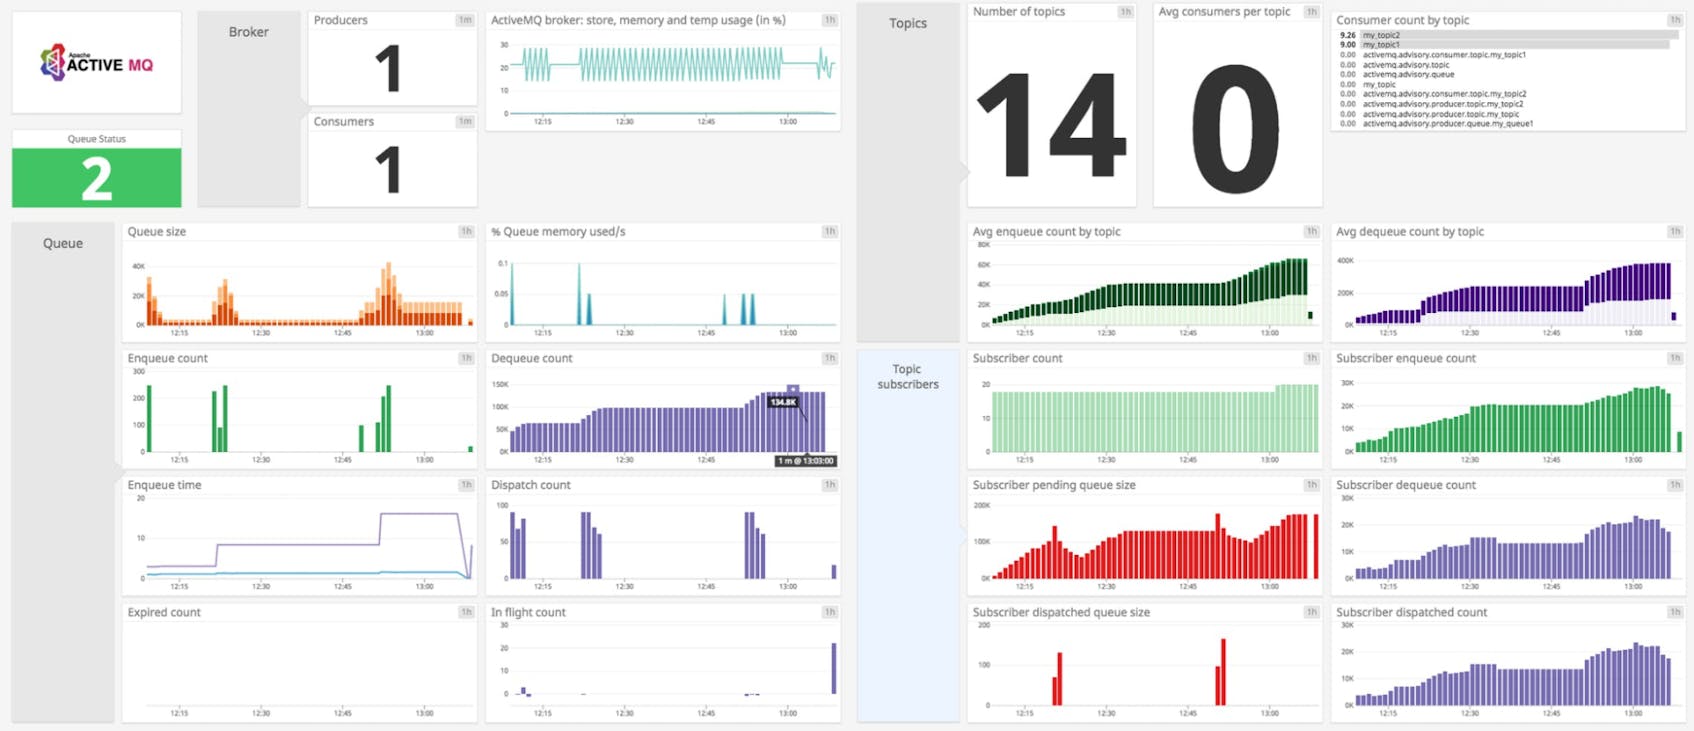
As soon as you’ve installed the Agent and enabled the ActiveMQ integration on your account, you’ll see both ActiveMQ - Overview and ActiveMQ Artemis - Overview on your dashboard list. These dashboards help you track the performance of your ActiveMQ Classic or ActiveMQ Artemis messaging infrastructure, and give you a starting point to investigate potential problems.
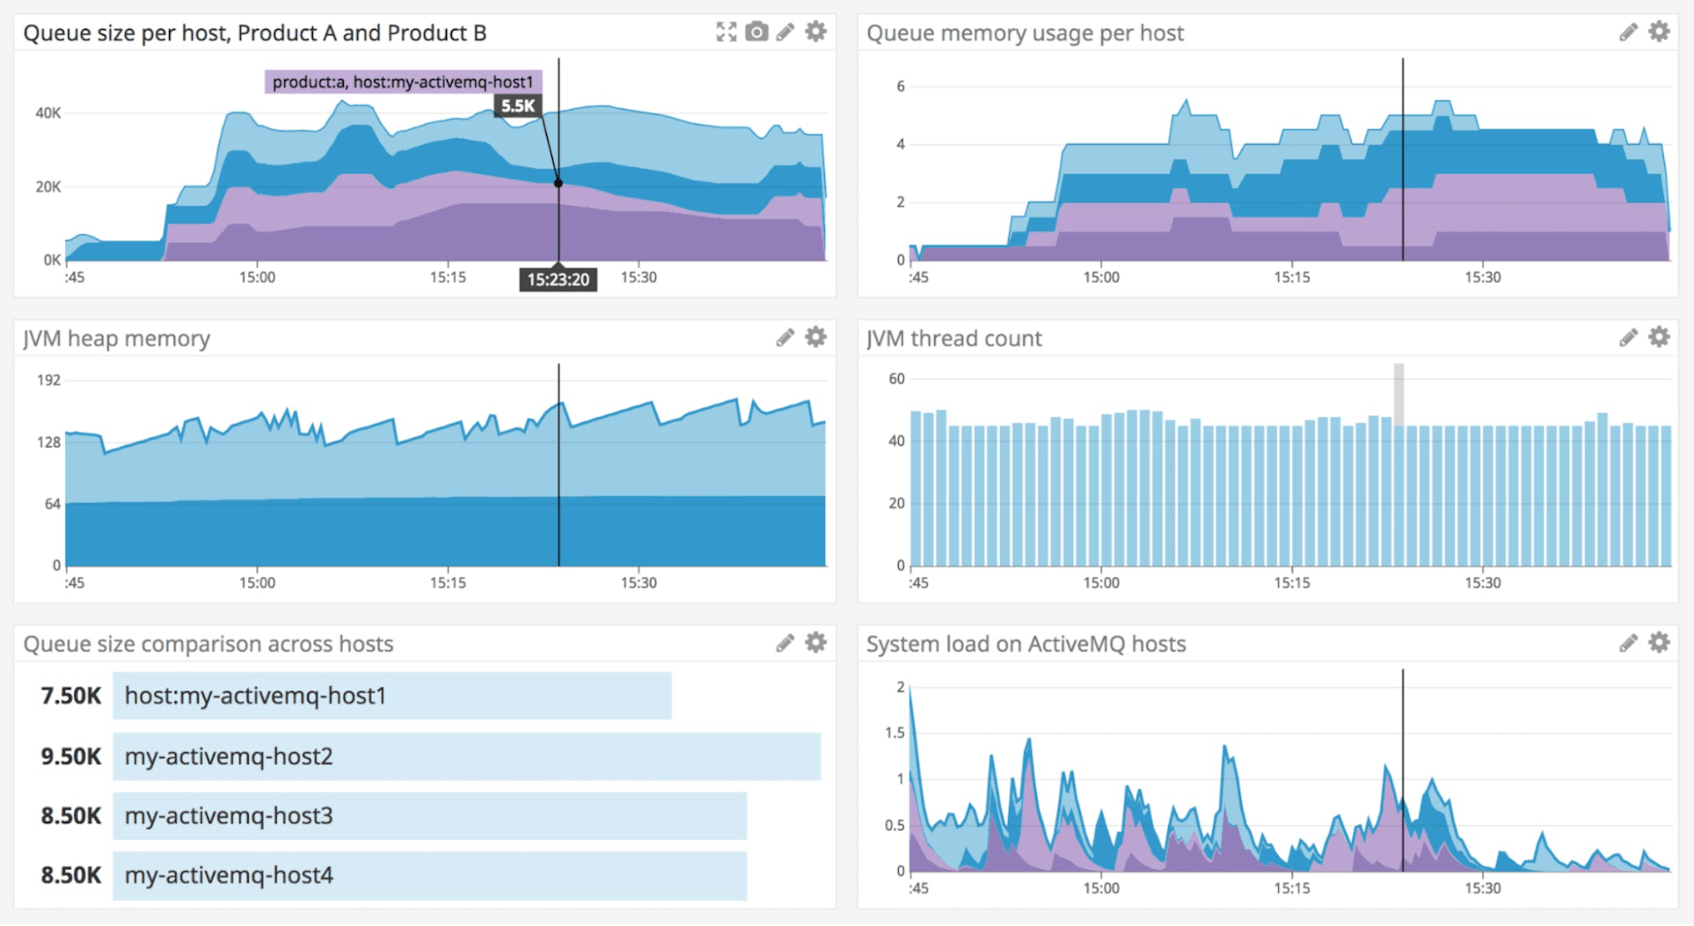
To get even more out of your ActiveMQ dashboard, you can customize it to display metrics from related elements of your infrastructure, such as the JVM’s memory usage and thread count.
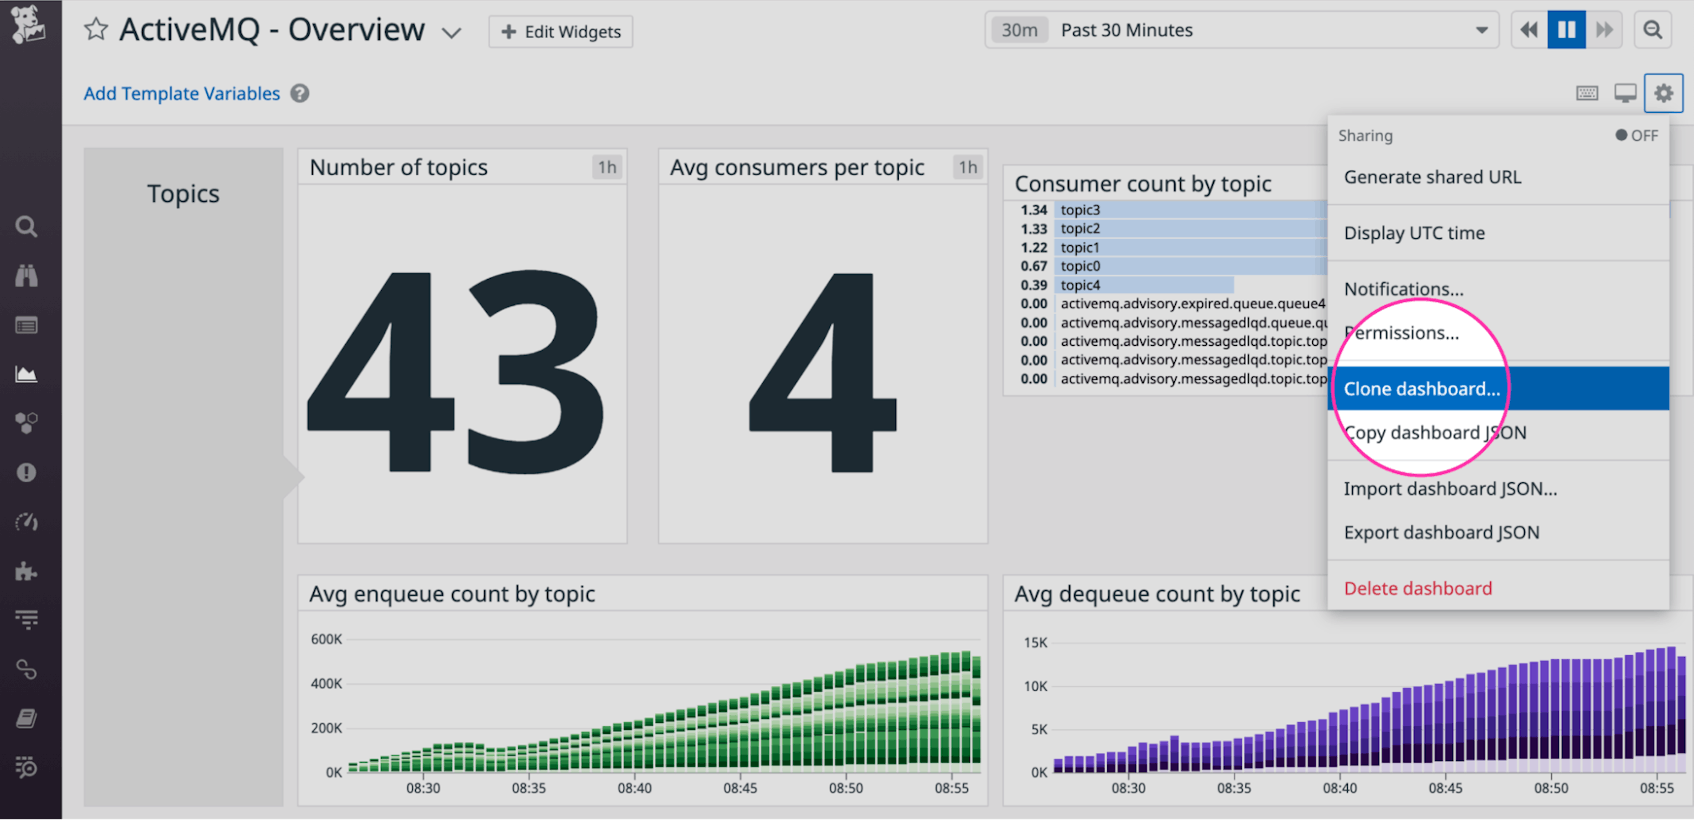
To create a custom dashboard, first clone the ActiveMQ - Overview or ActiveMQ Artemis - Overview dashboard by clicking the gear icon in the top-right corner and selecting Clone dashboard….
Click the Edit Widgets button at the top of the page to start adding the widgets you need to graph the data that’s important to you. You can customize your dashboard to include telemetry from any of Datadog’s 850+ integrations to get a unified view of your entire messaging infrastructure in a single pane of glass.
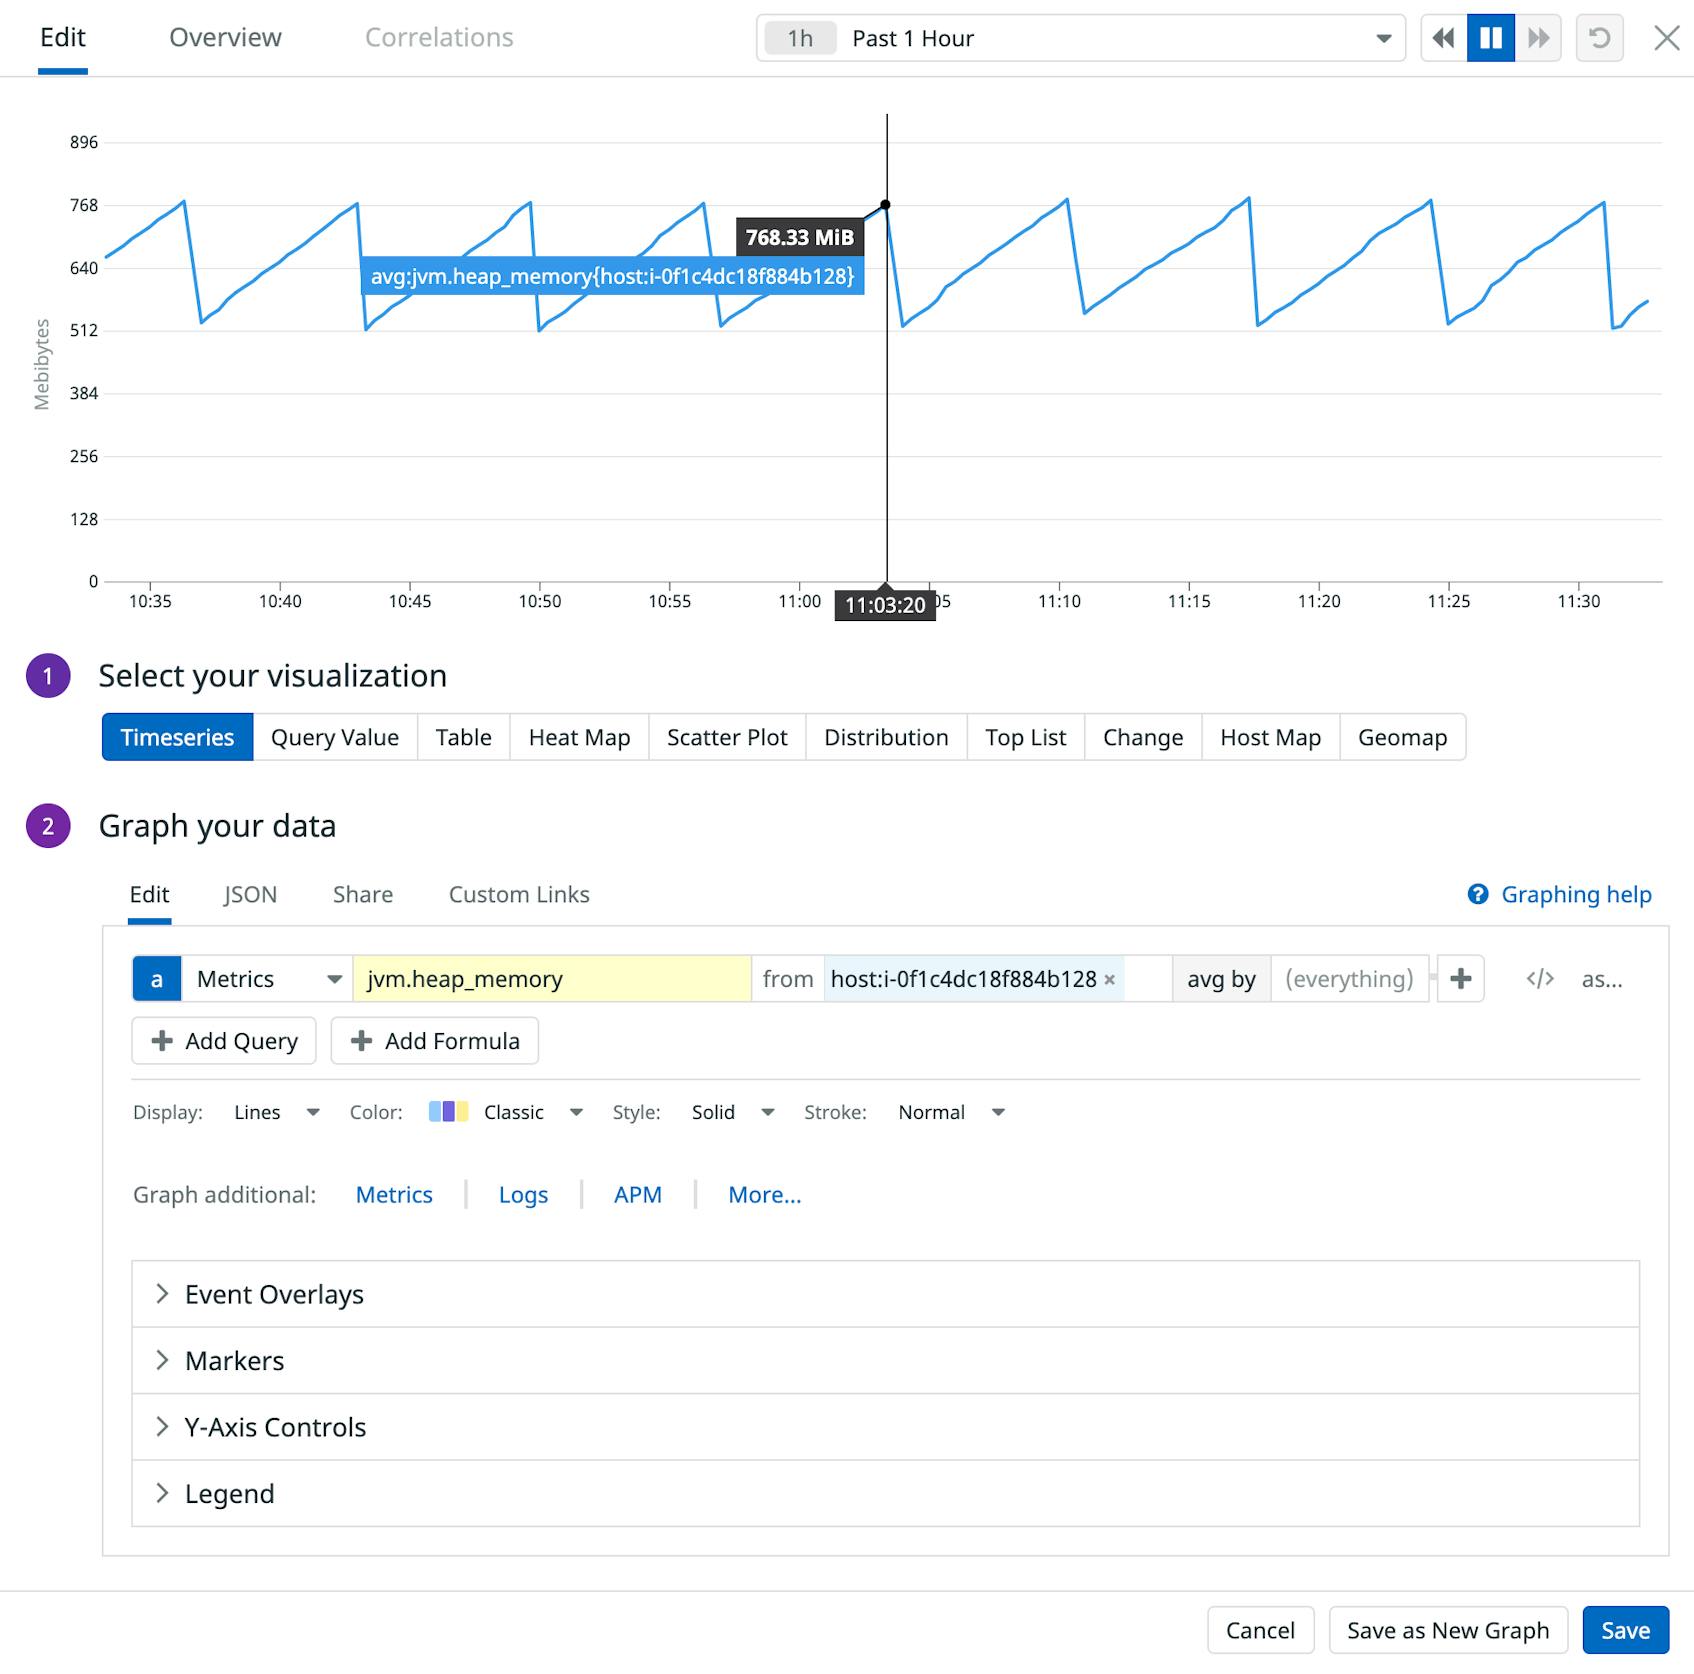
The screenshot below shows how you can add a graph to your custom dashboard that displays heap memory usage from a single host.
If the metric data visualized on your dashboard indicates a potential problem, your logs can be a helpful source of further information. In the next section, we’ll walk through how to collect and view ActiveMQ logs.
Bringing in ActiveMQ logs
You can correlate logs with metrics to reveal context around anomalies you see on your dashboards. In this section, we’ll show you how to use Datadog to collect and process logs from ActiveMQ Classic and Artemis, so you can search, graph, analyze, and alert on them.
Enabling log collection
First, you’ll need to configure the Agent to collect logs from your ActiveMQ host. Log collection is disabled in the Agent by default, so you’ll need to enable it by editing the Agent’s configuration file (datadog.yaml). Open the file, then uncomment and update the logs_enabled line to read:
datadog.yaml
logs_enabled: trueConfiguring ActiveMQ log collection
The Agent needs to be able to find and access your ActiveMQ logs. By default, ActiveMQ stores logs in the broker’s data/ subdirectory (in the case of ActiveMQ Classic) or its log/ subdirectory (in the case of Artemis). You can configure this by editing the logging.properties file. In ActiveMQ Classic, you’ll find this file in the conf/ subdirectory beneath the ActiveMQ installation directory. In the case of Artemis, you’ll find it the broker’s etc/ subdirectory.
Make sure the dd-agent user has read access to the directory where your ActiveMQ logs are written so that the Agent can retrieve the logs and forward them to Datadog.
Modify activemq.d/conf.yaml to add a log configuration like the one shown below. This example configures the Agent to also forward audit logs, which you can optionally collect from Classic and Artemis. Replace <MY_ACTIVEMQ_LOG> and <MY_ACTIVEMQ_AUDIT_LOG> with the full path to your log files. You can use the service tag to aggregate logs, metrics, and traces from different technologies throughout your stack, so you should replace <MY_ACTIVEMQ_SERVICE> with a value that suits your use case:
activemq.d/conf.yaml
logs:
  - type: file
    path: <MY_ACTIVEMQ_LOG>
    service: <MY_ACTIVEMQ_SERVICE>
    source: activemq
  - type: file
    path: <MY_ACTIVEMQ_AUDIT_LOG>
    service: <MY_ACTIVEMQ_SERVICE>
    source: activemq
Note that this configuration applies a source value of activemq to the logs, which will automatically trigger the appropriate log pipeline to process them. The pipeline applies parsing rules that extract log facets and attributes that give you powerful ways to search and filter your logs in Datadog.
You can add custom tags to your log configuration to give you even more dimensions you can use to aggregate and analyze your logs. The example below extends the conf.yaml file from above to assign a value of checkout to the service tag and apply custom tags to the ActiveMQ logs and the audit logs:
activemq.d/conf.yaml
logs:
  - type: file
    path: <MY_ACTIVEMQ_LOG>
    service: checkout
    source: activemq
    tags:
      - 'team:development'
  - type: file
    path: <MY_ACTIVEMQ_AUDIT_LOG>
    service: checkout
    source: activemq
    tags:
      - 'team:development'
      - 'type:audit'
To load your updated configuration, restart the Agent by using the appropriate command for your OS.
Viewing logs
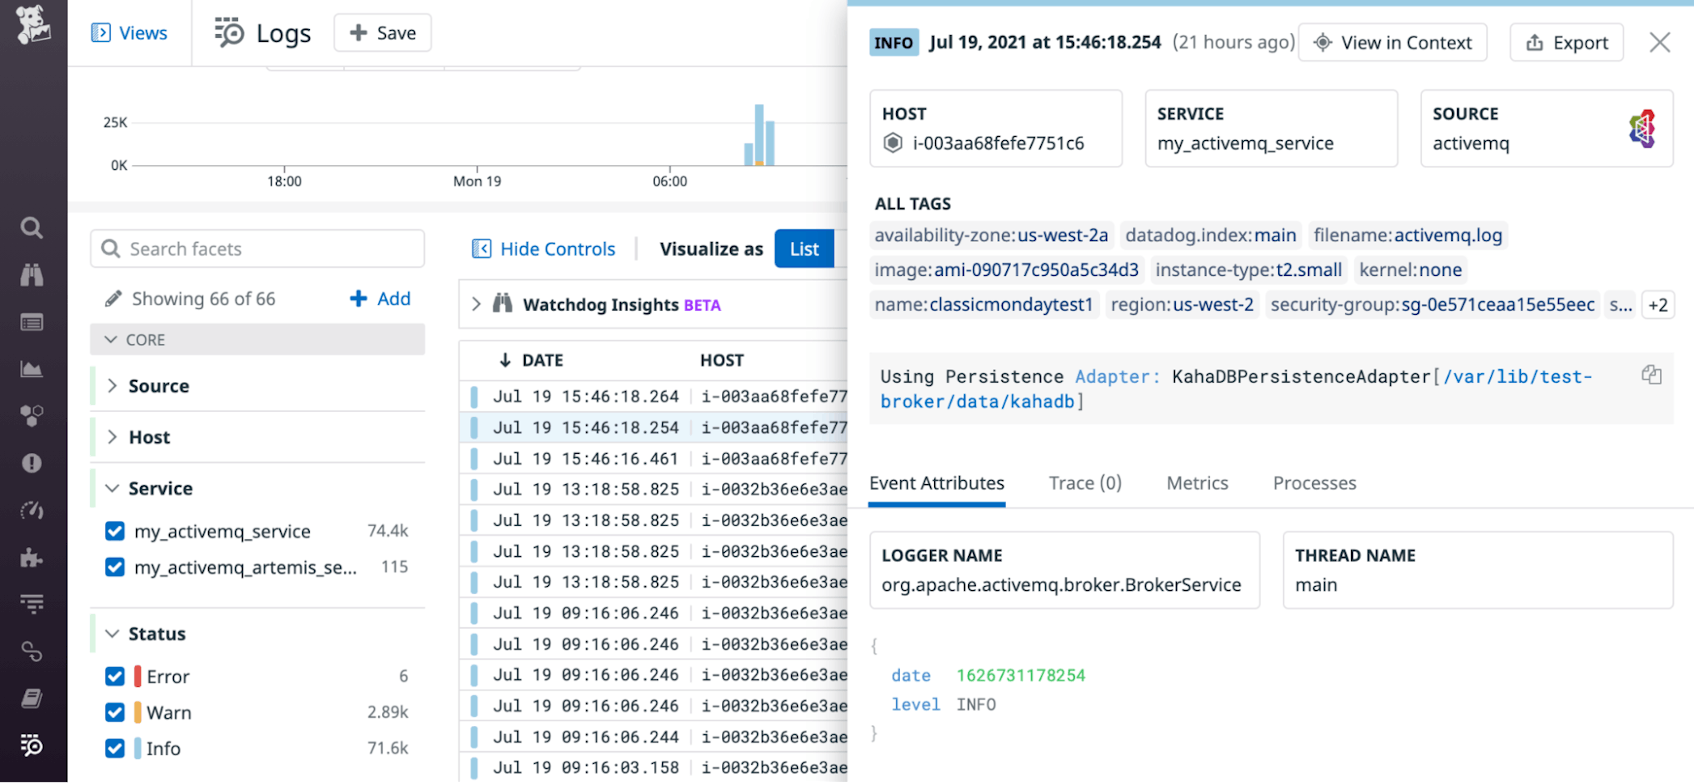
To see all your ActiveMQ logs, visit the Log Explorer page in your Datadog account. If you click on a log, you’ll see the full log message, as well as any information that was extracted by the pipeline, such as the host, service, timestamp, and severity level.
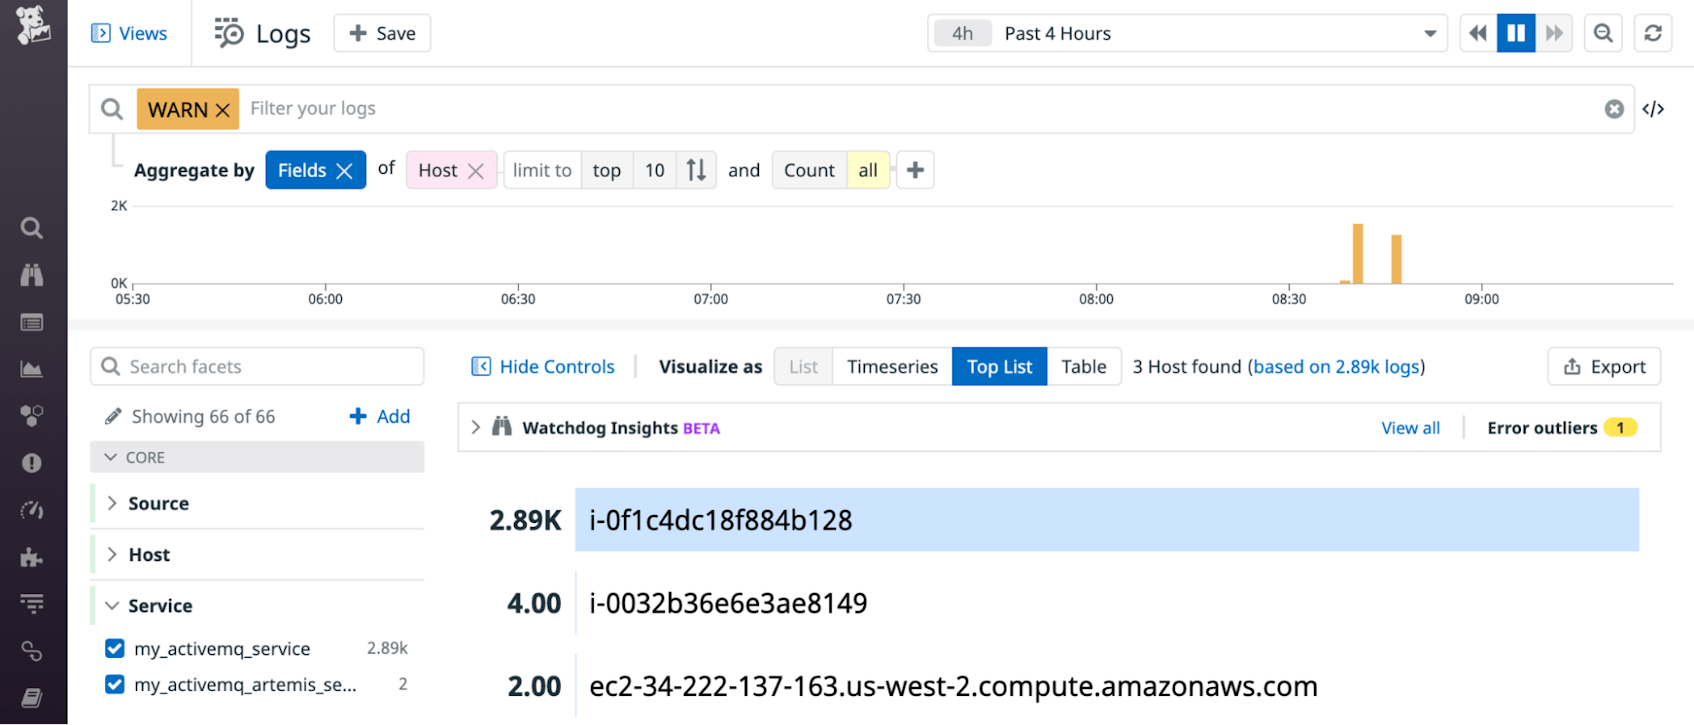
With Datadog, you can aggregate your ActiveMQ logs to reveal patterns and trends that can help you troubleshoot issues in your messaging infrastructure. You can query and display important log data as a top list or a timeseries graph. In the screenshot below, we’ve used the severity level and service facets to see a top list of the ActiveMQ hosts that generated the most WARN logs over the past four hours. These WARN logs could indicate, for example, a configuration error that causes ActiveMQ to request more space for its message store than the host has available.
If you’d like to view this graph alongside other metrics, just click the Export button in the top-right corner to add it to a new or existing dashboard. For more information about using log aggregation and the rest of Datadog’s log management features, see the documentation.
Using custom tags to analyze your metrics
Datadog automatically tags your ActiveMQ metrics with the name of the host, and applies other useful tags that vary depending on the source of the metric. For example, the ActiveMQ Classic metric activemq.queue.size is tagged with the queue it came from, and Artemis’s activemq.artemis.address.size metric automatically gets tagged with the address. You can strategically use tags to create highly focused dashboards and alerts that provide fine-grained insights into every layer of your ActiveMQ environment.
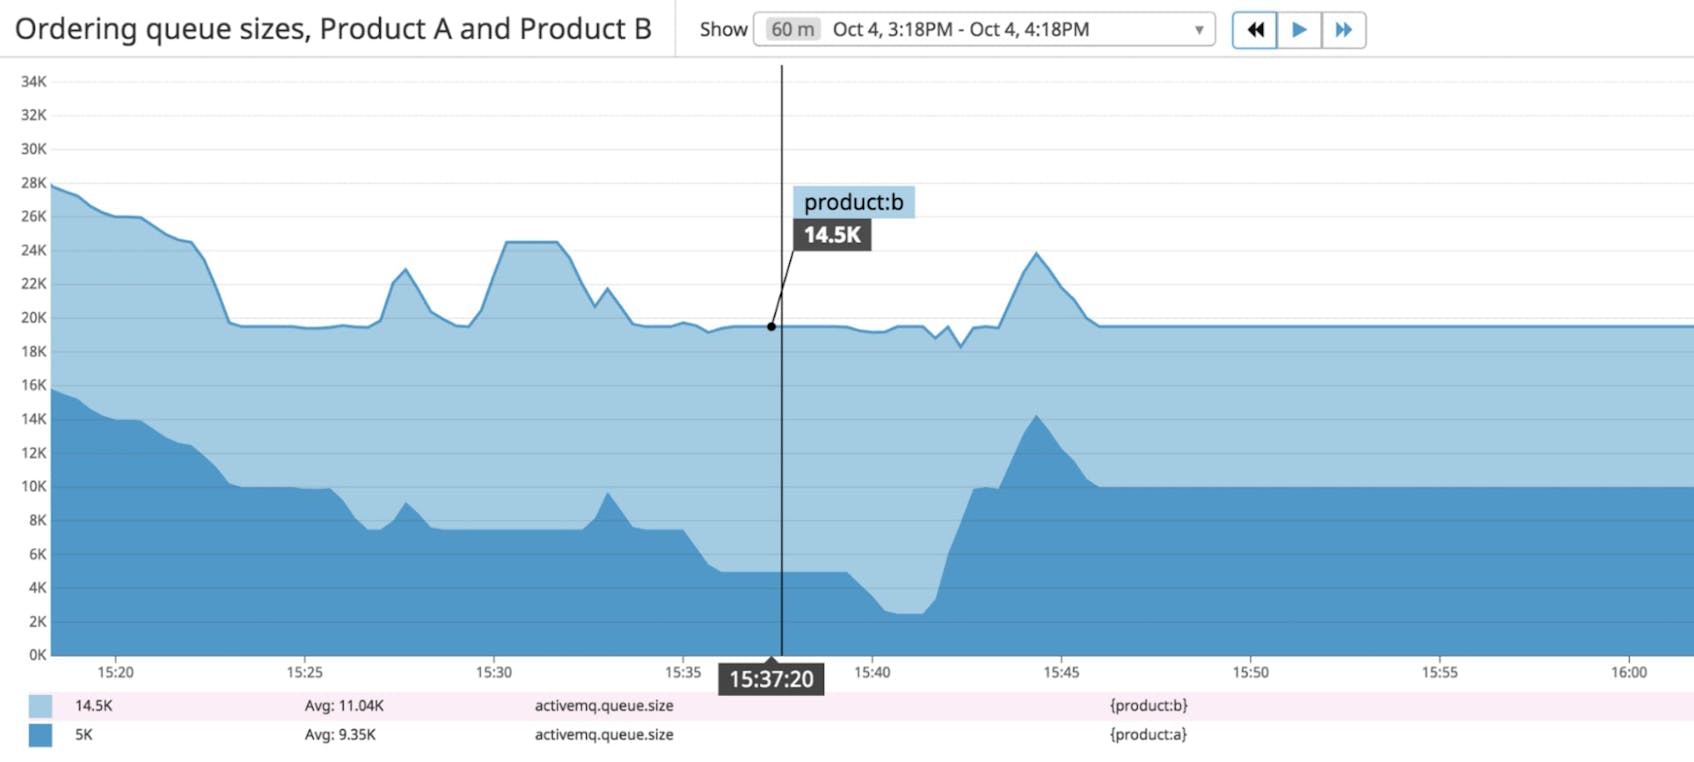
Custom tags give you greater control over what you can visualize and monitor in your ActiveMQ infrastructure. For example, if you were operating two ActiveMQ brokers—one to process orders for a product named a and another for a product named b—you could tag them accordingly. As your operation scales, the ordering process for each product could involve multiple hosts—or even multiple cloud providers. But your custom product tag would still allow you to visualize the queue size of each product, as shown in the following screenshot.
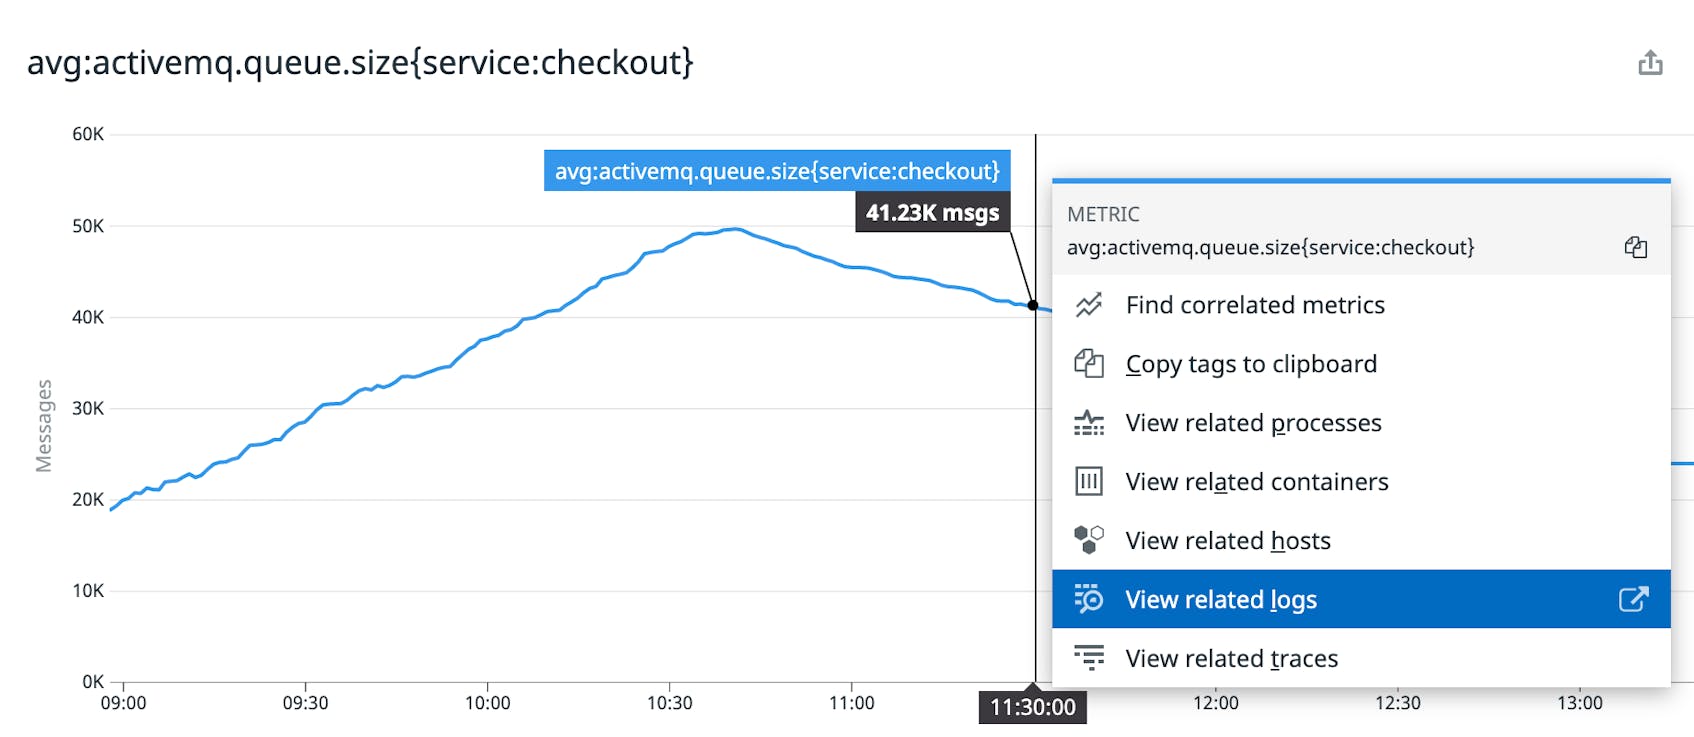
Using consistent tags across your ActiveMQ logs and metrics makes it easy to correlate them in Datadog. In the screenshot below, the graph plots the size of queues tagged service:checkout. You can click on any point in the timeseries graph to easily navigate to logs that share the same service tag and were generated around the same time. In the upcoming sections, we’ll show you how to apply the same service tag to ActiveMQ’s JMX and Web Console metrics.
Tagging metrics from JMX (Classic and Artemis)
To add custom tags to the metrics that come from JMX, edit the activemq.d/conf.yaml file in the Agent’s configuration directory. The example below adds the same service tag we used earlier.
activemq.d/conf.yaml
instances:
  - host: localhost
    port: 1099
    tags:
      - 'service:checkout'
Tagging metrics from the Web Console (Classic)
To add custom tags to ActiveMQ Classic metrics that come from the ActiveMQ Web Console, you’ll need to edit the activemq_xml.d/conf.yaml file you created earlier. The sample code below adds the same service:checkout tag we used in the log configuration section earlier.
activemq_xml.d/conf.yaml
instances:
  - url: http://localhost:8161
    username: <MY_USERNAME>
    password: <MY_PASSWORD>
    tags:
      - 'service:checkout'
Restart the Agent to apply the revised configuration.
Once you’ve applied custom tags to your metrics, you can start using them in your graphs and alerts. In the next section, we’ll walk through how to set up alerts in Datadog.
Using alerts to stay informed
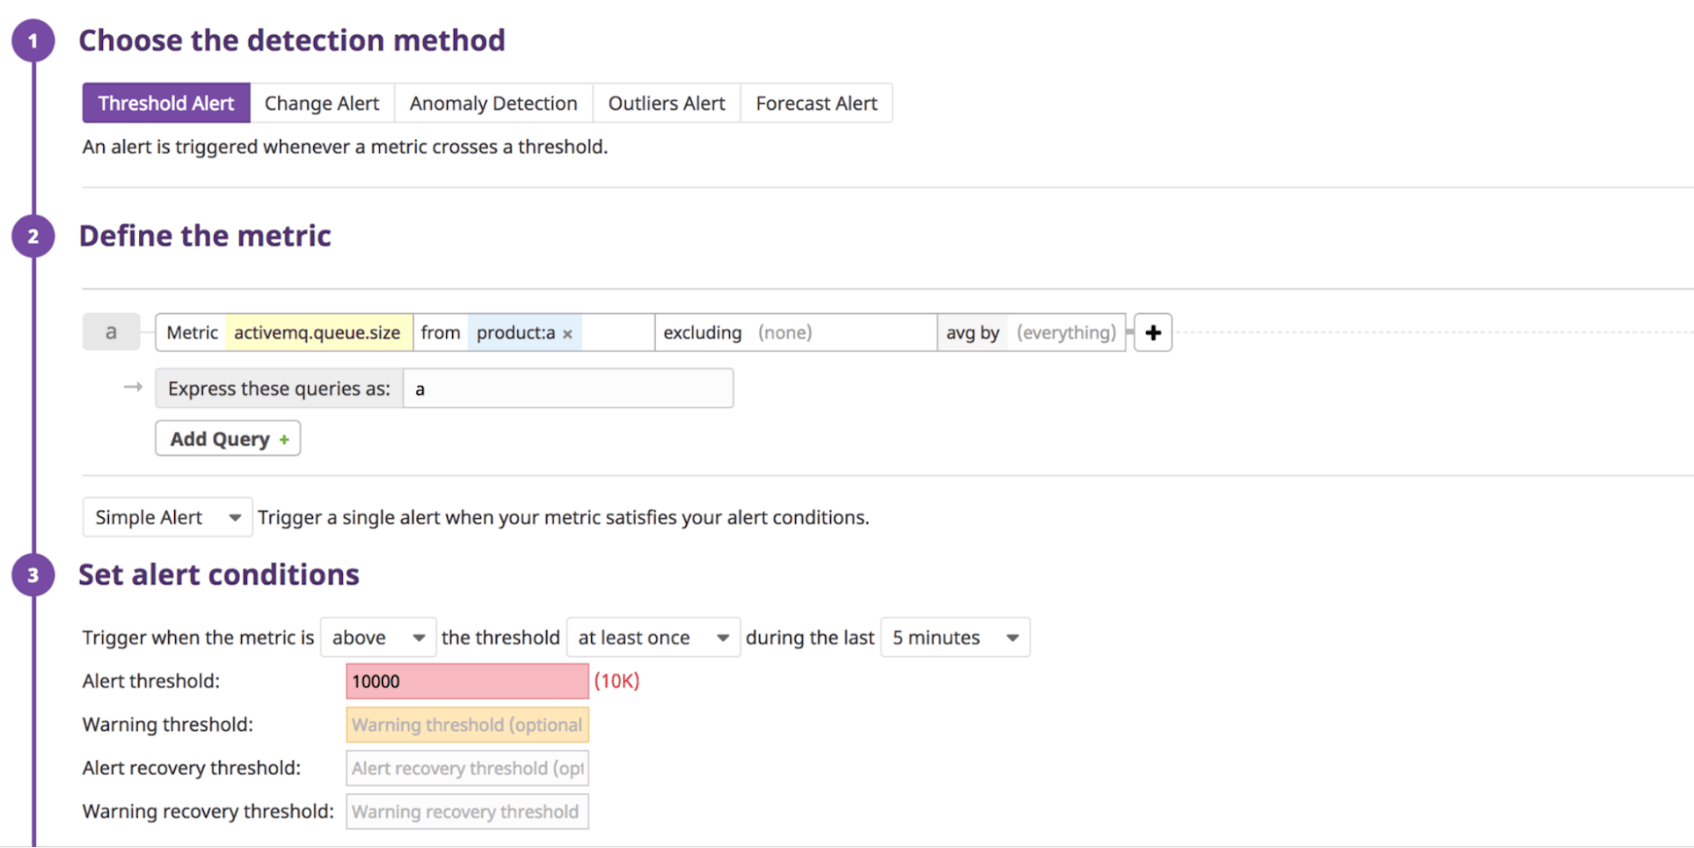
Alerts keep you informed of potential issues in your ActiveMQ infrastructure. You can use tags in your alert definitions to create more focused and actionable alerts. Using our custom product tag from the example in the previous section, the screenshot below illustrates how you could set up an alert that will trigger if the QueueSize metric on an ActiveMQ Classic destination rises above 10,000 only on queues tagged with product:a.
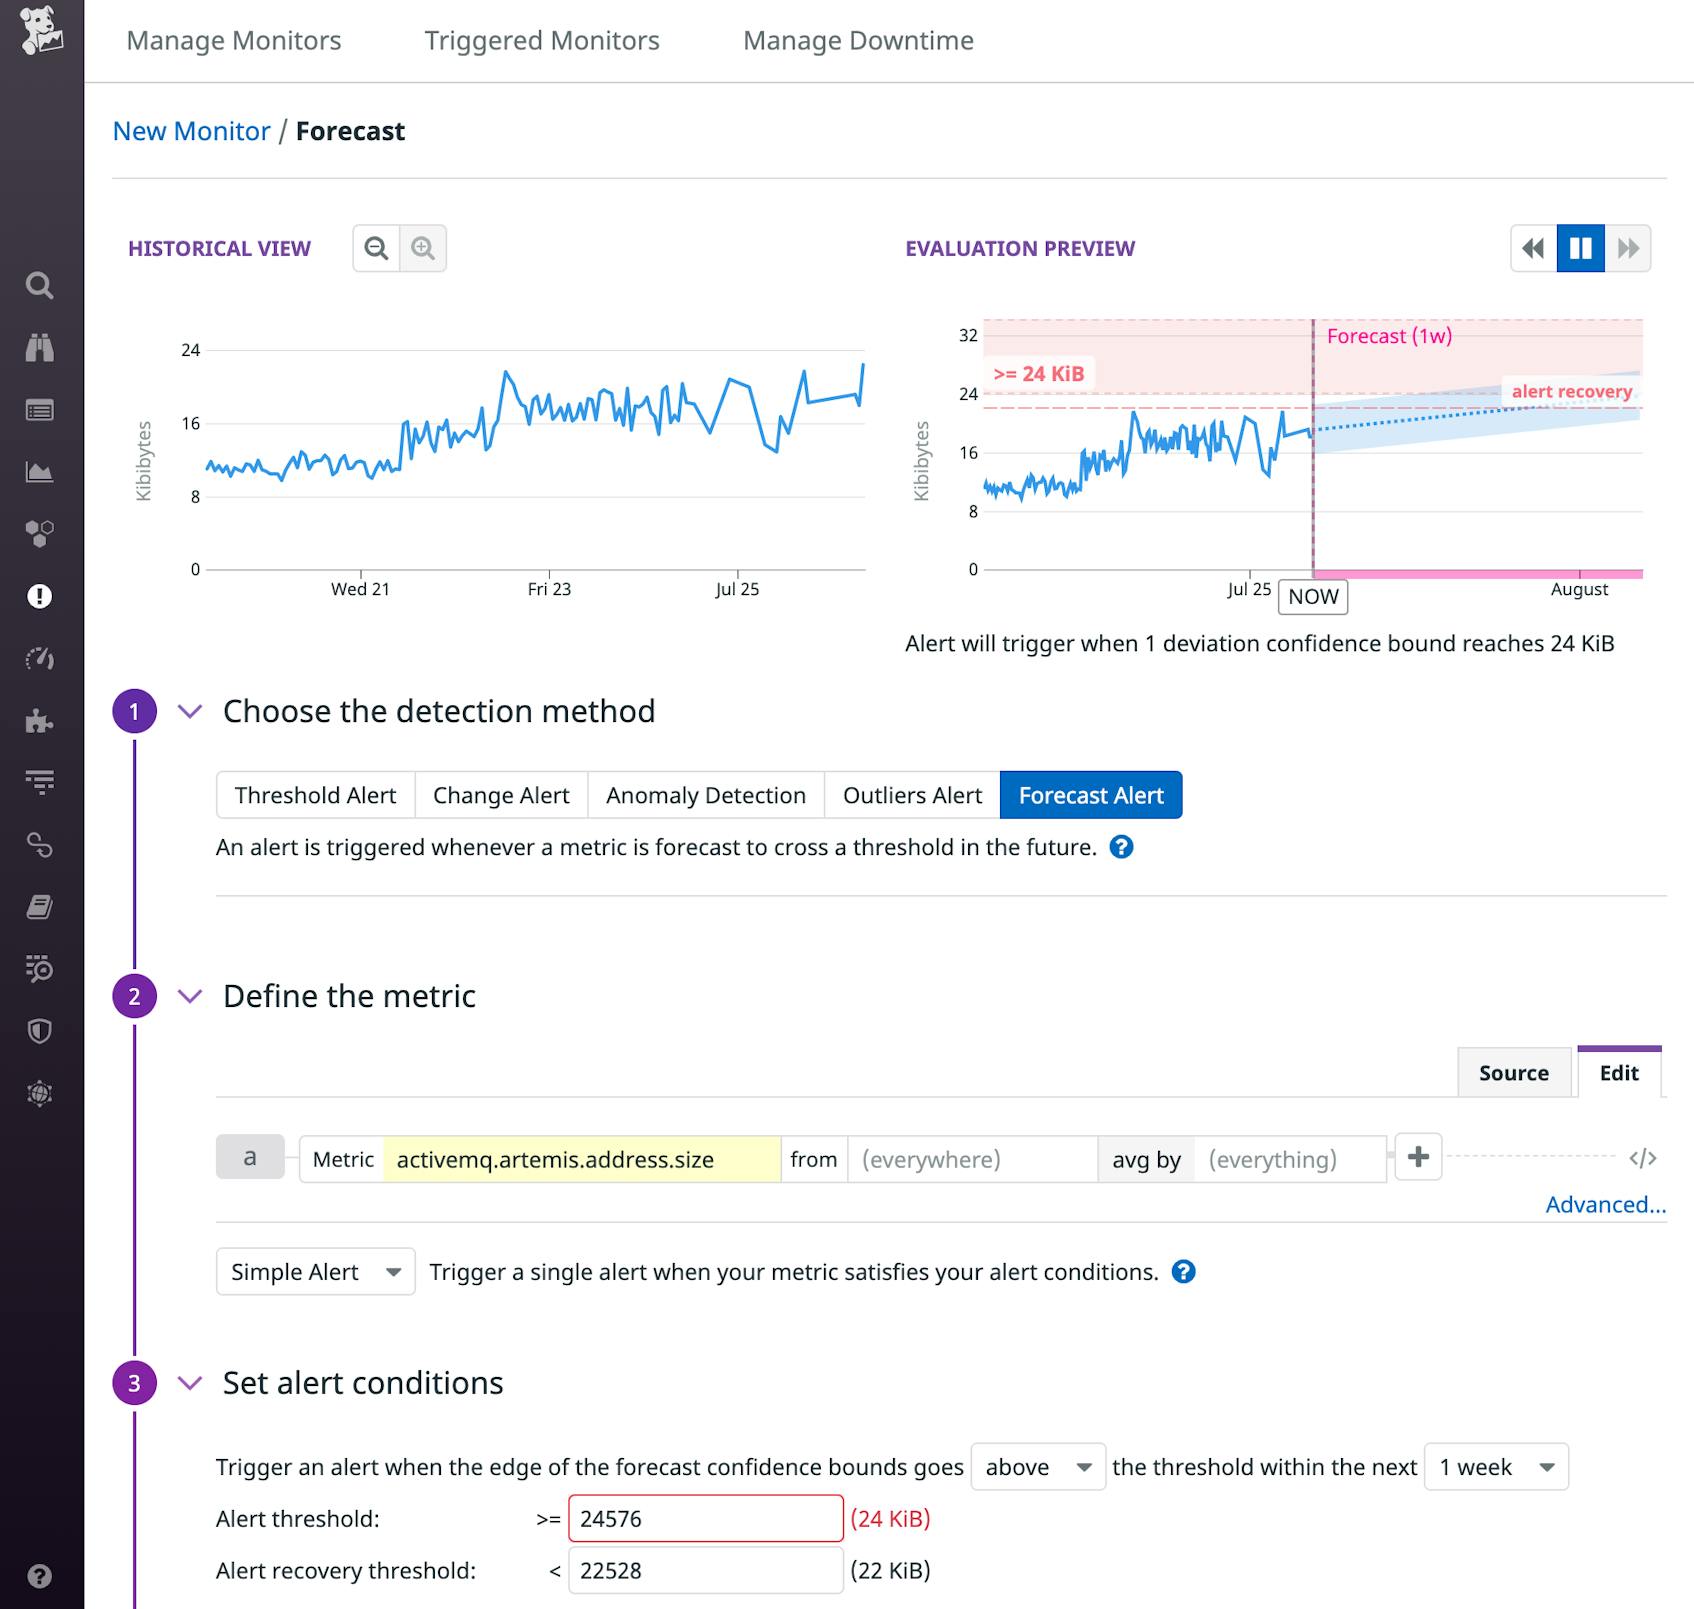
You can set up alerts to automatically monitor any of the key ActiveMQ metrics we identified in Part 1 of this series. The example below shows a forecast alert that will trigger if an ActiveMQ Artemis broker’s activemq.artemis.address.size value is expected to rise above 24 KiB in the next week. This alert could trigger, for example, if your consumers are falling behind, alerting you that you may need to scale out your fleet of consumers to reduce the number of messages in the queue.
To get started quickly using Datadog alerts, you can enable the recommended monitors for ActiveMQ. And you can integrate your Datadog account with PagerDuty, Slack, and many other notification and collaboration services to make these alerts visible to your team.
Maximize your visibility with ActiveMQ monitoring
Collecting and tagging ActiveMQ metrics and logs gives you deep visibility into your deployment. You can use Datadog’s dashboards, alerts, and log management features to monitor your whole messaging infrastructure—brokers, addresses, destinations, clients, and the hosts that run it all. If you’re not already using Datadog, get started with a free 14-day trial.
Source Markdown for this post is available on GitHub. Questions, corrections, additions, etc.? Please let us know.


