Aaron Kaplan
With vSphere and Tanzu Kubernetes Grid (TKG), VMware enables enterprise organizations to combine the economic advantages of virtual machines (VMs) with the agility, portability, and scalability provided by Kubernetes.
vSphere is VMware’s platform for the provisioning and management of VMs. vSphere’s vCenter Servers enable organizations to centrally manage and monitor their VMs, while its ESXi hypervisors help them optimize their infrastructure and reduce costs by strategically allocating bare-metal server resources. TKG is VMware’s turnkey solution for deploying and managing Kubernetes clusters at enterprise scale.
We’re pleased to announce that Datadog now supports monitoring TKG clusters deployed on vSphere as well as their underlying VM resources. Our vSphere integration now comes with an additional out-of-the-box (OOTB) dashboard and base configurations that enable you to start monitoring your TKG VMs immediately. And by installing the Datadog Agent on your TKG clusters, you can collect container-, pod-, and node-level metrics.
This post will guide you through monitoring TKG on vSphere holistically using real-time metrics and events from both your TKG clusters and their underlying vSphere hosts and VMs.
Monitor your entire vCenter and Kubernetes environment in real time
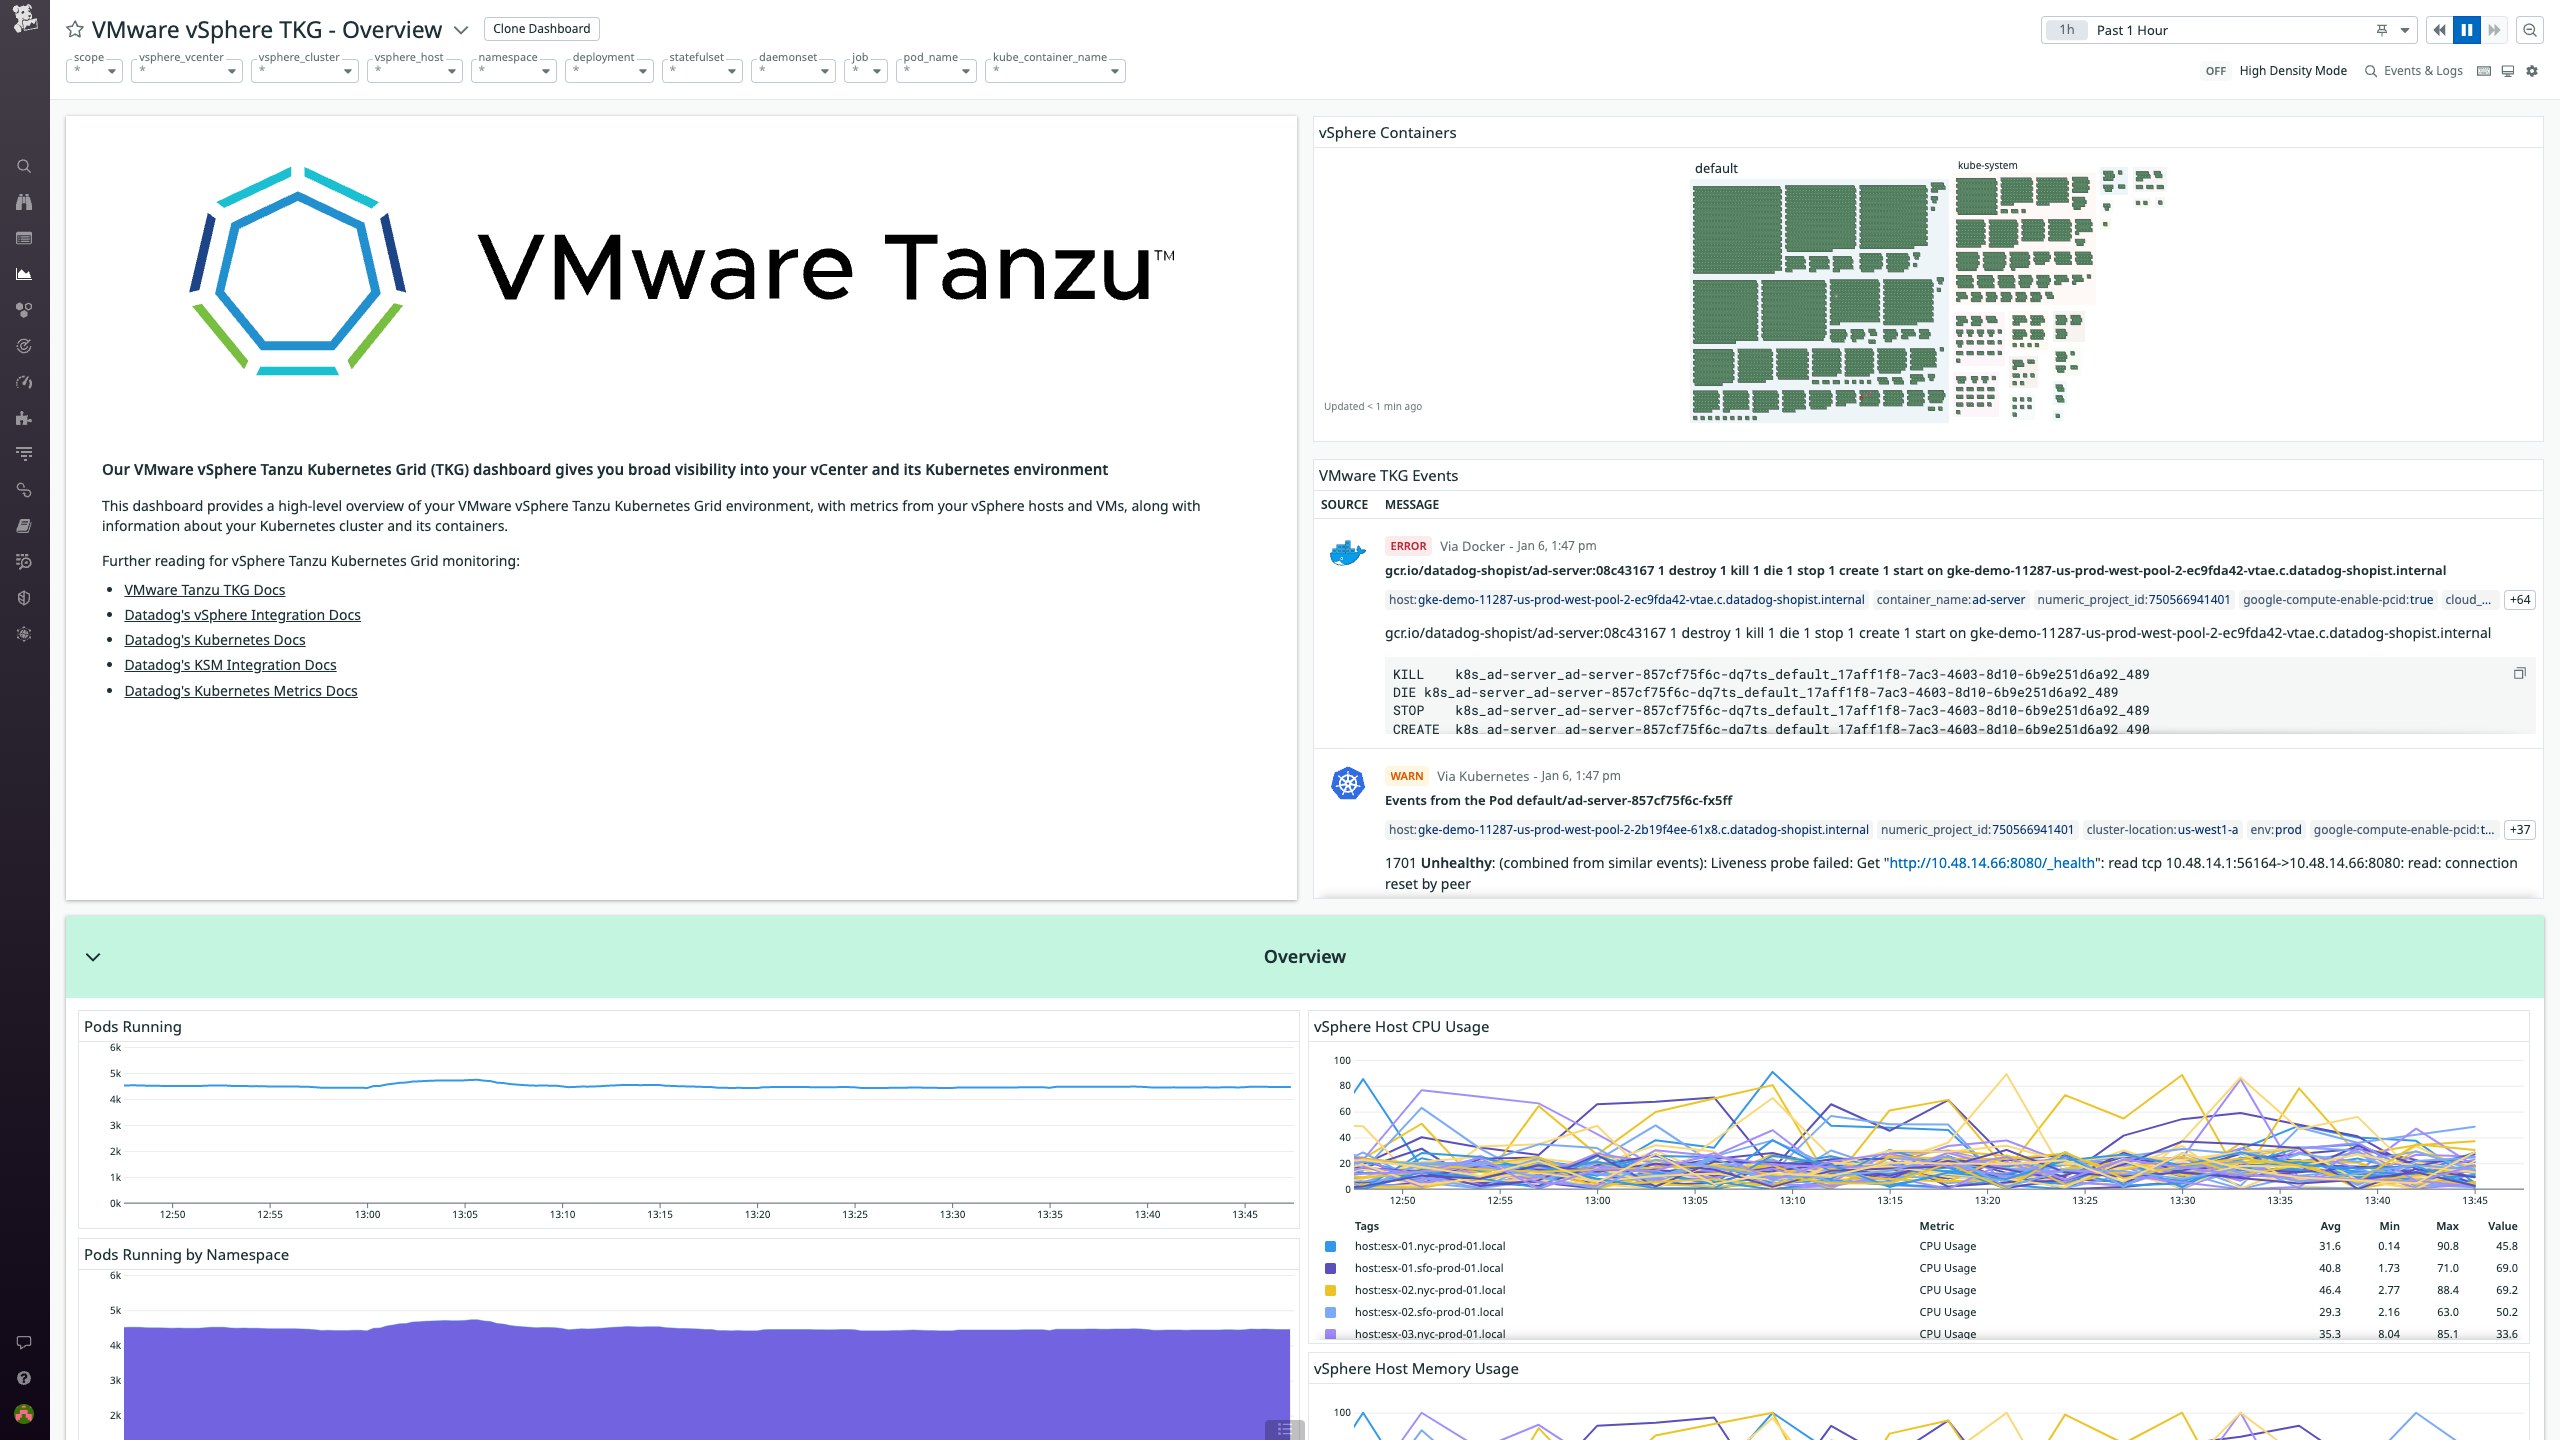
Our new OOTB dashboard, shown below, provides a fine-grained overview of your entire TKG and vSphere environment.

This dashboard foregrounds key data on your TKG clusters and their host VMs via the vSphere Containers map and the TKG event stream. The container map provides a high-level breakdown of your containers by namespace, while the event stream provides an up-to-the-minute record of container activity, highlighting any errors or warnings. You can use template variables to easily adjust the scope of your monitoring by homing in on individual containers, VMs, vCenters, pods, hosts, clusters, and namespaces.
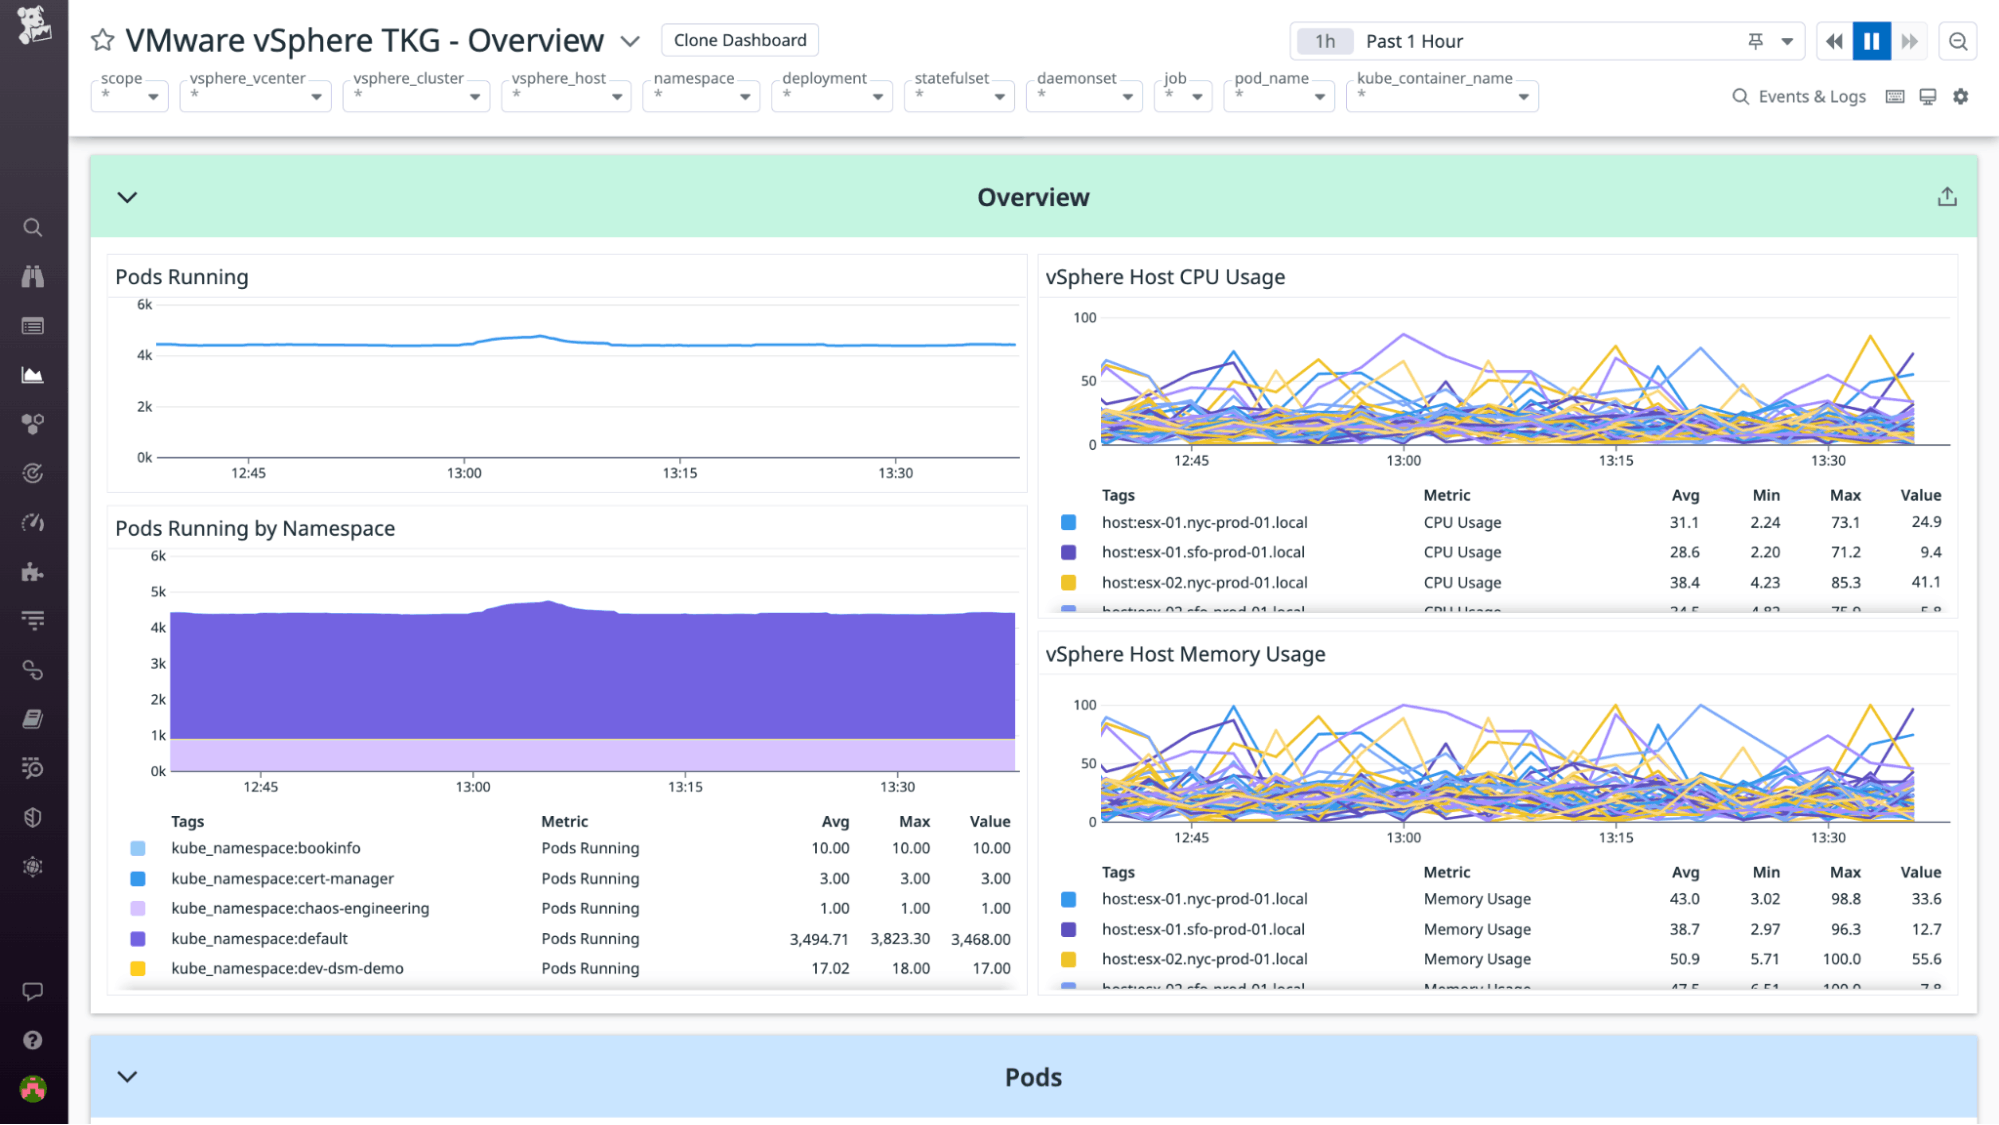
The dashboard Overview panel, shown below, graphs the total number of pods running—both overall and by namespace—as well as the CPU and memory usage of your vSphere hosts. This data can be instrumental in ensuring that your VMs have sufficient resources, providing cues for scaling, as well as highlighting any unexpected dips or spikes in your pods.

Manage and troubleshoot your TKG resources
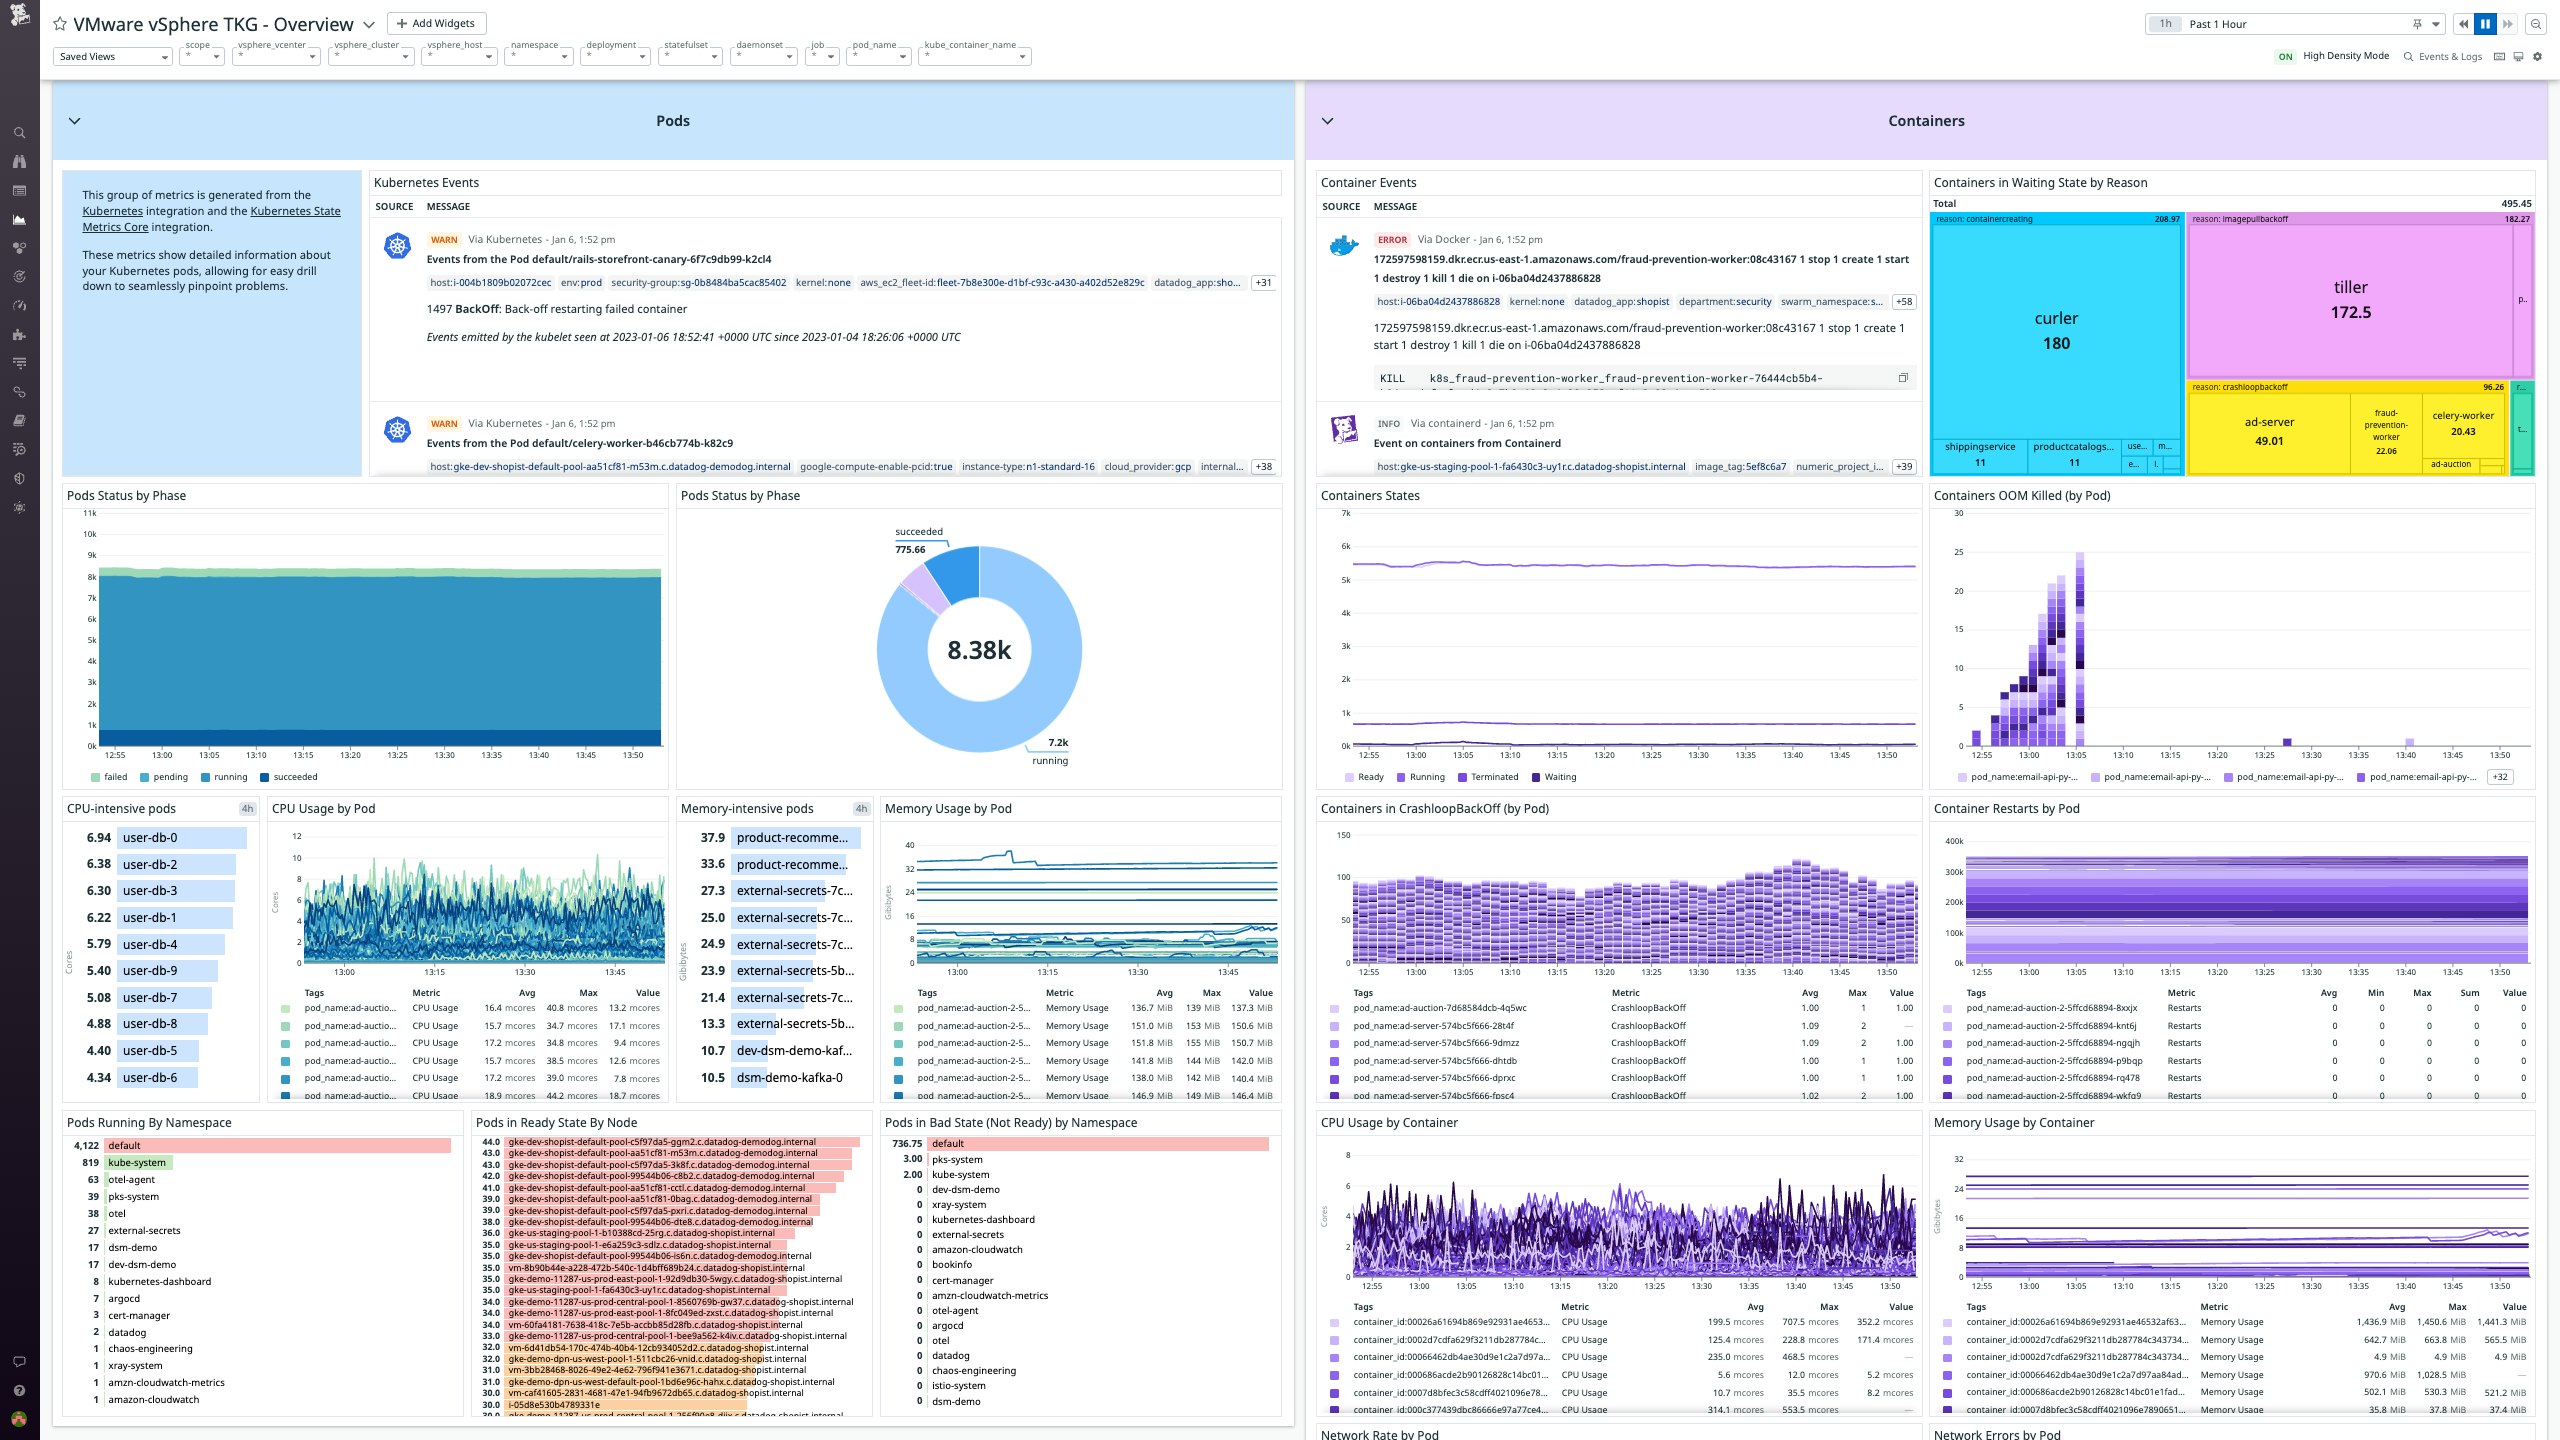
The OOTB dashboard also features dedicated overviews of your TKG pods and containers. These overviews utilize events alongside a broad array of metrics generated from Datadog’s Kubernetes and Kubernetes State Metrics Core integrations so that you can oversee, optimize, and troubleshoot your vSphere environment’s Kubernetes resources in a single pane of glass.

The Pods overview panel provides detailed visibility into the overall status and resource consumption of your pods.
The number of active, failed, and successful pods in a given scope is measured via the kubernetes_state.pod.status_phase metric, providing a high-level breakdown of the health and performance of your overall TKG environment or any subset of it. For a measure of activity by namespace, the kubernetes_state.pod.count and kubernetes_state.pod.ready metrics are used to rank your namespaces both by number of pods running and by number of unavailable pods. The latter metric is also used to measure the number of pods in a Ready state per node.
In order to keep you apprised of any potential strain on your compute resources, the kubernetes.cpu.usage.totaland kubernetes.memory.usage metrics are used to highlight resource-intensive pods, providing visibility that can be critical for pinpointing errors.
The Containers overview offers rich visibility into the states and performance of your TKG containers, providing further angles from which to troubleshoot and optimize performance.
The kubernetes_state.container.status_report.count.waiting metric can highlight potential issues by proportionally mapping the top reasons your containers are Waiting. These can range from ContainerCreating to CrashLoopBackOff states.
The Containers overview also provides several perspectives on the states of your containers as a whole, graphing the total numbers of Ready, Running, Terminated, and Waiting containers in a given scope. To facilitate troubleshooting, this overview also visualizes the number of inoperative or potentially faulty containers per pod via a range of metrics, including:
kubernetes.containers.state.terminated: the number of containersOOMKilled(i.e., terminated due to insufficient memory resources)kubernetes.containers.state.waiting: the number of containers in aCrashLoopBackOffstatekubernetes.containers.restarts: the number of container restarts
The kubernetes.network.rx_bytes, kubernetes.network.tx_bytes, kubernetes.network.rx_errors, and kubernetes.network.tx_errors metrics are used to track the network throughput and error rate of containers by pod.
Finally, for a broader picture of the health and performance of your TKG infrastructure, the kubernetes.cpu.usage.totaland kubernetes.memory.usage metrics are used to graph resource usage by container.
Manage and troubleshoot your vSphere resources
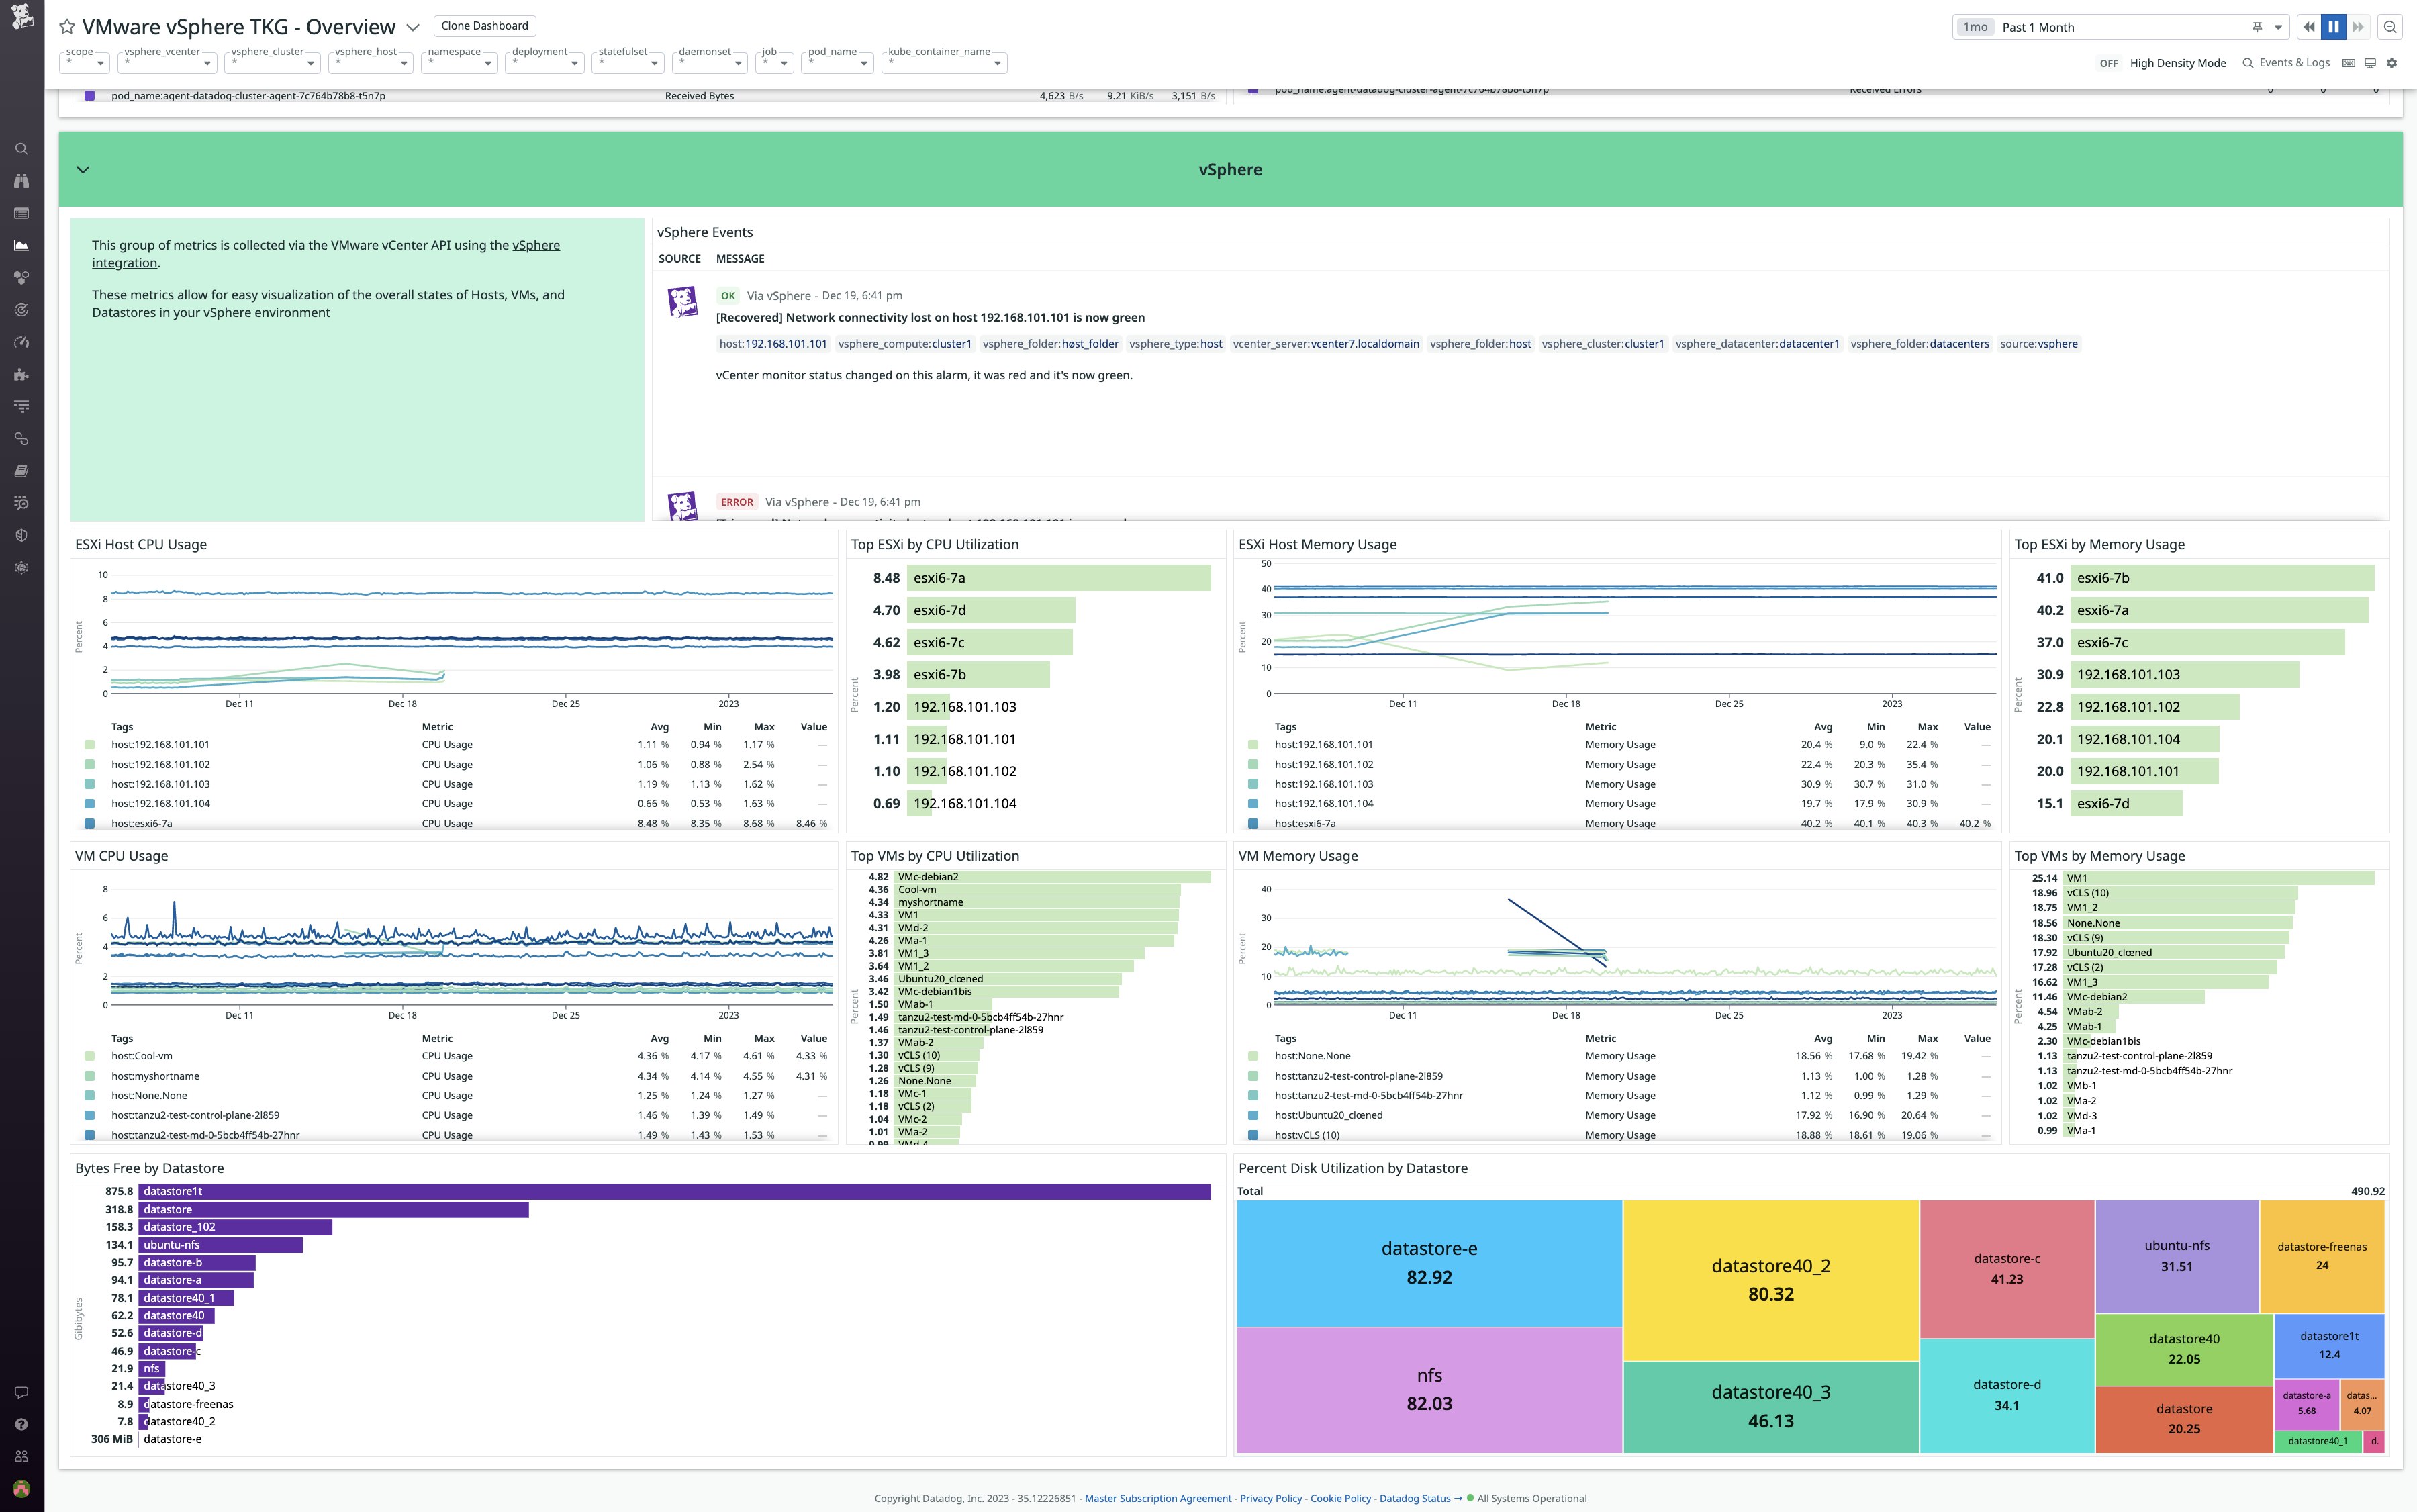
The vSphere overview, shown below, leverages metrics and events to provide critical visibility into the VMs and bare-metal hypervisors that underpin your TKG environment.

The vsphere.cpu.usage.avg and vsphere.mem.usage.avg metrics are used to graph the CPU and memory usage of your VMs and their ESXi hosts, and to highlight those consuming the most resources.
For visibility into your vSphere datastores, the vsphere.disk.capacity.latest metric enables you to assess their available storage space, while the vsphere.disk.used.latest and vsphere.disk.capacity.latest metrics provide a clear picture of their disk utilization.
By correlating these metrics with vSphere events, as well as Kubernetes metrics and events from your TKG clusters, you can stay on top of errors and make the most of your usage of TKG on vSphere.
Optimize and troubleshoot TKG on vSphere
Our new OOTB dashboard and base configurations for Datadog’s vSphere integration enable you to quickly start monitoring your TKG clusters and their underlying vSphere VMs. They provide you with the real-time insights you need in order to continuously optimize your organization’s virtualized and containerized resources and rapidly troubleshoot issues with the aid of event and log tracking. Check out our documentation to get started. If you’re brand-new to Datadog, sign up for a 14-day free trial today.


