
Kai Xin Tai

David M. Lentz
Editor’s note: Vault uses the term "master" to describe the key used to encrypt your keyring. Datadog does not use this term, and within this blog post, we will refer instead to the "main" key.
HashiCorp Vault is a tool for managing, storing, and securing access to secrets, such as encryption keys, credentials, certificates, and tokens. Since it was released in 2015, Vault's user base has grown to include organizations like Adobe, Hulu, and Shopify. With Vault, security operators can encrypt all of their secrets, distribute them across hybrid environments, apply fine-grained access controls, and audit activity to see who has requested data. Built to operate in zero-trust networks, Vault takes an application identity-centric approach, meaning that it authenticates clients against trusted sources of identity (e.g., Google Cloud, GitHub, Okta) before granting them access to data. Teams can deploy Vault on platforms like Kubernetes and AWS to streamline secret management operations across their entire stack or take advantage of HashiCorp Cloud Platform's fully managed products.
Keeping your Vault clusters healthy is vital for protecting your applications and infrastructure against potential attacks. And since secrets control the communication between services, slowdowns in authorization at any point will impact the performance of downstream clients. In this post, we will discuss how you can gain visibility into the health and performance of your Vault deployment with metrics and logs.
Securing secrets in a distributed world
From a security standpoint, migrating on-premise, legacy infrastructures to dynamic, multi-cloud environments requires a paradigm shift. Traditional security models focused on securing a perimeter which divided the internal, privately managed side of a network from the external, public side. Since organizations primarily operated on static, on-premise infrastructure, they could use IP addresses to secure this boundary. In this approach, users and devices within the perimeter were trusted and those outside were untrusted. However, once a bad actor infiltrated the network, it could move laterally within the network to obtain more sensitive information.
Today, organizations are increasingly running their workloads on ephemeral resources—and distributing them across public, private, and hybrid clouds. With dynamic IP addresses—and no clear network boundaries—the traditional, perimeter-based security model is no longer effective. And managing access to secrets across hundreds or even thousands of distributed services becomes an operational challenge. Organizations might find themselves with plaintext passwords hardcoded in source code, API tokens listed in internal wikis, and other sensitive information sprawled across disparate systems. Not only does this open up more points of entry for malicious actors to gain access to your sensitive data, but once they are authenticated, they appear as valid users and can go undetected for long periods of time.
To combat this, Vault provides a single source of truth for all secrets and supports the dynamic generation, rotation, and revocation of client credentials—all while maintaining a detailed audit trail. Rather than focusing on securing the internal network from the external, Vault assumes that all traffic is untrusted until the identity of the client can be verified.
How Vault works
Before proceeding any further, let's take a closer look at a general implementation of Vault to better understand what we should be monitoring. The following diagram illustrates the main components that make up a Vault server, and how they work together to route requests and authenticate clients. A collection of servers that work together to run a Vault service is known as a cluster.
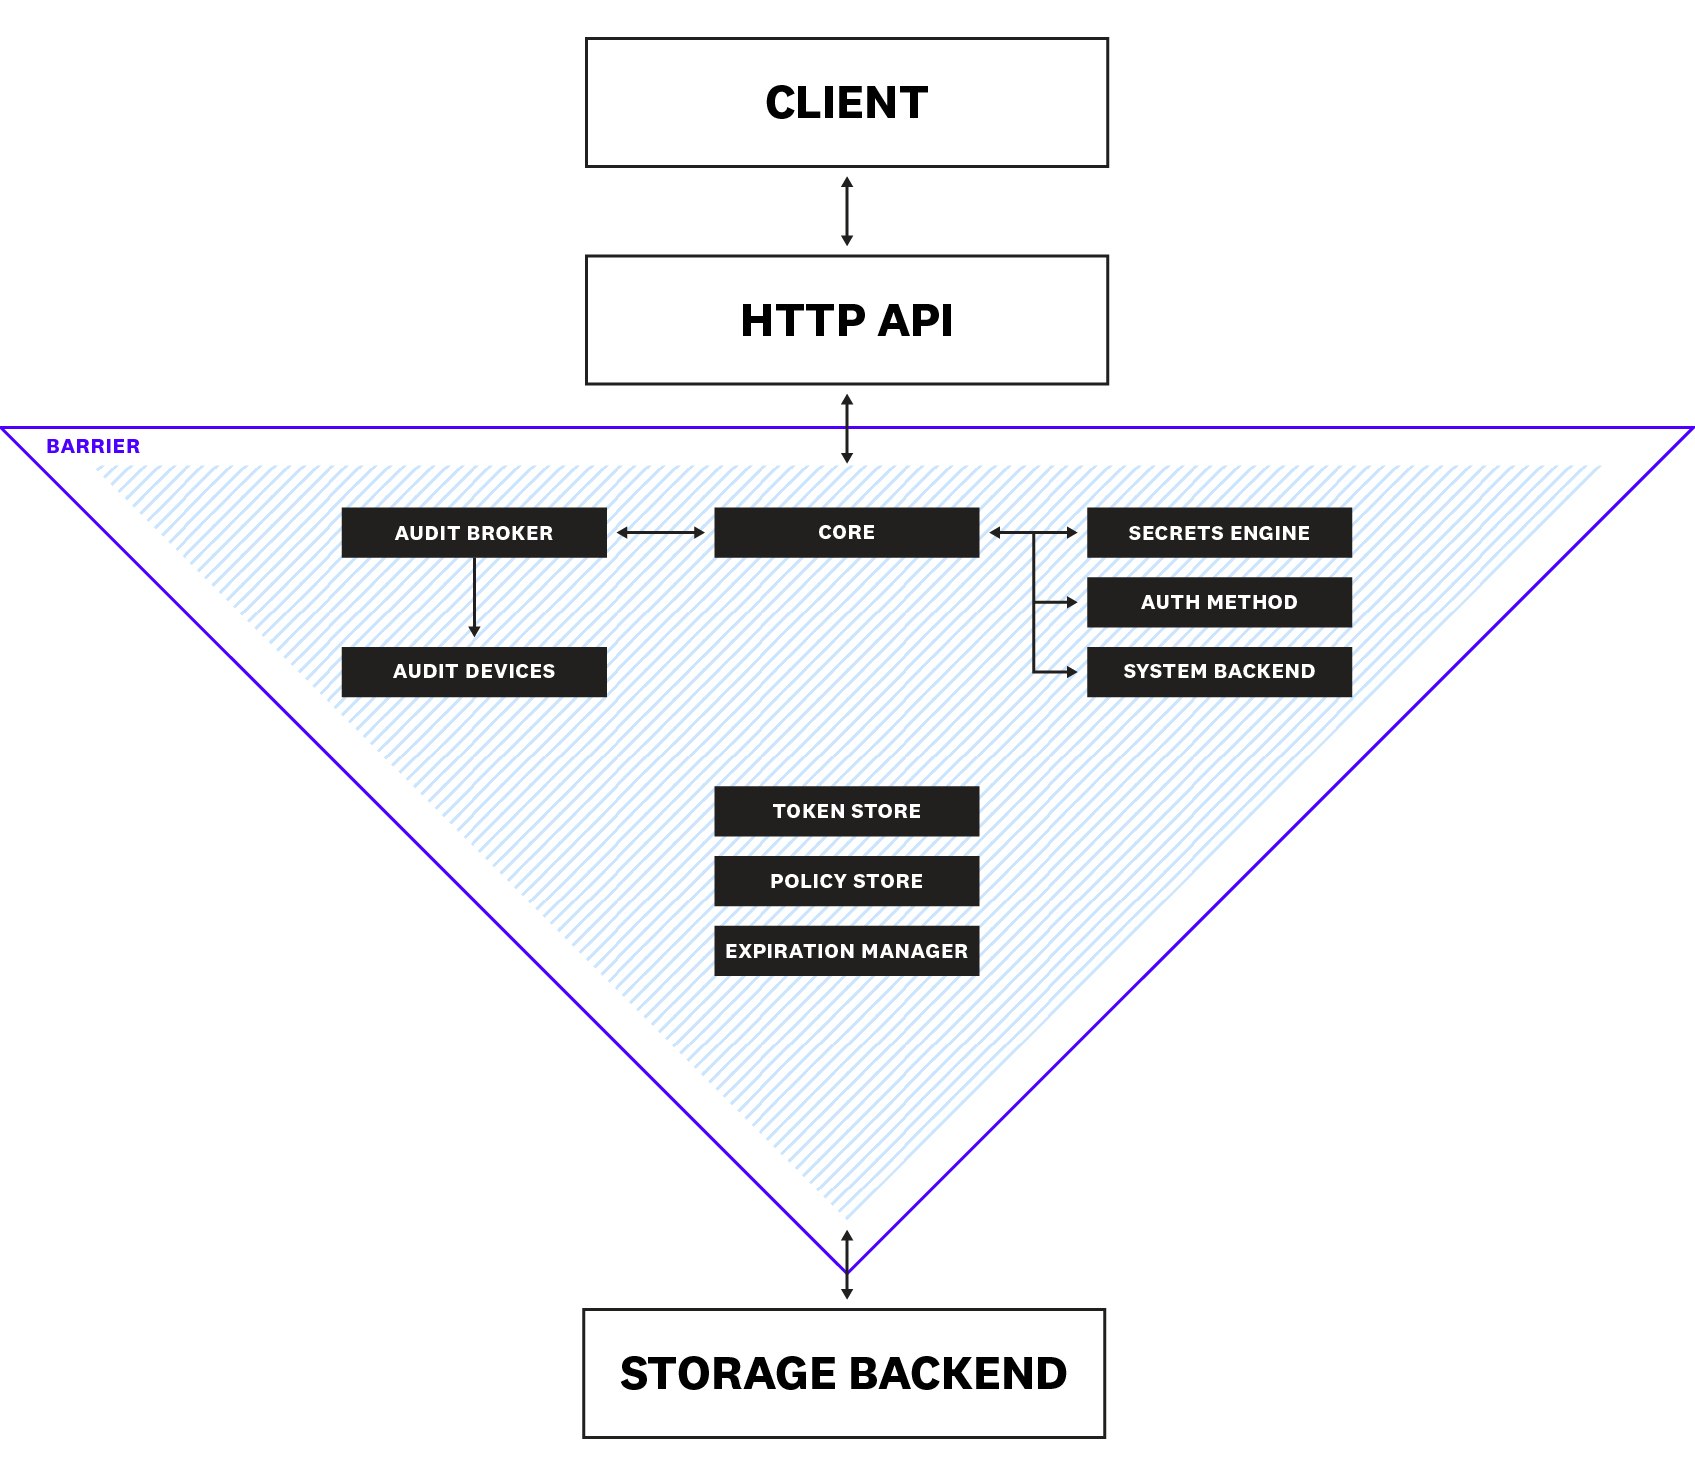
During the initialization of a server, Vault uses an encryption key to encrypt all of its data and enters a sealed state. When sealed, all client requests to the server are rejected. The encryption key is secured by a main key, which itself is secured by an unseal key. Following Shamir's secret sharing algorithm, Vault splits the unseal key into parts. Unsealing involves first reconstructing the unseal key by obtaining a minimum number of parts, then using the unseal key to decrypt the main key. Next, the main key is used to decrypt the encryption key. Once Vault obtains the encryption key, it enters an unsealed state.
Clients (users or applications) interact with Vault via an HTTP API. Before a client is able to access any secrets, it needs to authenticate to prove that it is a legitimate recipient of the requested data. When Vault receives a request for authentication, it first routes it to the core, which is responsible for coordinating the flow of requests throughout the system, enforcing access control lists (ACLs), and ensuring that audit logging is performed. The system backend is mounted by default at /sys and used to interact with the core for server configuration activities as well as various other operations (e.g., managing secrets engines, configuring policies, handling leases), which we will explain shortly.
From the core, the request is passed to an authentication method, such as GitHub, AppRole, or LDAP, which determines the validity of the request. If the client's credentials are deemed to be valid, the authentication method returns information about the client (e.g., privilege group membership), which Vault then uses to map to policies created by the organization's security operators. These policies, which are managed by the policy store, form the basis of role-based access control as they specify the types of capabilities that are allowed on paths (where secrets are stored in Vault). The following example policy enables read and delete capabilities for the path secret/example:
path "secret/example" { capabilities = ["read", "delete"]}If a client can be authenticated, the token store issues the client a token that contains the correct policies to authorize its future requests. Otherwise, Vault keeps the client logged out. When a client makes a request using its token, the request is sent to the secrets engine to be processed. One example of a secrets engine is a simple key-value (KV) store, like Redis or Memcached, that returns static secrets. Other engines, like AWS and SSH, can dynamically generate secrets on demand. For most dynamic secrets, the expiration manager attaches a lease that states the secret's valid duration.
For durability, Vault persists its data to a storage backend (e.g., Consul, Amazon S3, Azure). But since this storage backend is not trusted, the Vault's barrier safeguards its communication with the backend against eavesdropping and tampering by ensuring that data is encrypted by a secrets engine before leaving the Vault. Similarly, the barrier ensures that secrets get decrypted as they pass into the Vault, in order to make them readable by the other components.
Lastly, all client interactions with Vault—requests and responses—pass through an audit device, which records a detailed audit log, allowing operators to see who has accessed their sensitive data.
Key metrics for Vault monitoring
Now that we've covered the general architecture of Vault, let's take a look at the key metrics you should monitor to understand how your Vault cluster is performing. More specifically, we will dive into the following categories of metrics:
- Core metrics
- Vault usage metrics
- Storage backend metrics
- Audit device metrics
- Resource usage metrics
- Replication metrics
We’ll look at how to use built-in Vault monitoring tools to view these metrics in the next part of this series. We'll then show you in Part 3 how Datadog can help you comprehensively monitor and visualize Vault metrics and logs, alongside the 850+ other services you might also be running.
Vault collects performance and runtime metrics every 10 seconds and retains them in memory for one minute. By default, Vault applies aggregations to in-memory metrics, including count, mean, max, stddev, and sum, to measure statistical distributions across an entire cluster. In the next few sections, we'll describe key Vault metrics and recommend an aggregation that you should use to monitor each of these metrics. Note that the availability of these aggregations depends on whether or not they are supported by the metrics sink you have configured.
Throughout this article, we'll follow metric terminology from our Monitoring 101 series, which provides a framework for metric collection, alerting, and issue investigation.
Core metrics
| Name | Description | Metric type | Recommended aggregation |
|---|---|---|---|
vault.core.leadership_lost | Amount of time a server was the leader before losing its leadership in a Vault cluster in high availability mode (ms) | Other | Mean |
vault.core.leadership_setup_failed | Time taken by cluster leadership setup failures in a Vault cluster in high availability mode (ms) | Other | Mean |
vault.core.handle_login_request | Time taken by the Vault core to handle login requests (ms) | Work: Performance | Mean |
vault.core.handle_request | Number of requests handled by the Vault core | Work: Throughput | Count |
vault.core.post_unseal | Time taken by the Vault core to handle post-unseal operations (ms) | Other | Mean |
Metrics to alert on: vault.core.leadership_lost, vault.core.leadership_setup_failed
Any Vault cluster configured to operate in high availability mode has one active leader server and at least one standby server. Standby servers remain in an unsealed state so that they can serve requests if the leader goes down. The diagram below shows a highly available Vault cluster made up of three Vault servers and a cluster of five Consul servers (the storage backend in this example). The leader handles all read and write requests, while standbys simply forward any requests to the leader. The Consul client agents that run on the Vault servers communicate with the cluster of Consul servers to perform various tasks, such as registering health checks, discovering services, and coordinating failovers. In the event that the leader fails, a standby will become the new leader if it can successfully obtain a leader election lock from the storage backend for write access.
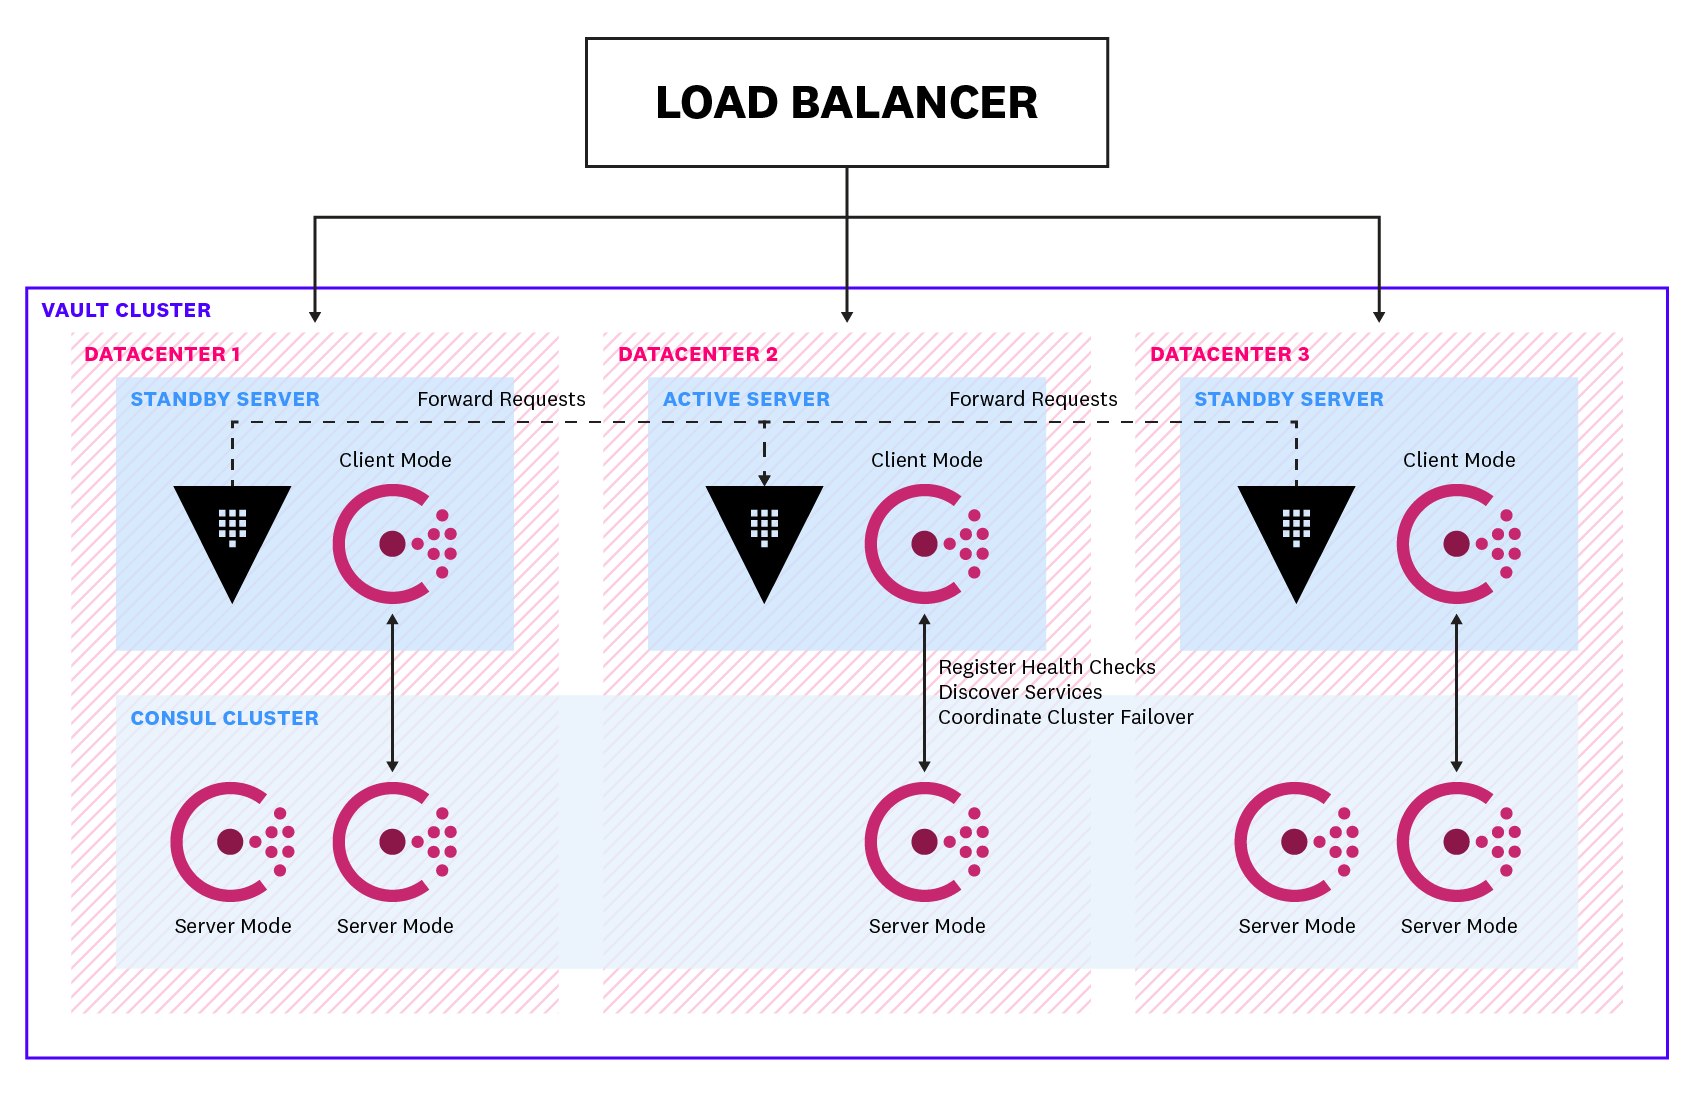
Generally, leadership transitions in a Vault cluster should be infrequent. Vault provides two metrics that are helpful for tracking leadership changes in your cluster: vault.core.leadership_lost, which measures the amount of time a server was the leader before it lost its leadership, and vault.core.leadership_setup_failed, which measures the time taken by cluster leadership setup failures.
A consistently low vault.core.leadership_lost value is indicative of high leadership turnover and overall cluster instability. Spikes in vault.core.leadership_setup_failed indicate that your standby servers are failing to take over as the leader, which is something you'll want to look into right away (e.g., was there an issue acquiring the leader election lock?). Both of these metrics are important to alert on as they can indicate a security risk. For instance, there might be a communication issue between Vault and its storage backend, or a larger outage that is causing all of your Vault servers to fail.
Metrics to watch: vault.core.handle_login_request, vault.core.handle_request
Vault leverages trusted sources of identity (e.g., Kubernetes, Active Directory, Okta) to authenticate clients (e.g., a user or a service) before allowing them to access any secrets. To authenticate, clients make a login request via the vault login command or the API. If the authentication is successful, Vault issues a token to the client, which is then cached on the client's local machine, to authorize its subsequent requests. As long as a client provides an unexpired token (i.e., one whose TTL has not run out), Vault considers the client to be authenticated.
The vault.core.handle_login_request metric (using the mean aggregation) gives you a measure of how quickly Vault is responding to incoming client login requests. If you observe a spike in this metric but little to no increase in the number of tokens issued (vault.token.creation), you will want to immediately examine the cause of this issue. If clients can’t authenticate to Vault quickly, they may be slow in responding to the requests they receive, increasing the latency in your application.
vault.core.handle_request is another good metric to track, as it can give you a sense of how much work your server is performing—and whether you need to scale up your cluster to accommodate increases in traffic levels. Or, if you observe a sudden dip in throughput, it might indicate connectivity issues between Vault and its clients, which warrants further investigation.

Metric to watch: vault.core.post_unseal
At any given point, Vault servers are either sealed or unsealed. As you might recall from earlier, storage backends are not trusted by Vault, so they only store encrypted data. When Vault starts up, it undergoes an unsealing process to decrypt data from the storage backend and make it readable again. Immediately following the unseal process, Vault executes a number of post-unseal operations to properly set up the server before it can begin responding to requests.
Unexpected spikes in the vault.core.post_unseal metric can alert you to problems during the post-unseal process that affect the availability of your server. You should consult your Vault server logs to gather more details about potential causes, such as issues mounting a custom plugin backend or setting up auditing.
Usage metrics
| Name | Description | Metric type | Recommended aggregation |
|---|---|---|---|
vault.token.creation | Number of tokens created | Other | Count |
vault.expire.num_leases | Number of all leases which are eligible for eventual expiry | Other | Count |
vault.expire.revoke | Time taken to revoke a token (ms) | Work: Performance | Mean |
vault.expire.renew | Time taken to renew a lease (ms) | Work: Performance | Mean |
Metric to watch: vault.token.creation
Authentication in Vault happens primarily through the use of tokens. Tokens are associated with policies that control the paths a user can access and the operations a user can perform. Vault issues two types of tokens: service tokens and batch tokens. Service tokens support a robust range of features, but carry more overhead. In contrast, batch tokens are not as versatile (e.g., they cannot be renewed), but they are extremely lightweight and do not take up space on disk.
Monitoring the volume of token creation (vault.token.creation) together with the login request traffic (vault.core.handle_login_request aggregated as a count) can help you understand how busy your system is overall. If your use case involves running many short-lived processes (e.g., serverless workloads), you might have hundreds or thousands of functions spinning up and requesting secrets at once. In this case, you'll see correlated spikes in both metrics.
When working with ephemeral workloads, you might want to consider increasing the use of batch tokens to optimize the performance of your cluster. To create a batch token, Vault encrypts all of a client's information and hands it to the client. When the client uses this token, Vault decrypts the stored metadata and responds to the request. Unlike service tokens, batch tokens do not persist client information—nor are they replicated across clusters—which helps reduce pressure on the storage backend and improve cluster performance.

Metric to watch: vault.expire.num_leases
When Vault generates a dynamic secret or service token, it creates a lease that contains metadata such as its time to live (TTL) and whether it can be renewed, and stores this lease in its storage backend. Unless a lease gets renewed before hitting its TTL, it will expire and be revoked along with its corresponding secret or token. Monitoring the current number of Vault leases (vault.expire.num_leases) can help you spot trends in the overall level of activity of your Vault server. A rise in this metric could signal a spike in traffic to your application, whereas an unexpected drop could mean that Vault is unable to access dynamic secrets quickly enough to serve the incoming traffic.
Additionally, Vault recommends setting the shortest possible TTL on your leases for two main reasons: enhanced security and performance. Firstly, configuring a shorter TTL for your secrets can help minimize the impact of an attack. Secondly, you'll want to ensure that your leases don't grow uncontrollably and fill up your storage backend. If you do not explicitly specify a TTL for a lease, it automatically defaults to 32 days. And if there is a load increase and leases are rapidly generated with this long default TTL, the storage backend can quickly hit its maximum capacity and crash, rendering it unavailable.
Depending on your use case, you might only need to use a token for a few minutes or hours, rather than the full 32 days. Setting an appropriate TTL frees up storage space such that new secrets and tokens can be stored. If you're using Vault Enterprise, you can set a lease count quota to keep the number of leases generated under a specific threshold (max_leases). When this threshold is reached, Vault will restrict new leases from being created until a current lease expires or is revoked.
Metrics to watch: vault.expire.revoke, vault.expire.renew
Vault automatically revokes the lease on a token or dynamic secret when its TTL is up. You can also manually revoke a lease if your security monitoring indicates a potential intrusion. When a lease is revoked, the data in the associated object is invalidated and its secret can no longer be used. A lease can also be renewed before its TTL is up if you want to continue retaining the secret or token.
Since revocation and renewal are important to the validity and accessibility of secrets, you'll want to track that these operations are completed in a timely manner. Additionally, if secrets are not properly revoked—and attackers gain access to them—they can infiltrate your system and cause damage. If you're seeing long revocation times, you'll want to dig into your server logs to see if there was a backend issue that prevented revocation.
Storage backend metrics
| Name | Description | Metric type | Recommended aggregation |
|---|---|---|---|
vault.\<STORAGE\>.get | Duration of a get operation against the storage backend (ms) | Work: Performance | Mean |
vault.\<STORAGE\>.put | Duration of a put operation against the storage backend (ms) | Work: Performance | Mean |
vault.\<STORAGE\>.list | Duration of a list operation against the storage backend (ms) | Work: Performance | Mean |
vault.\<STORAGE\>.delete | Duration of a delete operation against the storage backend (ms) | Work: Performance | Mean |
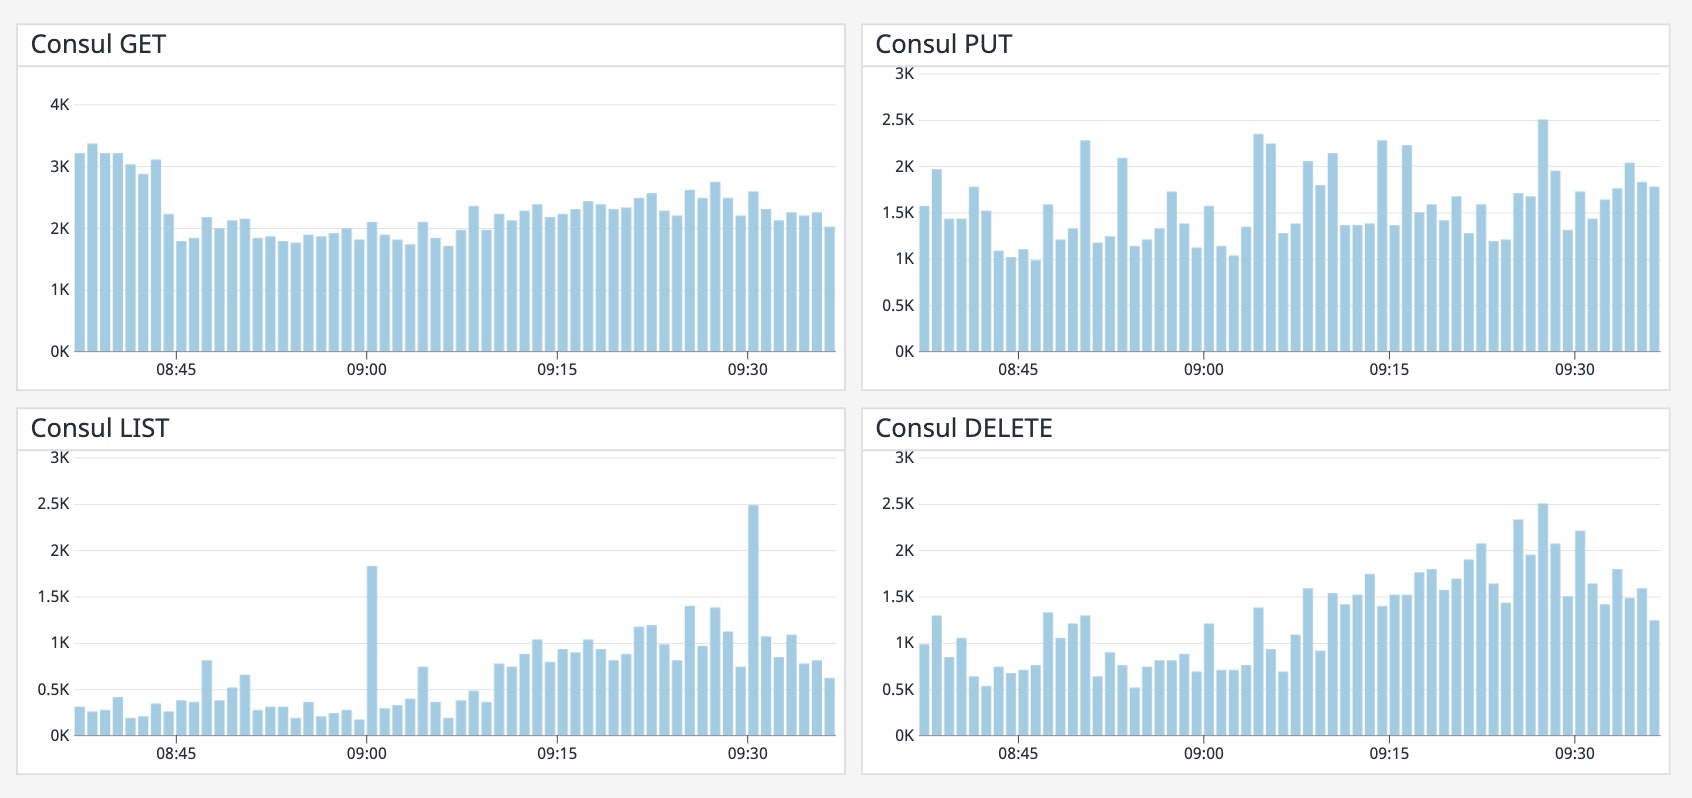
Vault supports several storage backends (e.g., etcd, Amazon S3, Cassandra) for storing encrypted data. As of version 1.4, Vault also provides an integrated storage solution based on the Raft protocol. In the metric names above, <STORAGE> should be replaced with the name of your configured storage backend. For instance, the metric tracking the duration of a GET request to Consul is vault.consul.get.
Metrics to alert on: vault.<STORAGE>.get, vault.<STORAGE>.put, vault.<STORAGE>.list, vault.<STORAGE>.delete
Regardless of which backend you're using, it’s important to track its performance so you know that your storage infrastructure is properly resourced and performing well. If Vault is spending more time accessing the backend to get, put, list, or delete items, it indicates that your users could be experiencing latency due to storage bottlenecks. You can create alerts to automatically notify your team if Vault’s access to the storage backend is slowing down. This can give you a chance to remediate the problem—for example, by moving to disks with higher I/O throughput—before rising latency affects the experience of your application’s users.
Audit device metrics
| Name | Description | Metric type | Recommended aggregation |
|---|---|---|---|
vault.audit.log_request_failure | Number of audit log request failures | Work: Error | Count |
vault.audit.log_response_failure | Number of audit log response failures | Work: Error | Count |
Metrics to alert on: vault.audit.log_request_failure, vault.audit.log_response_failure
Audit devices record a detailed audit log of requests and responses from Vault, helping organizations meet their compliance requirements. Vault will only respond to client requests if at least one audit device is enabled and can persist logs. If you are only using one audit device and it becomes blocked due to a drop in network connectivity or an issue with permissions, for instance, Vault becomes unresponsive and stops responding to requests. Therefore, you'll want to keep an eye out for any anomalous spikes in audit log request failures (vault.audit.log_request_failure) and response failures (vault.audit.log_response_failure) as they can indicate blocking on a device. If this occurs, inspecting your audit logs in more detail can help you identify the path to the problematic device and provide other clues as to where the issue lies. For instance, when Vault fails to write audit logs to syslog, the server will publish error logs like these:
2020-10-20T12:34:56.290Z [ERROR] audit: backend failed to log response: backend=syslog/ error="write unixgram @->/test/log: write: message too long"2020-10-20T12:34:56.291Z [ERROR] core: failed to audit response: request_path=sys/mounts error="1 error occurred: * no audit backend succeeded in logging the responseYou should expect to see a pair of errors from the audit and core for each failed log response. Receiving an error message that contains write: message too long indicates that the entries that Vault is attempting to write to the syslog audit device are larger than the size of the syslog host's socket send buffer. You'll want to then dig into what's causing the large log entries, such as having an extensive list of Active Directory or LDAP groups.
Resource metrics
| Name | Description | Metric type | Recommended aggregation |
|---|---|---|---|
vault.runtime.gc_pause_ns | Duration of the last garbage collection run (ns) | Resource: Utilization | Mean |
vault.runtime.sys_bytes | Amount of memory allocated to the Vault process (bytes) | Resource: Utilization | Count |
| CPU I/O wait time | Percentage of time the CPU spends waiting for I/O operations to complete | Resource: Utilization | Mean |
| Network traffic to Vault | Number of bytes received by a block device | Resource: Utilization | Count |
| Network traffic from Vault | Number of bytes sent from a block device | Resource: Utilization | Count |
Metrics to alert on: vault.runtime.gc_pause_ns, vault.runtime.sys_bytes
During garbage collection, all operations are paused. While these pauses typically only last for very short periods of time, high memory usage may trigger more frequent garbage collection in the Go runtime, thereby increasing the latency of Vault. Therefore, correlating Vault's memory usage (vault.runtime.sys_bytes as a percentage of total available memory on the host) with garbage collection pause time (vault.runtime.gc_pause_ns) can inform you of resource bottlenecks and help you more properly provision compute resources.
For example, if vault.runtime.sys_bytes rises above 90 percent of available memory on the host, you should consider adding more memory before you experience performance degradations. Vault also recommends setting an alert to notify you if the GC pause time increases above 5 seconds/minute so that you can swiftly take action.

Metric to watch: CPU I/O wait time
Although Vault was built with scalability in mind, you'll still want to monitor how long the CPU spends waiting for I/O operations to complete. As a recommendation, you should ensure your I/O wait time stays below 10 percent. If you are seeing excessive wait times, it means that clients are spending a long time waiting for Vault to respond to requests, which can degrade the performance of the applications that depend on Vault. In this case, you'll want to check if your resources are configured appropriately to handle your workload—and if requests are evenly distributed across all CPUs.
Metrics to watch: Network bytes received, network bytes sent
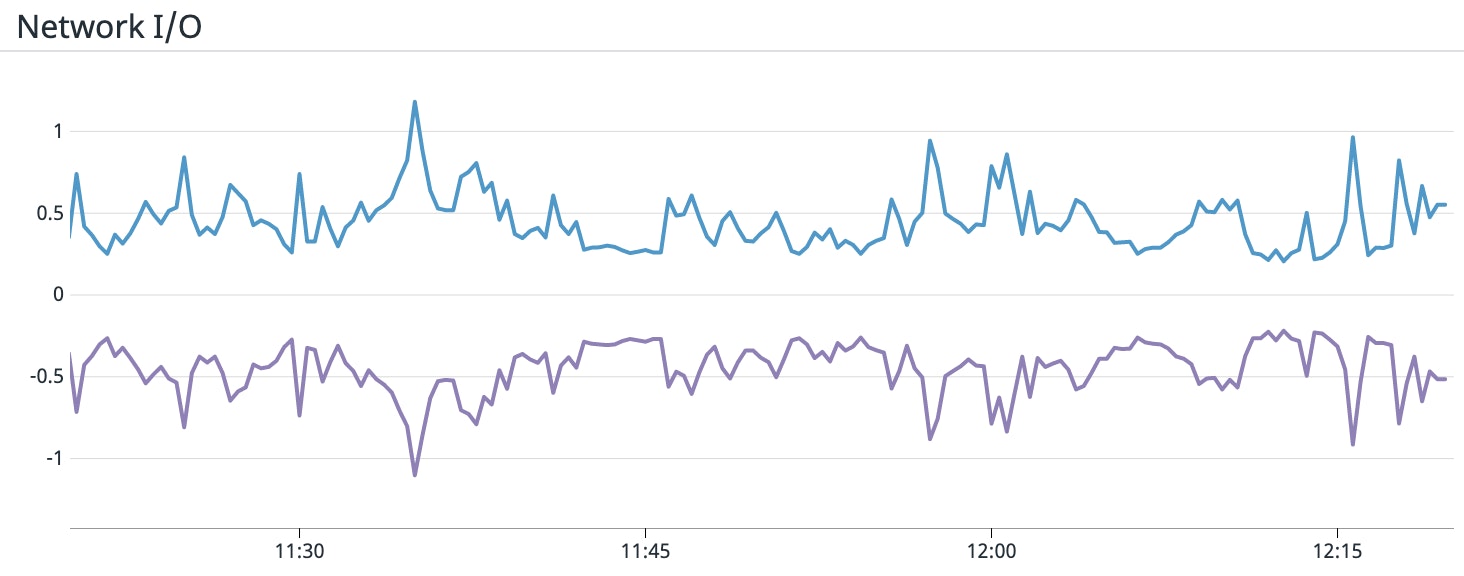
Tracking network throughput in and out of your Vault clusters can give you a sense of how much work they're performing. A sudden drop in traffic in either direction could be a sign of communication issues between Vault and its clients and dependencies. Or, if you notice an unexpected spike in network activity, it could be indicative of an attempt at a distributed denial of service (DDoS) attack.
As of Vault 1.5, you can specify rate limit quotas to maintain the overall health and stability of Vault. Once a server hits this threshold, Vault will start rejecting any subsequent client requests by throwing a HTTP 429 error, "Too Many Requests." Rejected requests will appear in your audit logs with the message error: request path kv/app/test: rate limit quota exceeded. You'll want to set this limit appropriately such that it does not block legitimate requests and slow down your applications. You can monitor the quota.rate_limit.violation metric, which increments with each rate limit quota violation, to see how often these breaches are occurring and tune your limit accordingly.
Replication metrics
A Vault cluster can be designated as either primary or secondary when replication is enabled. Primary clusters have write access to storage backends so they are able to make changes to policies and secrets. Secondary clusters, on the other hand, can only read from storage and will need to forward any write requests to the primary cluster.
Vault supports two forms of replication: performance and disaster recovery. Performance replication allows organizations to horizontally scale up their operations by distributing their workload across multiple clusters. Disaster recovery replication reduces the risk of a major outage by maintaining a backup cluster that can immediately take over if the primary cluster fails. The diagram below illustrates a Vault deployment across three datacenters and the relationships between replicated clusters.
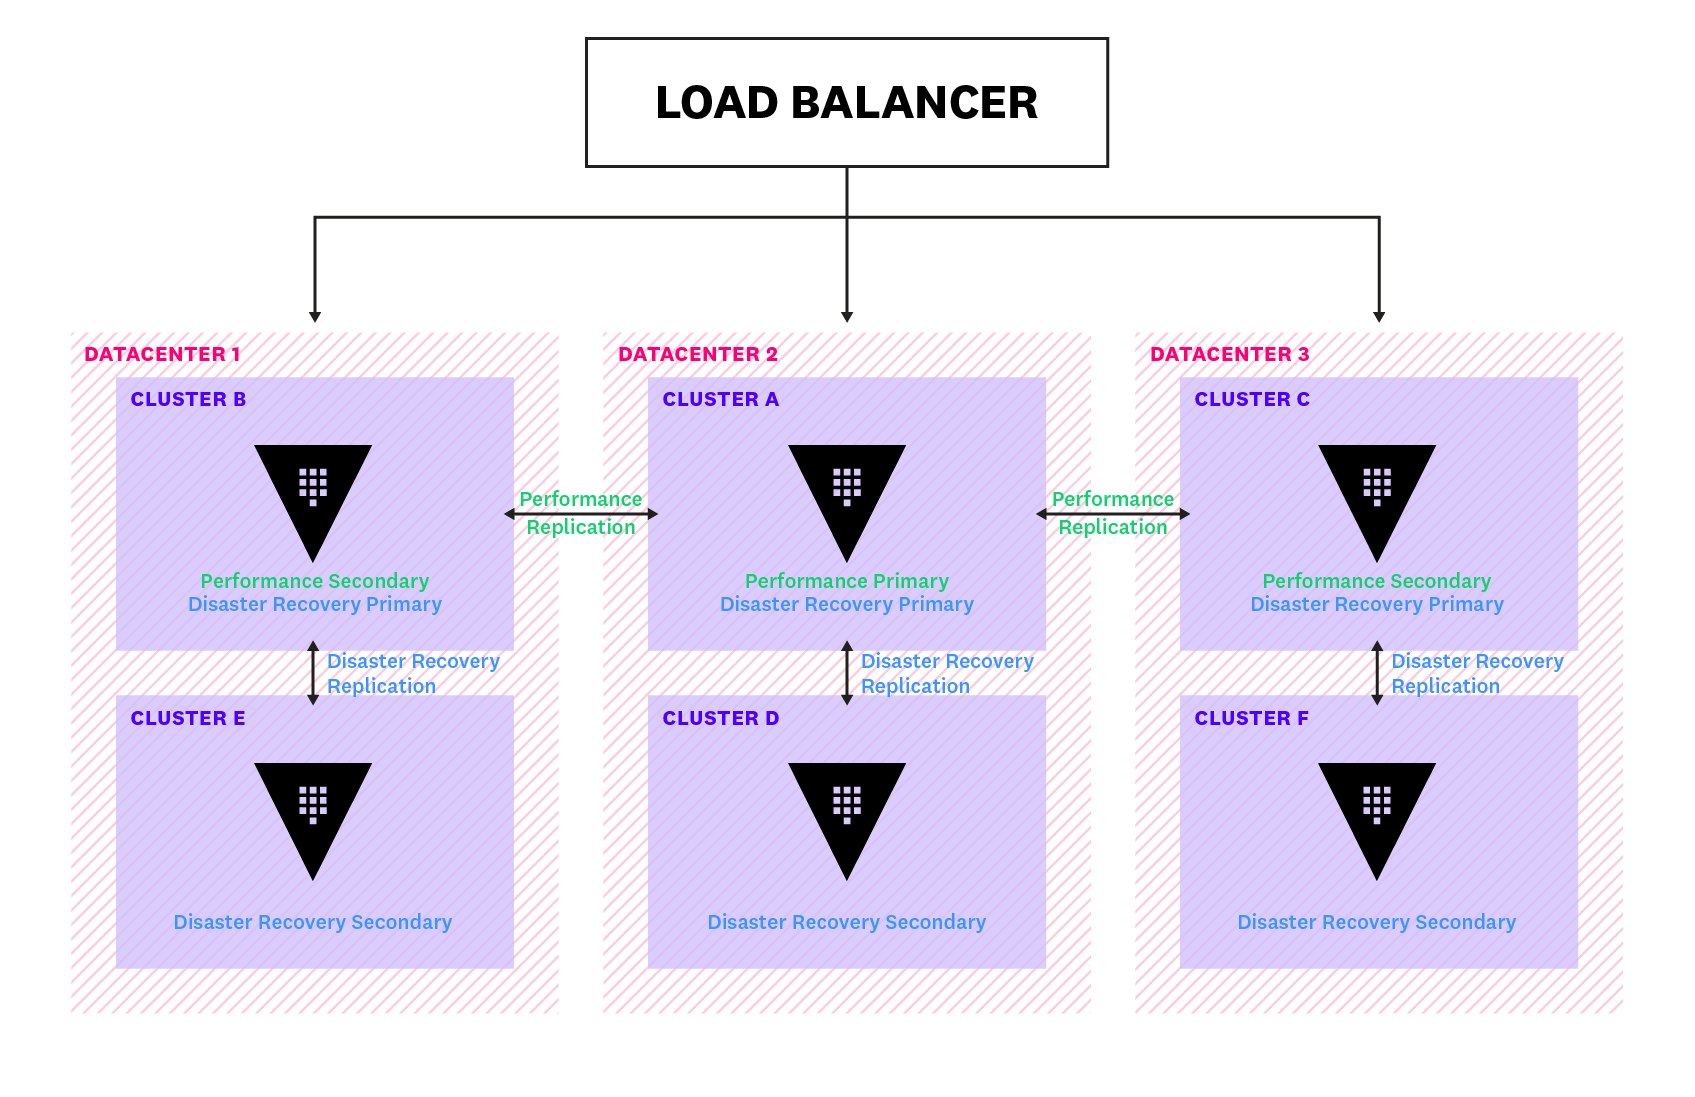
To keep data across clusters in sync, Vault ships Write-Ahead Logs (WALs) of all updates on its primary cluster over to its secondary clusters. Vault limits the number of WALs it keeps for its secondaries by periodically cleaning up older entries. This means that if a secondary cluster falls too far behind the primary, there might be insufficient WALs to keep them in sync. Vault also maintains a merkle index of the encrypted keys and uses it in situations like these to synchronize with the primary cluster, before reverting back to WAL streaming.
| Name | Description | Metric type | Recommended aggregation |
|---|---|---|---|
vault.wal.flushready | Time taken to flush a ready WAL to the persist queue (ms) | Work: Performance | Mean |
vault.wal.persistWALs | Time taken to persist a WAL to the storage backend (ms) | Work: Performance | Mean |
vault.replication.wal.last_wal | Index of the last WAL | Other | Count |
Metrics to alert on: vault.wal.flushready, vault.wal.persistWALs
To ensure Vault has sufficient resources to maintain high performance, a garbage collector removes old WALs every few seconds to reclaim memory on the storage backend. Unexpected spikes in traffic can cause WALs to quickly accumulate, increasing the pressure on your storage backend. Since this can impact other Vault processes that also depend on the storage backend, you'll want to get a sense of how replication is affecting your storage backend's performance.
You can start by monitoring two metrics: vault.wal_flushready, which records the time taken to flush a ready WAL to the persist queue, and vault.wal.persistWALs, which measures the time taken to persist a WAL to the storage backend. You should create alerts that notify you when vault.wal_flushready exceeds 500 ms or vault.wal.persistWALs goes over 1,000 ms, as this is indicative of backpressure slowing down your backend. If either alert triggers, you may need to consider scaling your storage backend to handle the increased load.
Metric to watch: vault.replication.wal.last_wal
Comparing the index of the last WAL on your primary and secondary clusters helps you determine if they are falling out of sync. If your secondary clusters are far behind the primary and the primary cluster becomes unavailable, any queries to Vault will return stale data. Therefore, if you're seeing gaps in WAL values, you will want to examine some potential causes, such as network issues and resource saturation.
An overview of Vault logs
You can gain an even deeper understanding of Vault’s activity by collecting and analyzing logs from your Vault clusters. Vault produces two types of logs: server logs and audit logs. Server logs record all activities that occurred on each server, and they would be the first place you'd look to troubleshoot an error. Log entries include a timestamp, the log level, the log source (e.g., core, storage), and the log message, as shown below:
2020-09-22T10:44:24.960-0400 [INFO] core: post-unseal setup starting2020-09-22T10:44:24.968-0400 [INFO] core: loaded wrapping token key2020-09-22T10:44:24.968-0400 [INFO] core: successfully setup plugin catalog: plugin-directory=2020-09-22T10:44:24.968-0400 [INFO] core: no mounts; adding default mount table2020-09-22T10:44:24.969-0400 [INFO] core: successfully mounted backend: type=cubbyhole path=cubbyhole/Vault also generates detailed audit logs, which record the requests and responses of every interaction with Vault. You can configure Vault to use multiple audit devices such that, if one device becomes blocked, you have a fallback destination for your audit logs. Audit logs are stored in JSON format, as shown in this example:
{ "time": "2019-11-05T00:40:27.638711Z", "type": "request", "auth": { "client_token": "hmac-sha256:6291b17ab99eb5bf3fd44a41d3a0bf0213976f26c72d12676b33408459a89885", "accessor": "hmac-sha256:2630a7b8e996b0c451db4924f32cec8793d0eb69609f777d89a5c8188a742f52", "display_name": "root", "policies": [ "root" ], "token_policies": [ "root" ], "token_type": "service" }, "request": { "id": "9adb5544-637f-3d42-9459-3684f5d21996", "operation": "update", "client_token": "hmac-sha256:6291b17ab99eb5bf3fd44a41d3a0bf0213976f26c72d12676b33408459a89885", "client_token_accessor": "hmac-sha256:2630a7b8e996b0c451db4924f32cec8793d0eb69609f777d89a5c8188a742f52", "namespace": { "id": "root" }, "path": "sys/policies/acl/admin", "data": { "policy": "hmac-sha256:212744709e5a643a5ff4125160c26983f8dab537f60d166c2fac5b95547abc33" }, "remote_address": "127.0.0.1" }}In Part 2, we will discuss how you can use the Vault command line to inspect both types of logs. In Part 3, we'll go one step further and show you how to use Datadog to analyze your logs—and seamlessly correlate them with metrics and other data from across your stack to get comprehensive visibility into your applications. And in Part 4, we'll show you how Datadog Cloud SIEM automatically analyzes Vault audit logs to ensure that your Vault cluster is secure.
Unlock full visibility into Vault
As organizations move into dynamic, multi-cloud environments, Vault has become an essential tool for enabling teams to secure, store, and audit access to all of their sensitive information in one place. As we've seen in this post, monitoring various parts of Vault's architecture—from its core to its storage backend—is essential for keeping your Vault clusters healthy and running optimally. In the next part of this series, we will introduce the built-in tools you can use to collect and view Vault metrics and logs.
Acknowledgment
We would like to thank our friends at HashiCorp for their technical review of this post.


