Nicholas Thomson
In Part 2 of this series, we looked at Snowflake’s built-in monitoring services for compute, query, and storage. In this post, we’ll demonstrate how Datadog complements and extends Snowflake’s existing monitoring and data visualization capabilities, enabling teams to get deeper visibility and extract more valuable insights from their Snowflake data.
Datadog offers an API-based Snowflake integration, which provides full visibility into Snowflake’s infrastructure and data retrieval, enabling you to improve performance and reduce costs by uncovering long-running queries and rooting out inefficient resource utilization.
We’ll show you how to:
- Collect Snowflake telemetry data via Datadog’s Snowflake integration
- Visualize key performance metrics
- Analyze and alert on Snowflake logs to get a better understanding of warehouse performance and activity
- Optimize your spend with Cloud Cost Management
Collect Snowflake telemetry data via Datadog’s Snowflake integration
Once you’ve connected your Snowflake account, Datadog’s Snowflake integration enables you to forward telemetry from Snowflake to Datadog in order to monitor key metrics, analyze logs from your query history, and alert on resource consumption thresholds.
By default, the integration collects logs on query history, security, and event tables. The integration ingests Snowflake metrics from Account usage (ACCOUNT_USAGE schema) and Organization usage (ORGANIZATION_USAGE schema), among other areas. You can also collect custom metrics and tags by writing your own SQL queries directly in the integration tile. These can be used to scope metrics, such as AVG_RUNNING or CREDITS_USED to specific jobs or users. Additionally, custom metrics enable you to surface business data from Snowflake (e.g., sales trends, user retention, and more).
Now that you are collecting Snowflake telemetry data, you can use Datadog to monitor the key performance metrics we discussed in Part 1, create visualizations, analyze logs, optimize cost in Cloud Cost Management (CCM), and more.
Get full visibility into Snowflake performance metrics
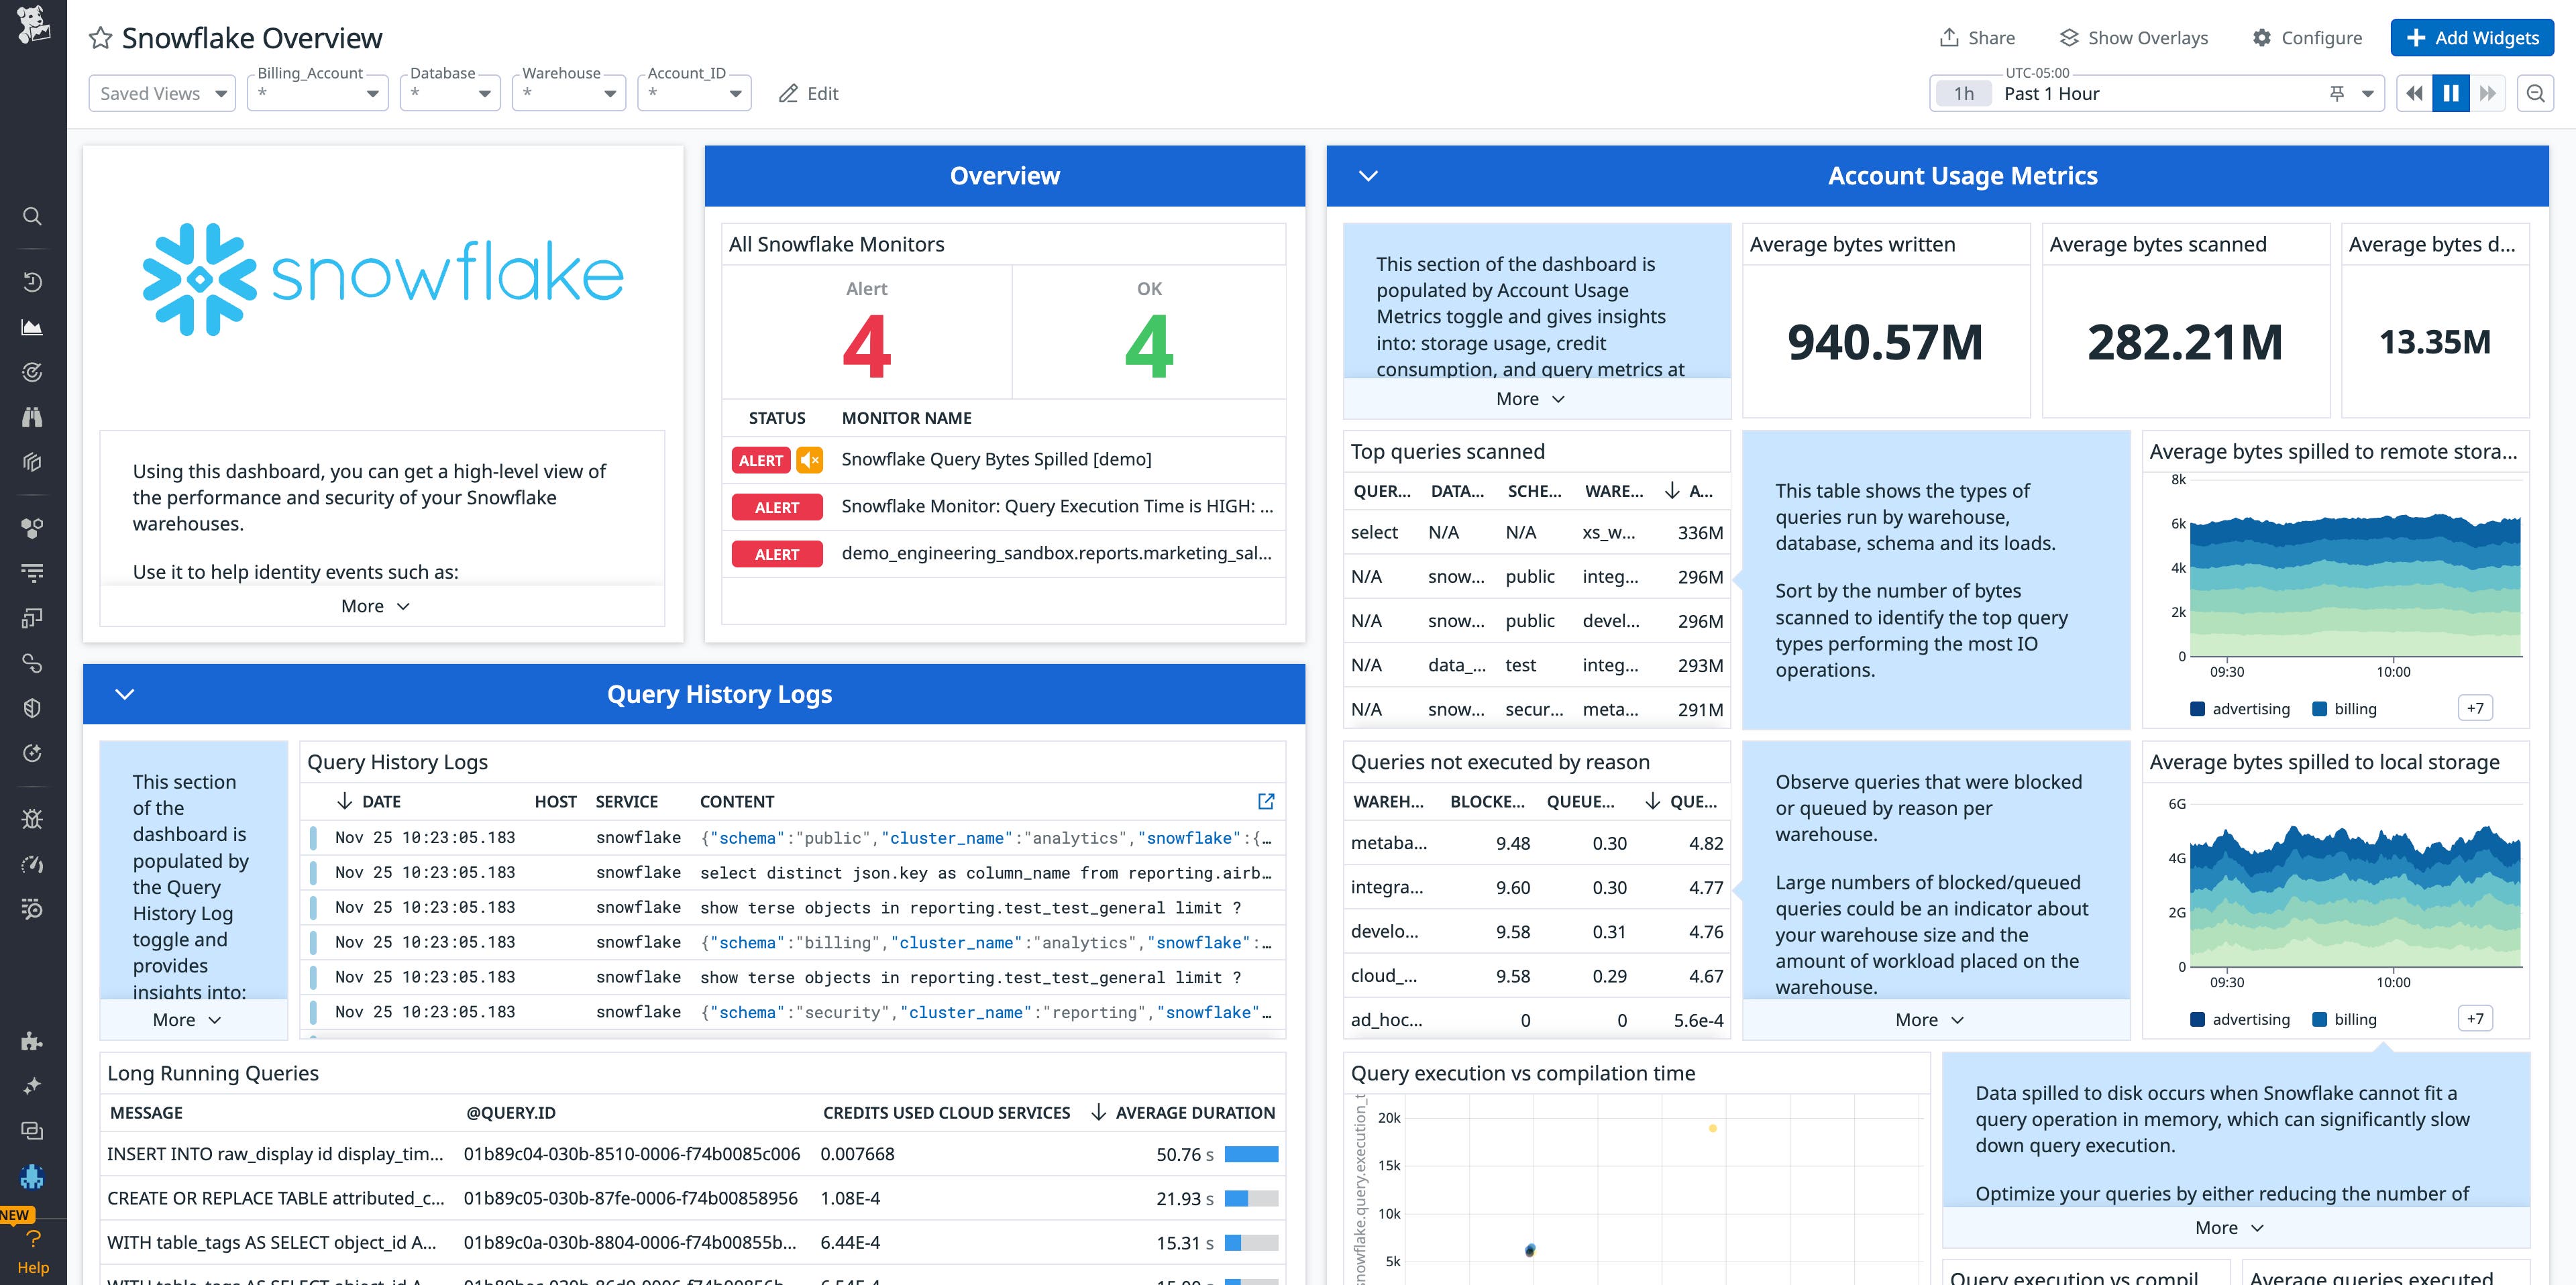
Datadog provides full visibility into the health and performance of your Snowflake warehouses via an out-of-the-box integration dashboard. The dashboard gives you a high-level overview of your account usage, query history, security logs, and more, and it includes some of the key metrics we discussed in Part 1, such as EXECUTION_TIME, AVERAGE_BYTES_WRITTEN, and AVERAGE_BYTES_SCANNED.
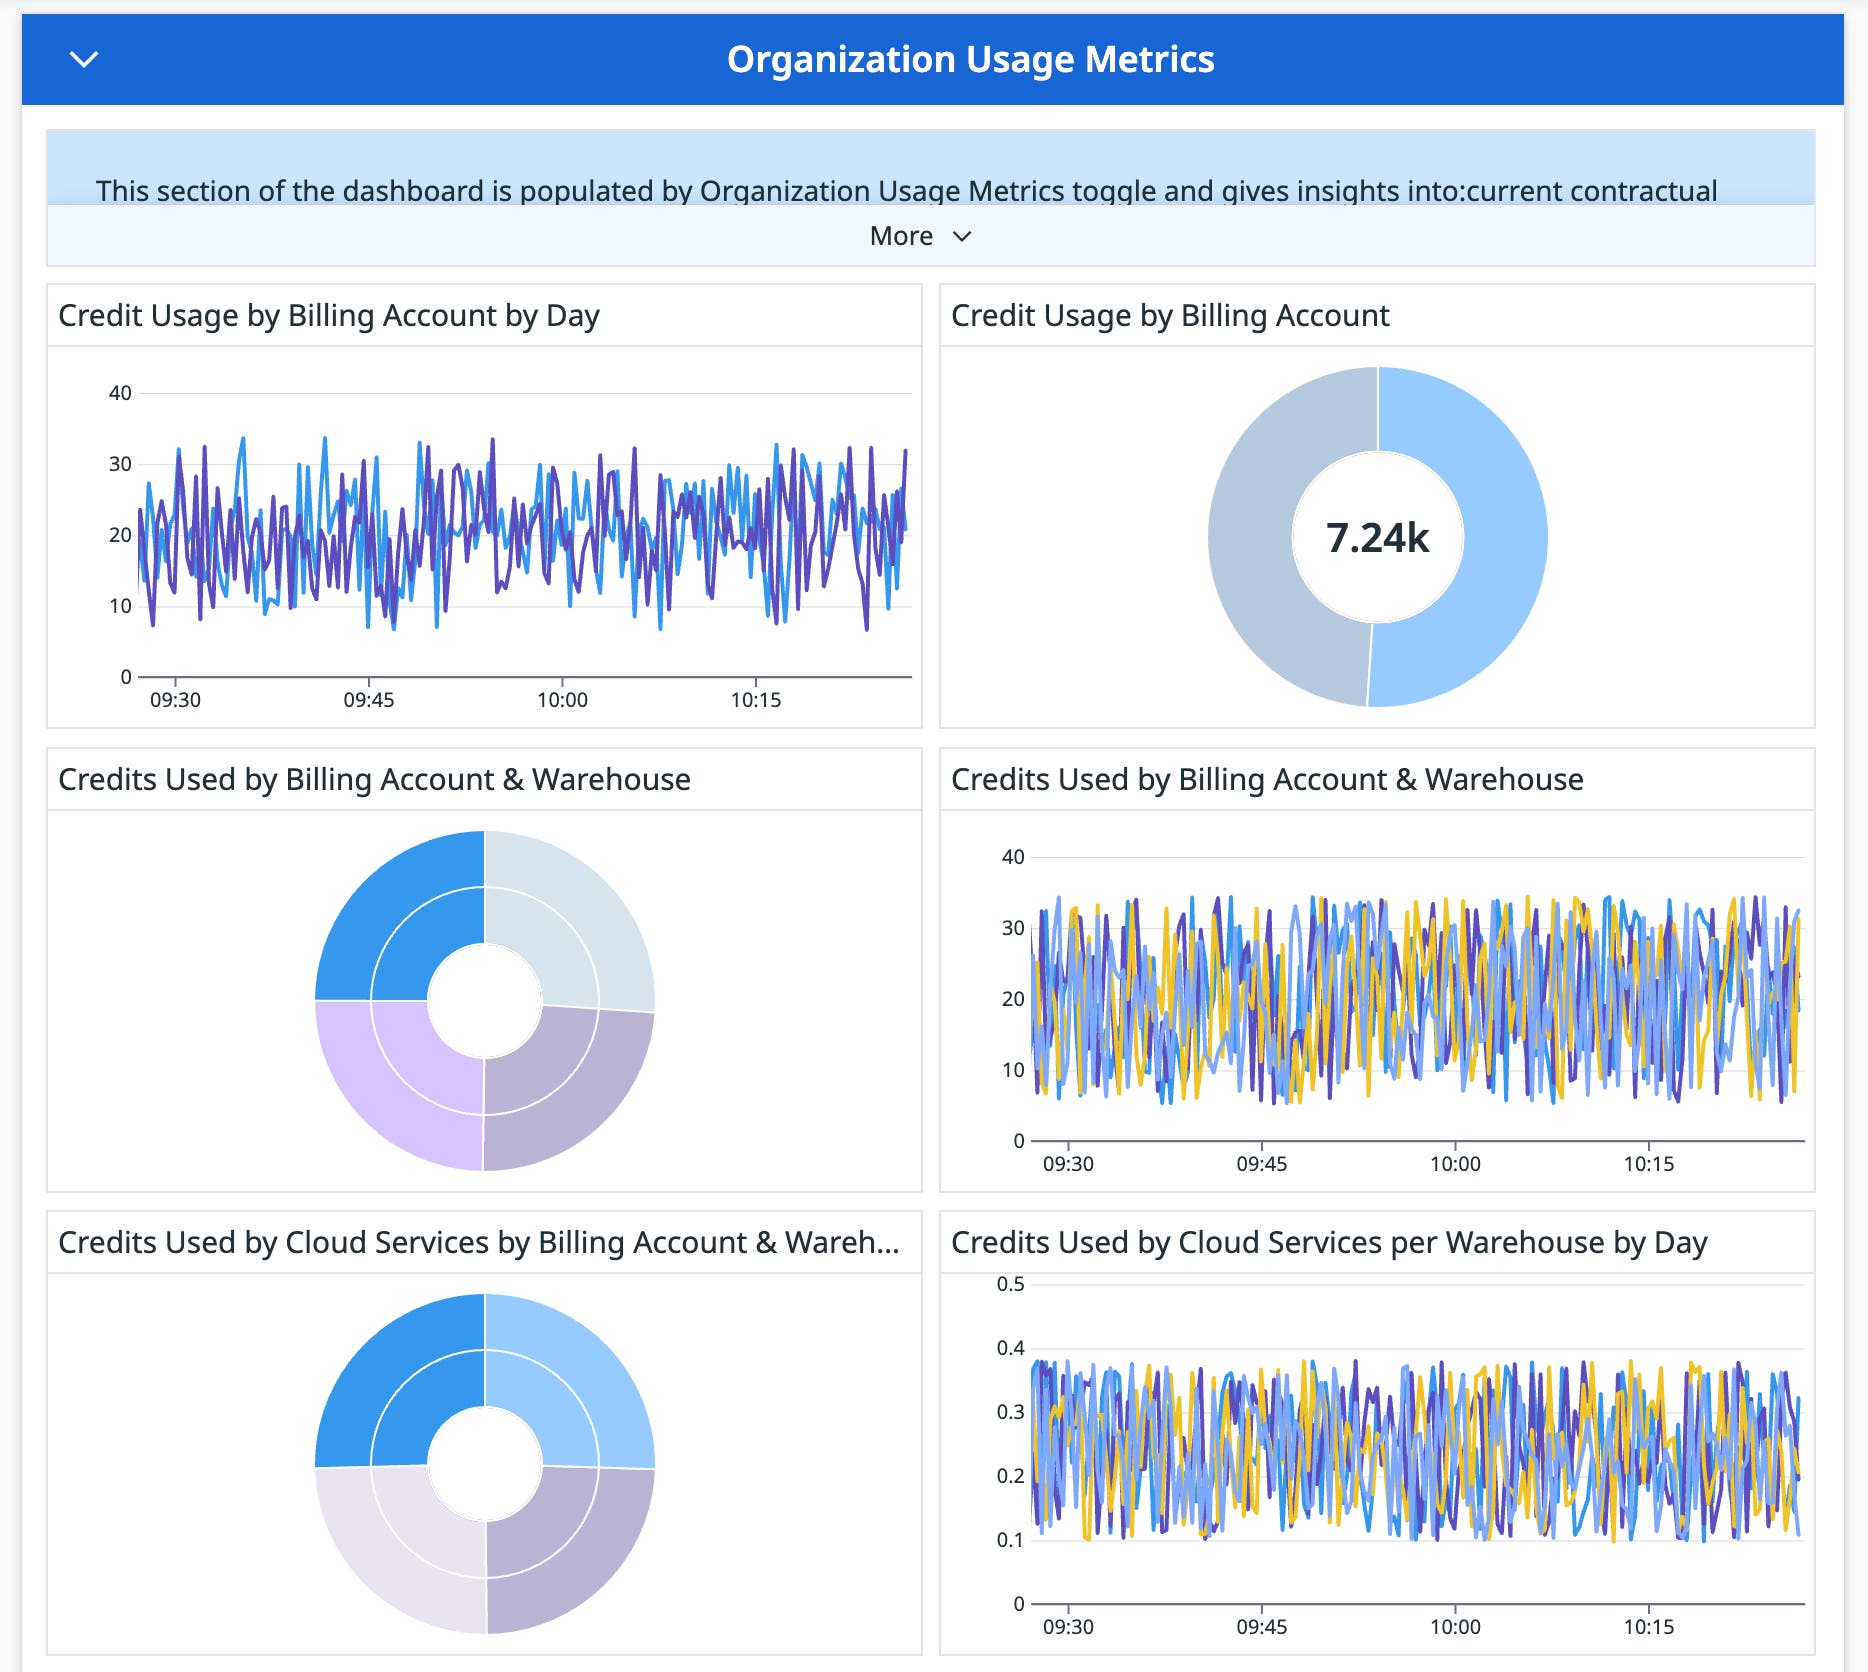
The Overview dashboard also includes organization use metrics, which provide visibility into total virtual warehouse credit usage by organization (snowflake.organization.warehouse.total_credit.sum), overall storage throughout your organization (snowflake.organization.storage.credits), and warehouse credit usage by cloud services (snowflake.organization.warehouse.cloud_service.sum), among other metrics.
Additionally, the dashboard breaks down organization use metrics by service, so you can get granular visibility into which teams are responsible for Snowflake costs.
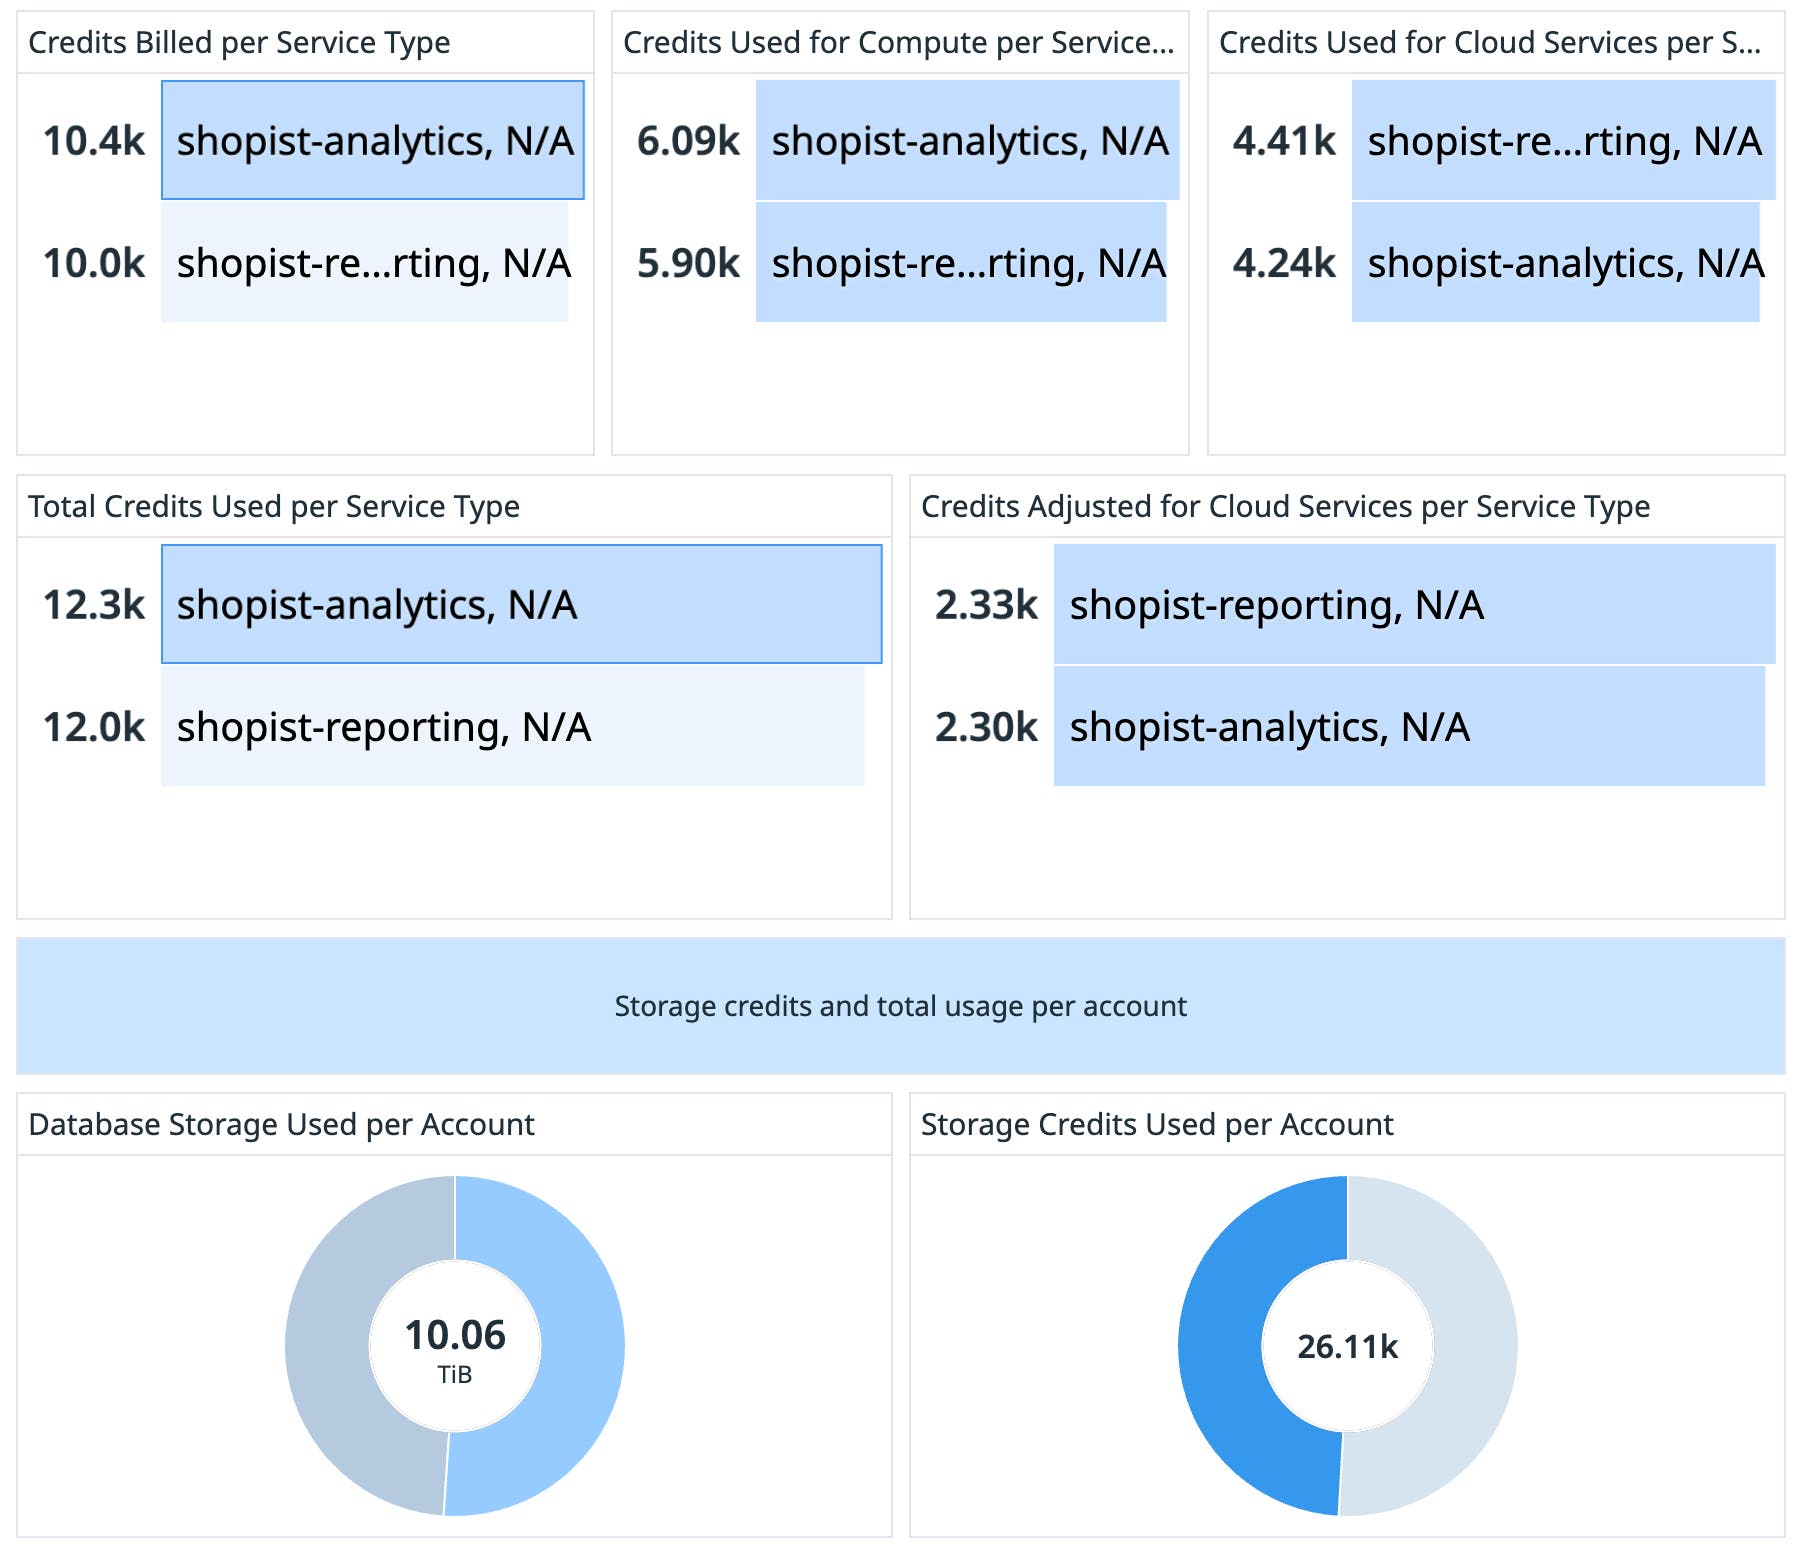
Monitoring at an organizational level can help you see which teams and team members are running the most expensive workloads, make informed decisions about usage, and decide how and where to allocate virtual warehouse compute credits.
While these metrics provide a good starting point, Datadog Cloud Cost Management is the best way to stay on top of Snowflake costs because of the wealth of insights it provides, such as specific dollar costs associated with workloads, additional telemetry alongside cost data for context into how components like infrastructure and traces are correlated with cost, as well as Tag Pipelines to unify tag rules across your system and optimize visibility into costs.
Datadog’s Snowflake integration also comes with an out-of-the-box Event Tables dashboard, which surfaces event tables logs.
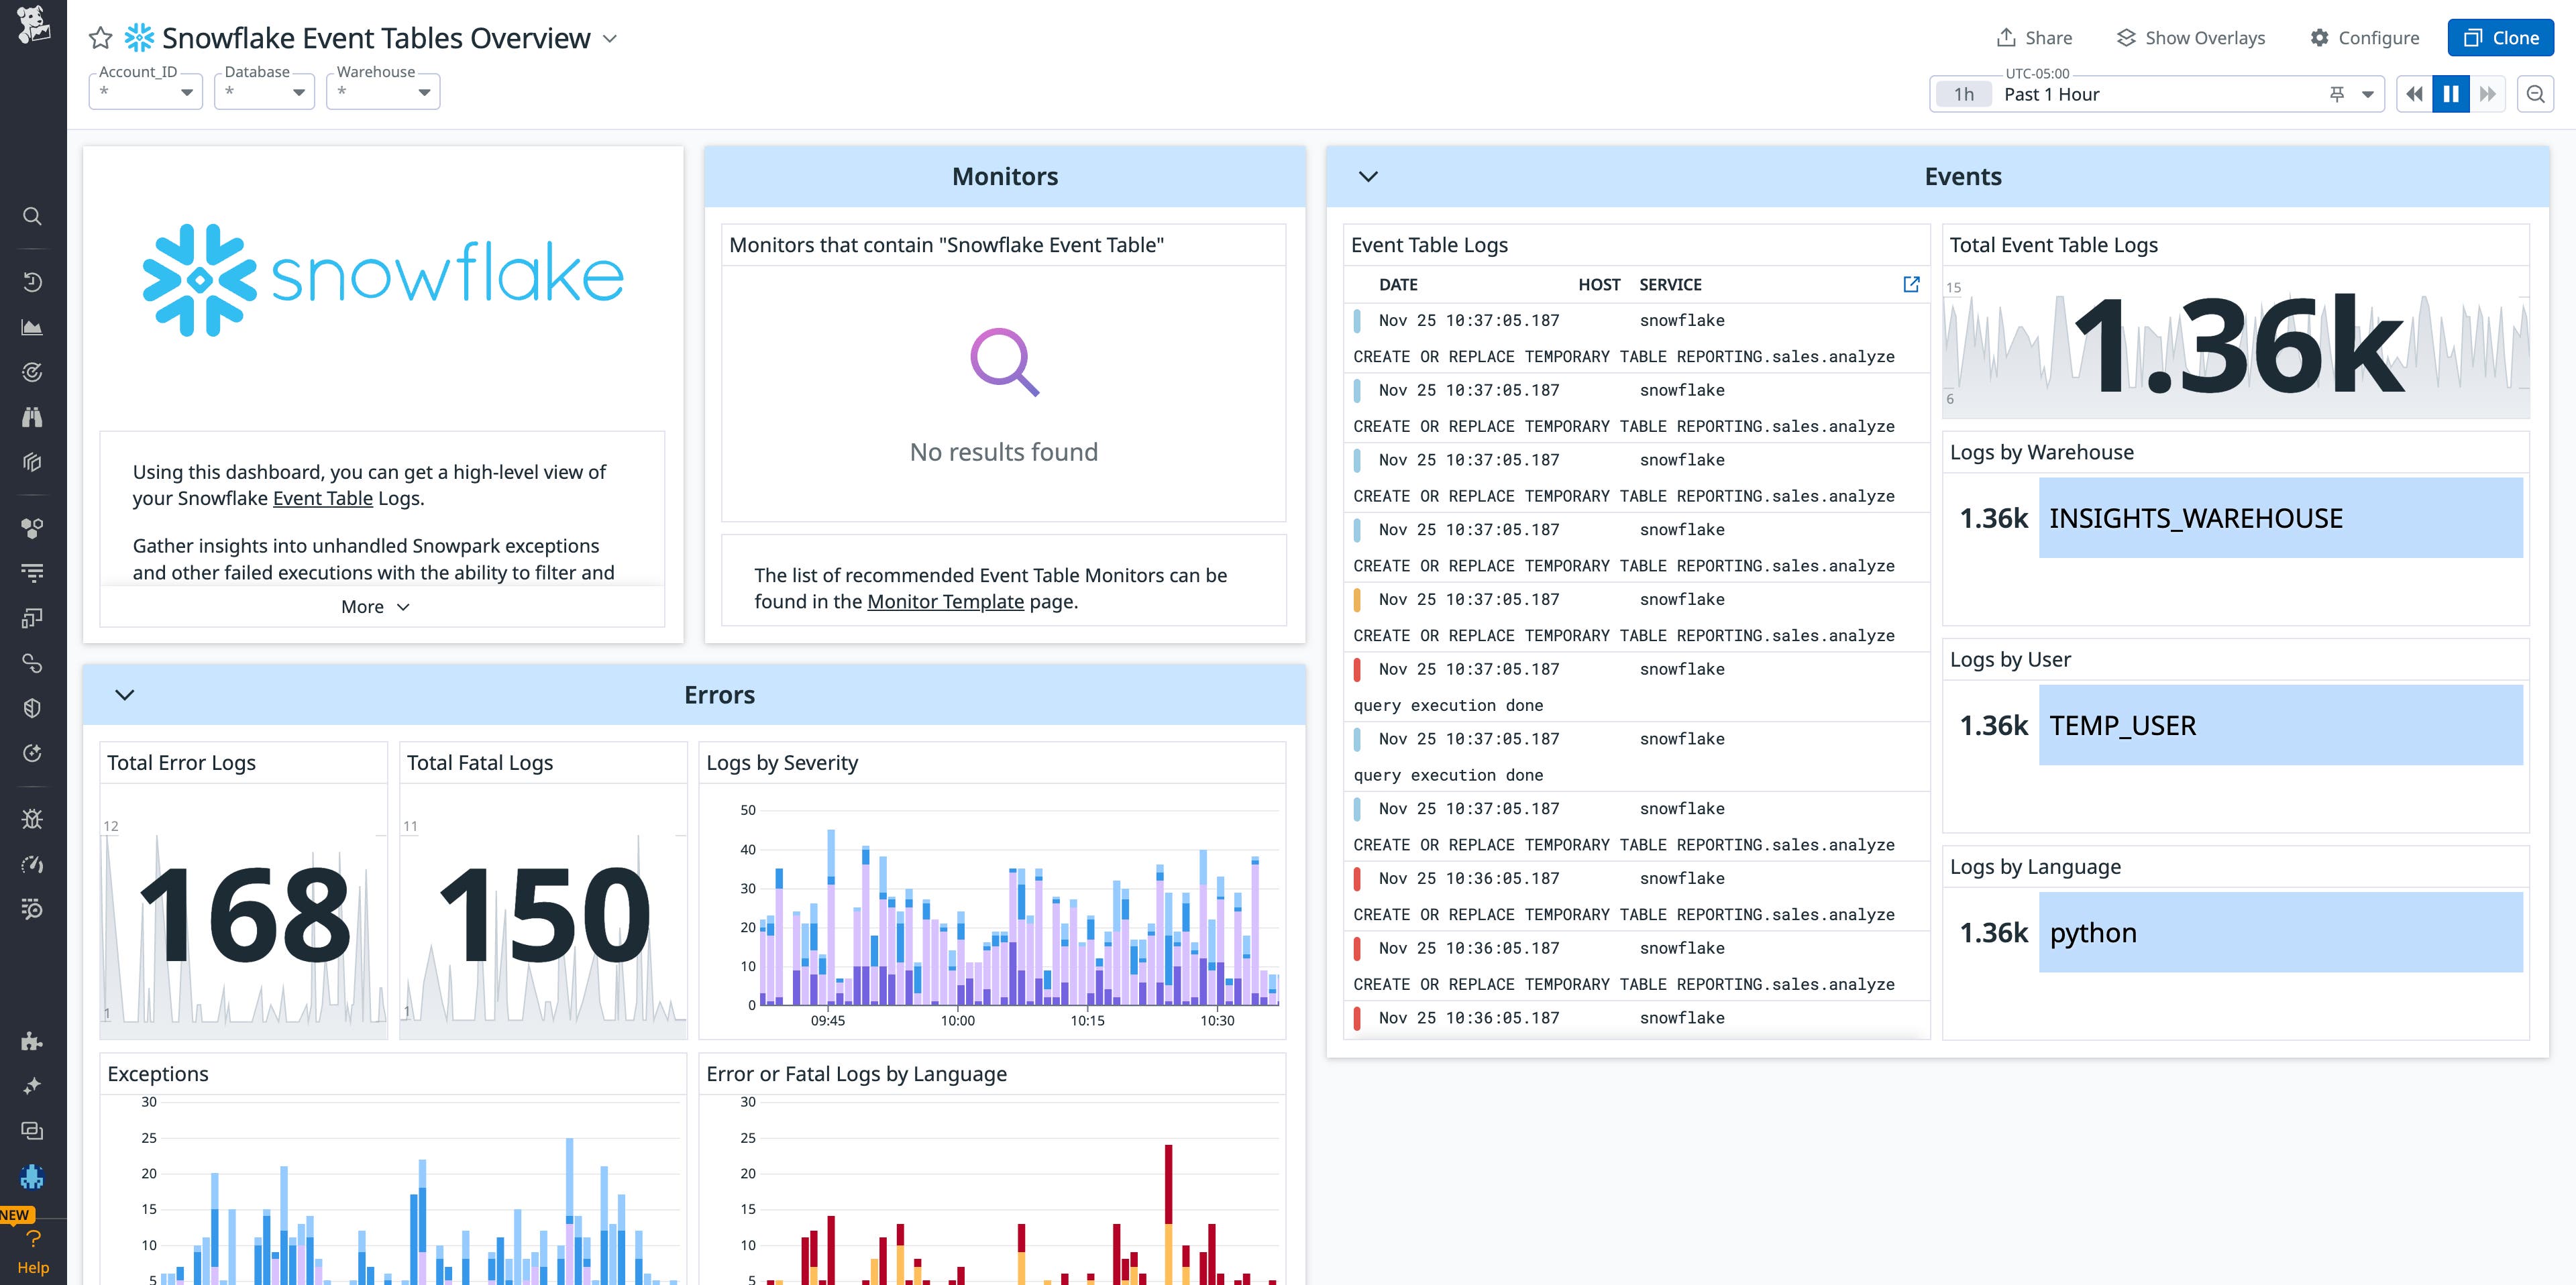
This dashboard can help you gain insight into how users and teams are interacting with Snowflake. For example, a SysAdmin could use event table logs to monitor who is accessing the system and what actions they are performing by tracking logins and queries executed by specific users.
You can also create custom dashboards to track additional metrics like ROWS_INSERTED to monitor query history, or CLUSTERING_KEY to see which tables might benefit from clustering.
Monitor virtual warehouses with Log Analytics
Datadog’s Snowflake integration automatically collects logs, which can be analyzed in the Log Explorer. Datadog Flex Logs enables teams to retain their Snowflake logs long-term while keeping open the option of querying them if an urgent reason arises. For instance, teams might want to keep Snowflake logs in Flex Logs for long-term auditing, compliance and legal reasons, security investigations, or reporting and analytics for high-cardinality data over long time periods.
Snowflake query history logs can be used to identify and troubleshoot long-running and failing queries. For example, a SysAdmin looking to optimize virtual warehouse compute might filter Snowflake logs in the Log Explorer by snowflake.query.bytes_scanned to surface the organization’s most expensive queries.
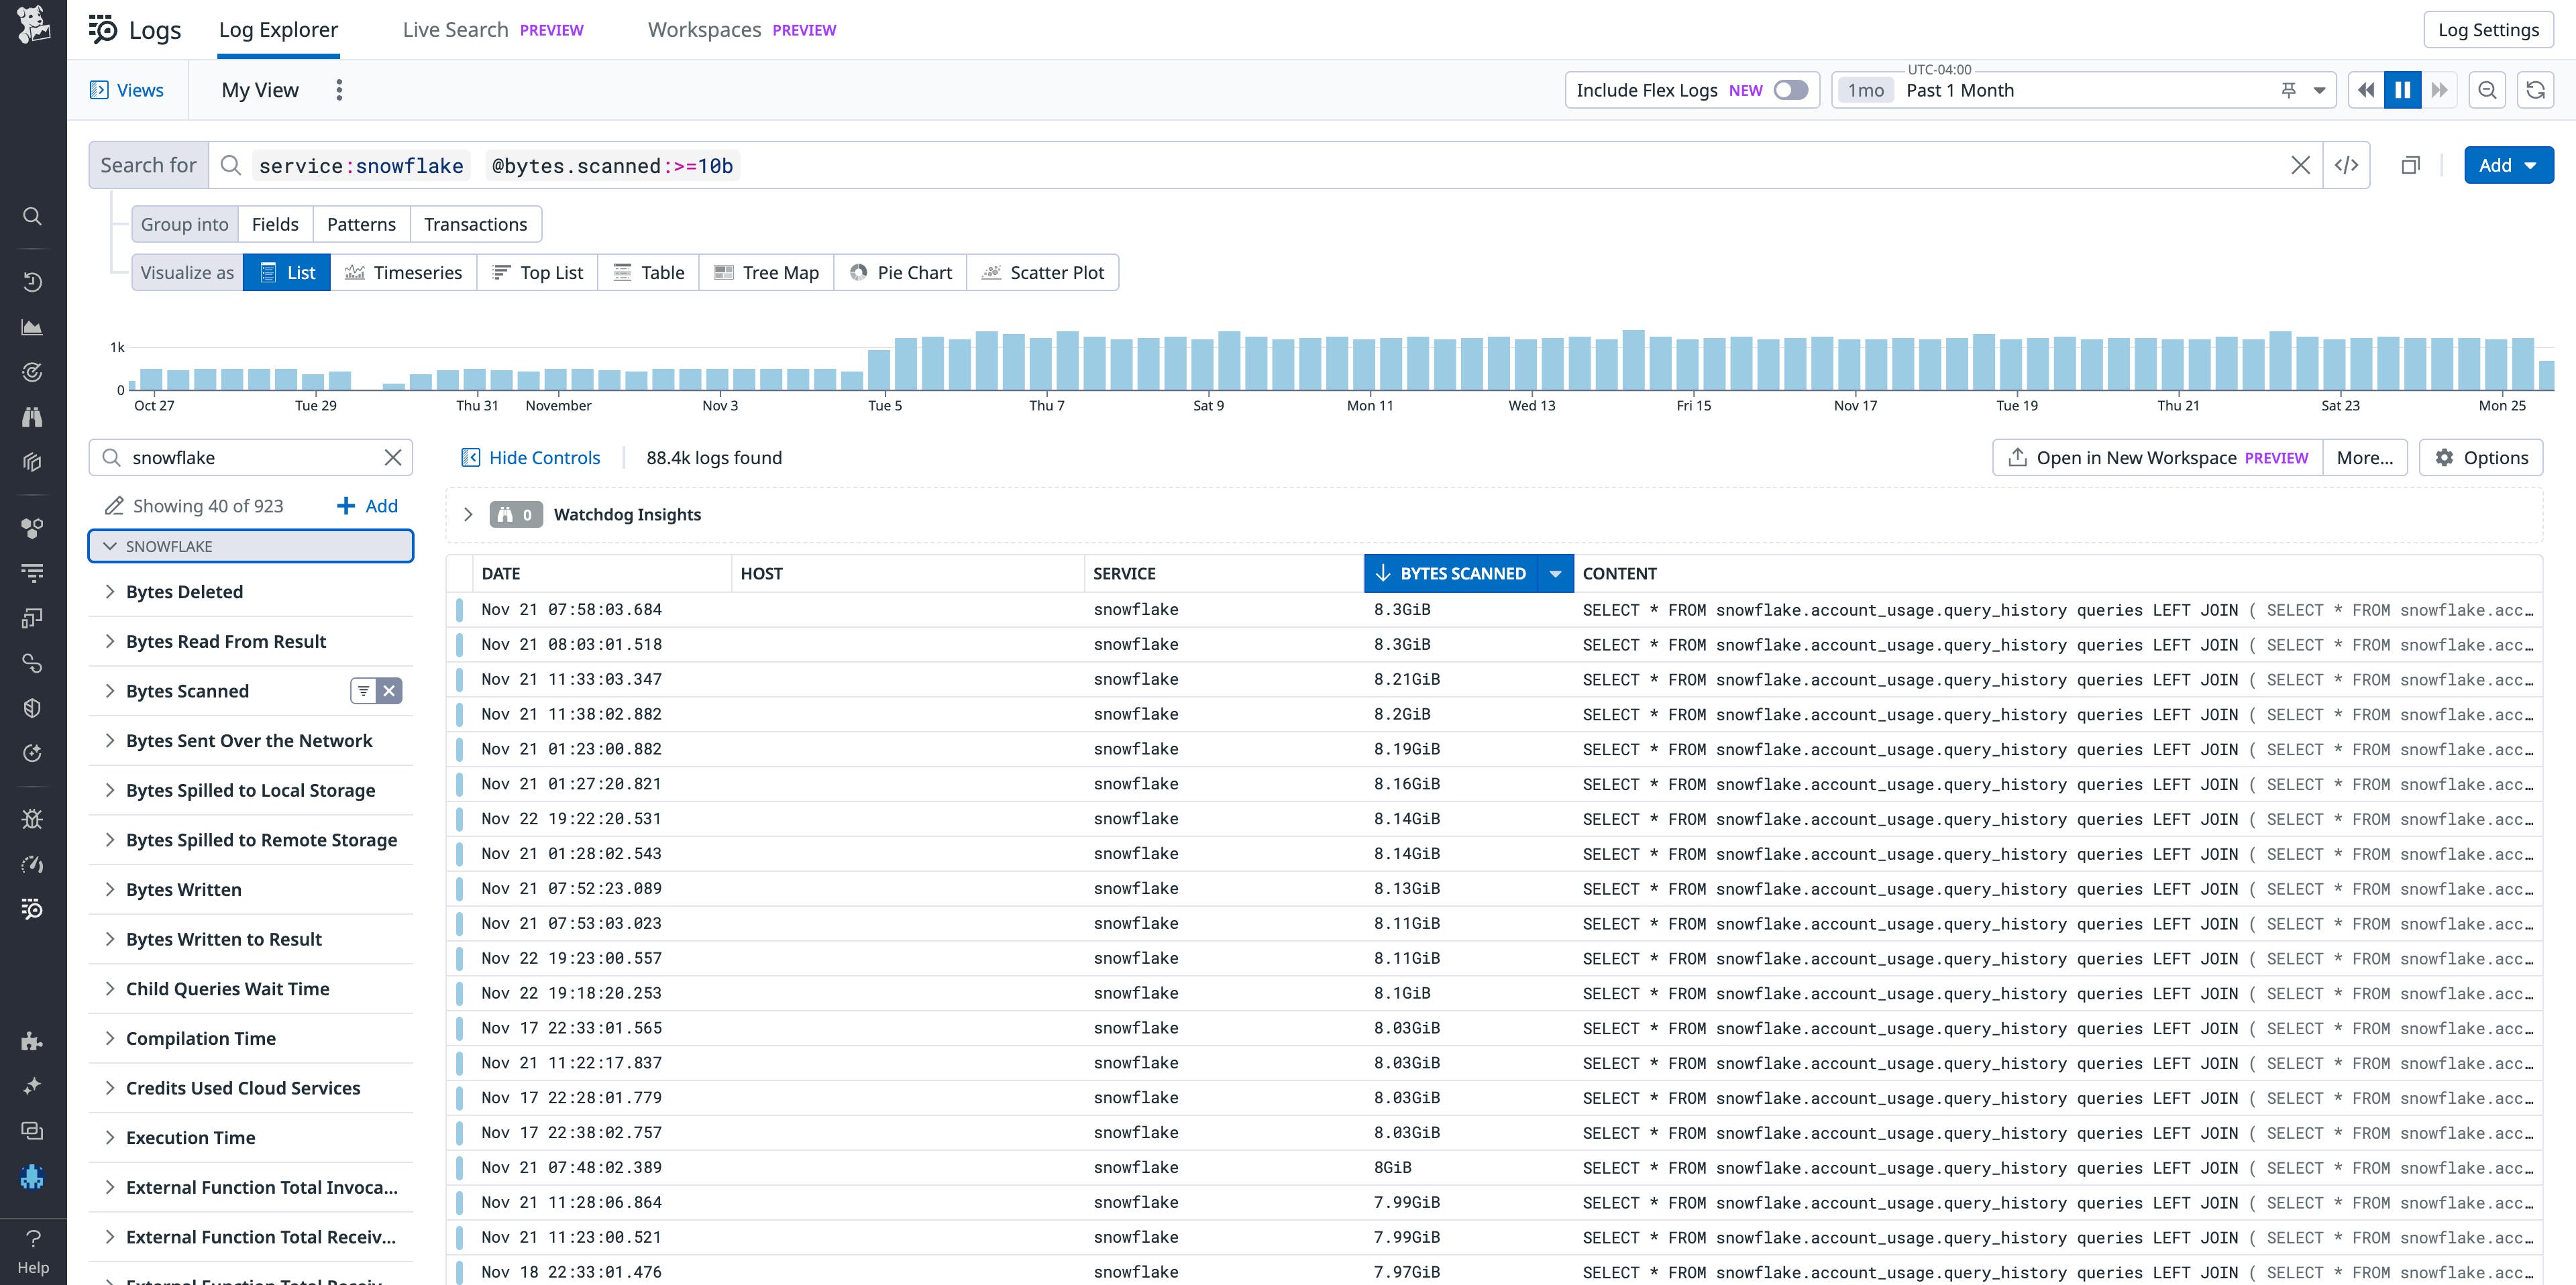
They could then examine these queries to see if there are any logical or syntactical opportunities for optimization, or if a query hash might be appropriate (e.g., if the purchase_date column in a sales table is queried frequently). QUERY_HASH is a unique identifier mapping to a specific query’s execution plan, which can help you find frequently used patterns of workloads that would most benefit from optimization.
Optimize your spend with Cloud Cost Management
While monitoring Snowflake metrics provides a good starting point for managing your Snowflake costs, Datadog CCM offers deeper, more complete cost insights. CCM’s Snowflake integration (in Preview) provides deep visibility into how infrastructure is contributing to cost, including a wealth of features, such as the ability to analyze query costs by any tag.
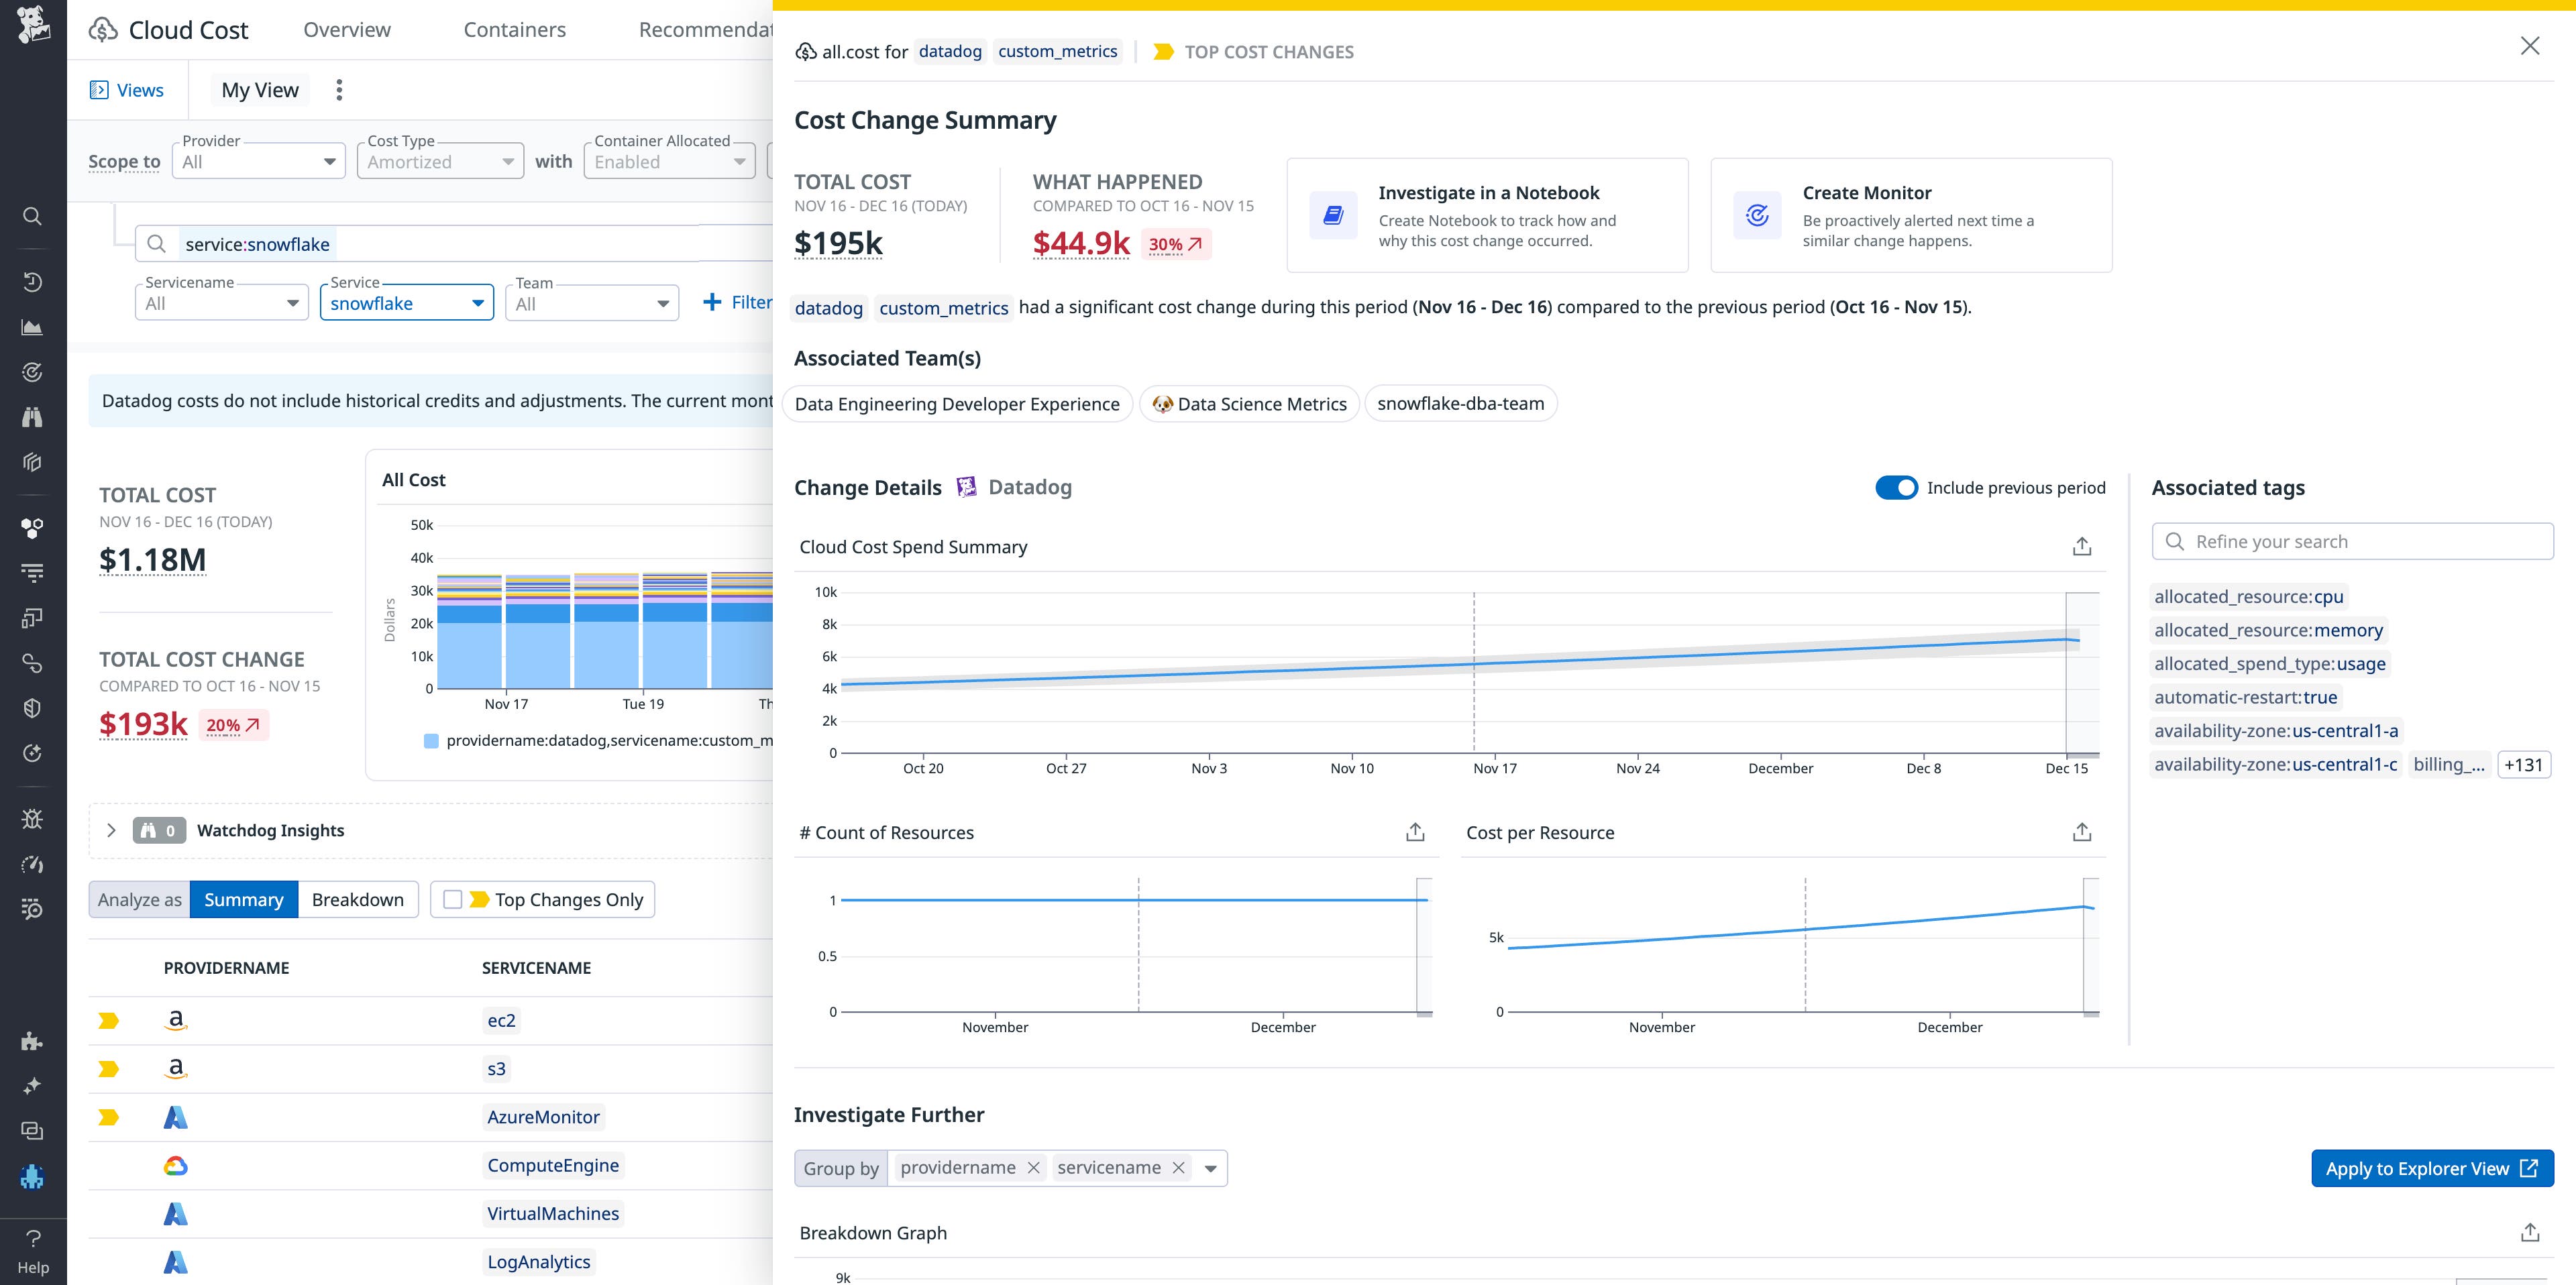
Once you’ve enabled CCM to start collecting Snowflake data, Snowflake will appear as a facet in the Cloud Cost Explorer, which enables you to filter for Snowflake spend. You can further narrow your search by scoping your CCM data to the specific services querying Snowflake data and the teams responsible for those services, enabling you to get a detailed breakdown of your organization’s total cloud spend. CCM can help you identify spikes in cost and make decisions about which teams and services in your organization would benefit the most from optimization.
For example, a SysAdmin at an e-commerce company might notice a spike in the marketing service’s cloud spend. Upon further investigation, they discover that the marketing team recently wrote new queries that increased the expenditure of compute credits. These queries were small but running on an X-Large warehouse, when they could have been running on an X-Small one—thus, they were costing 16 times more (the differential in credits per hour between these warehouse sizes) than they should. To resolve the problem, the SysAdmin can simply adjust the virtual warehouse size, reducing the cost.
Monitor your Snowflake warehouses and cost with Datadog
In this post, we’ve shown how to collect telemetry data from your Snowflake virtual warehouses and databases to get full visibility into their health, performance, and cost—alongside the other technologies supporting your applications.
Check out our documentation to learn more about Datadog’s Snowflake integration and start collecting data from your warehouses. Or, if you’re new to Datadog, sign up for a 14-day free trial.


