David M. Lentz

Brad Menezes
Since its release in 1995, PHP has been one of the most popular server-side languages for building web applications. It supports a wide range of web servers, databases, and operating systems. PHP developers use popular frameworks like Laravel, Symfony, and Zend to deploy and manage sites that serve high volumes of traffic. To help you monitor PHP performance, identify bottlenecks, and optimize your users’ experience, Datadog offers App Analytics for PHP.
Getting started with PHP APM
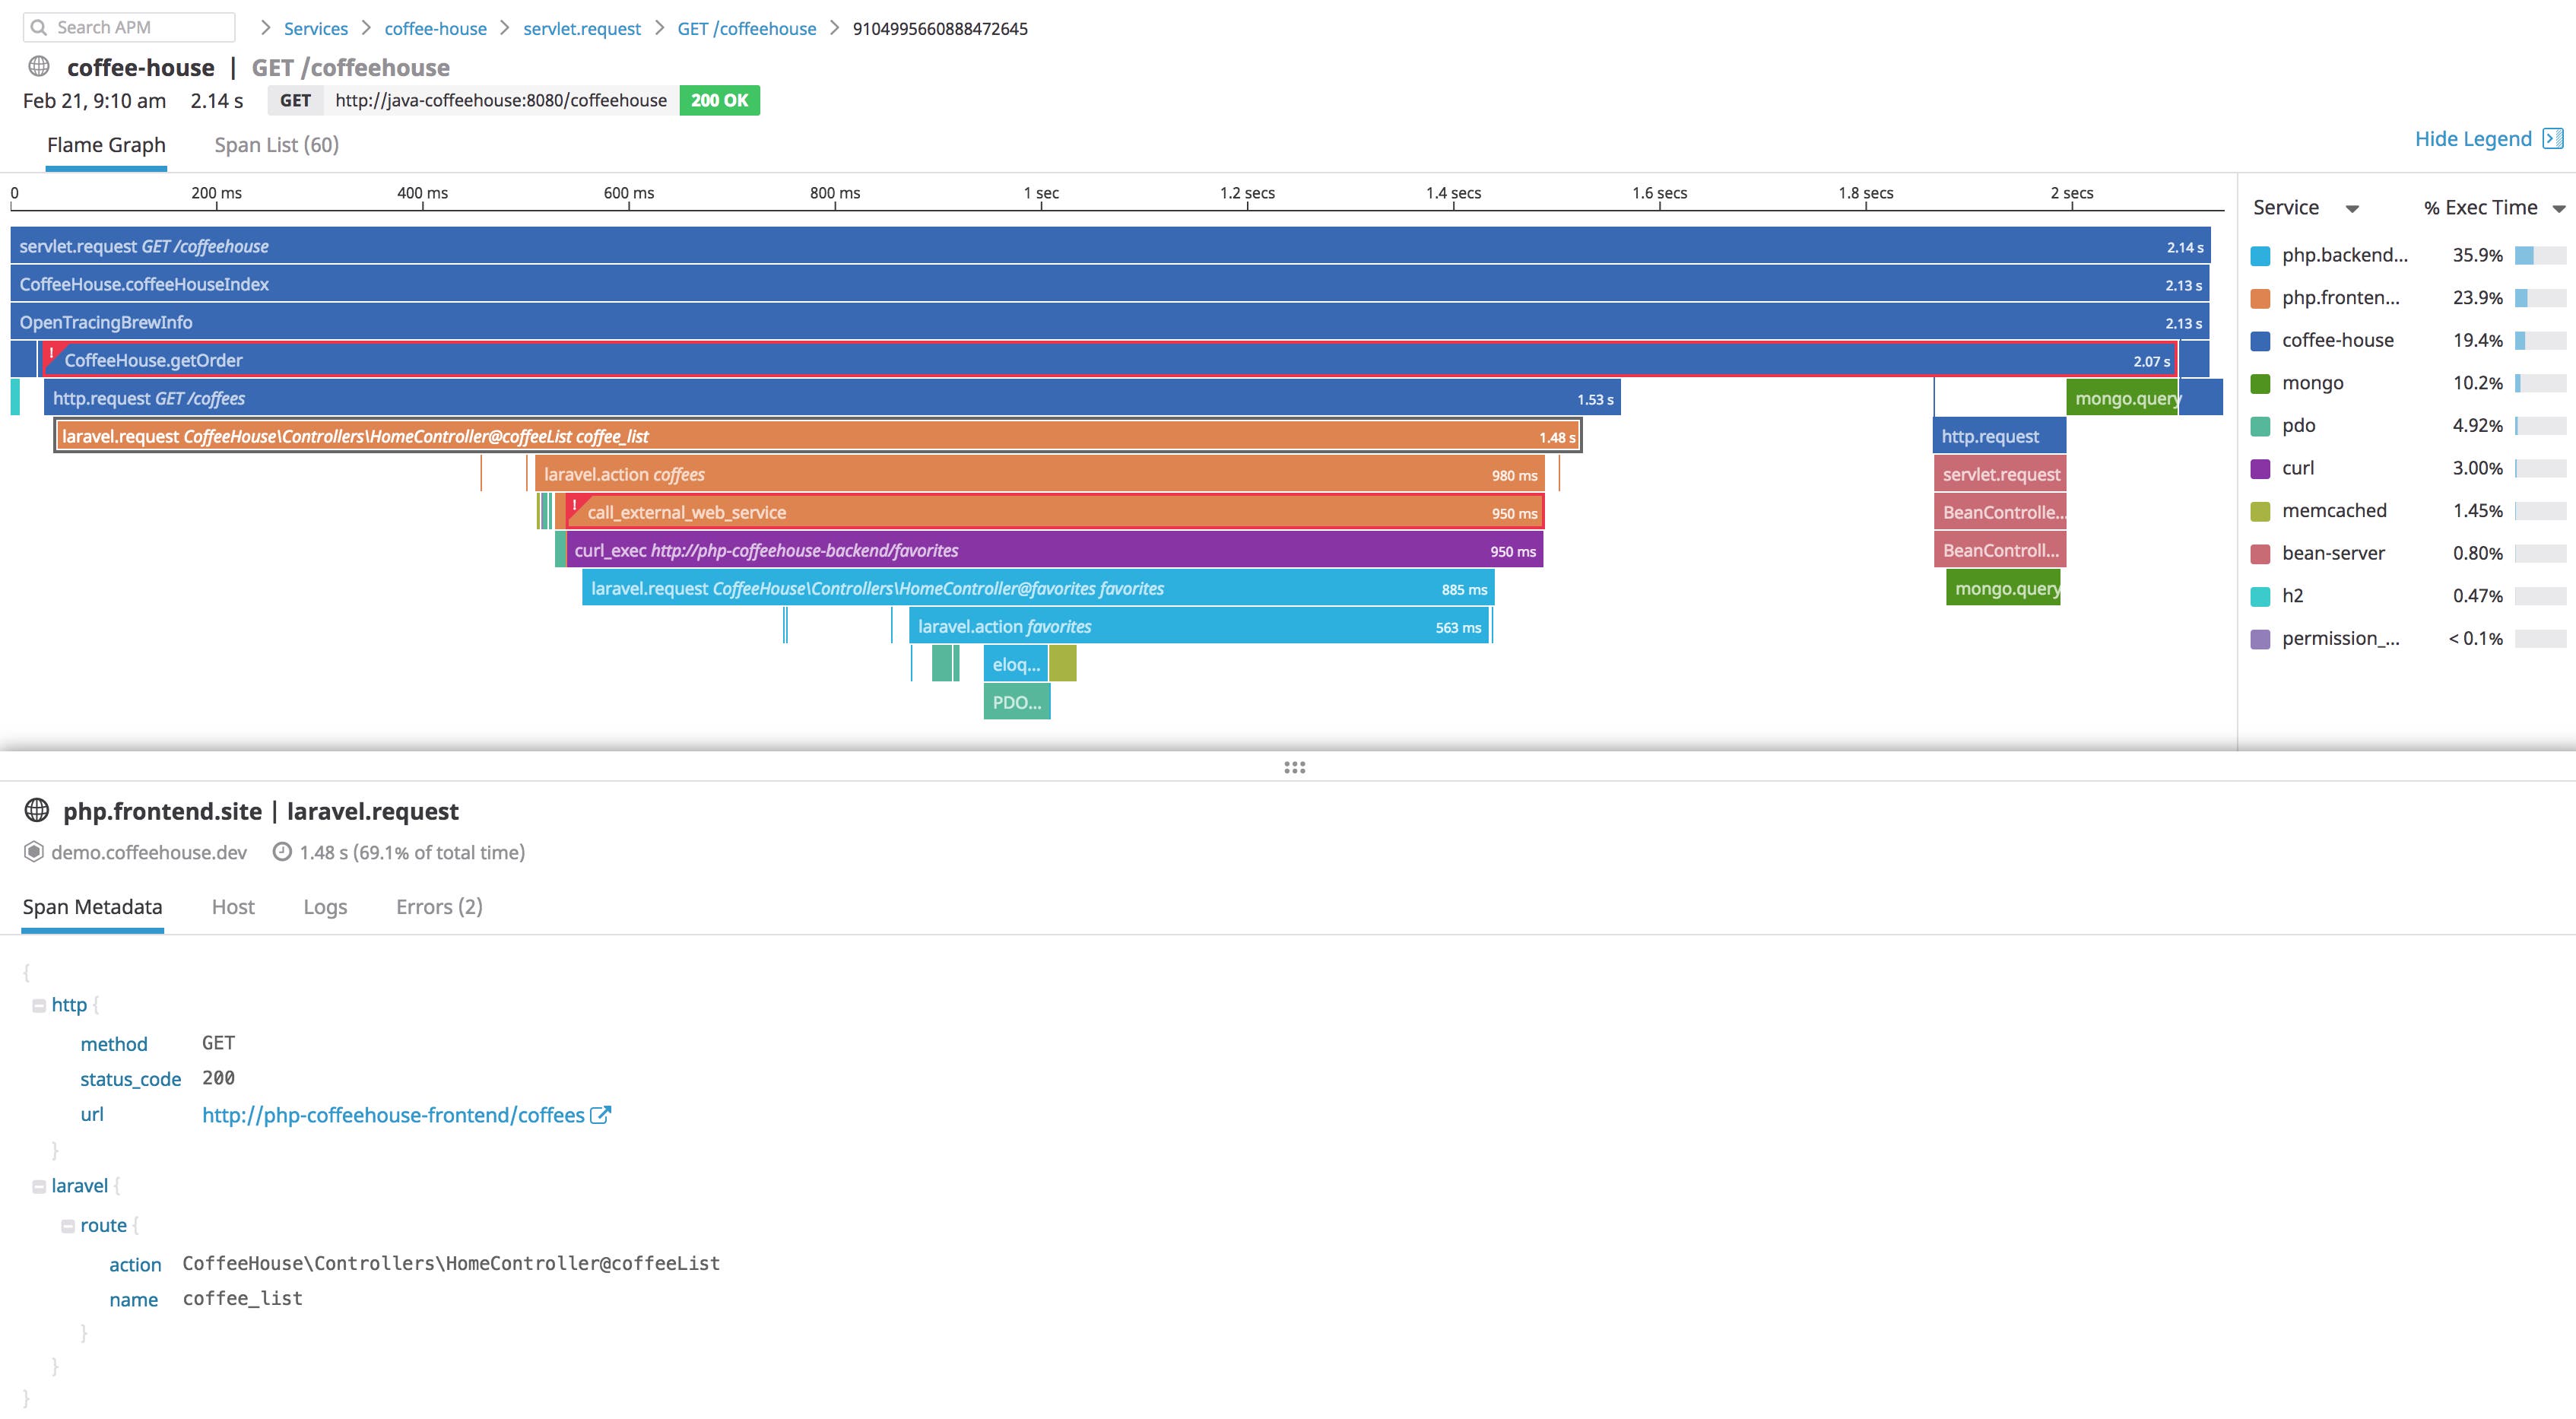
Datadog APM provides you with distributed tracing to visualize the full execution path of requests, and detailed performance metrics for each of your services, endpoints, and database queries. All you have to do to send traces to Datadog is install our extension through pre-compiled packages. Datadog calculates APM metrics, builds flame graphs, and automatically generates a Service Map to help you identify and troubleshoot performance issues quickly.
Auto-instrumented frameworks and libraries
Datadog’s open source PHP tracing library auto-instruments major frameworks like Laravel, Zend, and Symfony, and popular libraries like cURL, Guzzle, and PDO. It also includes support for Memcached, MongoDB, and MySQL. Support is coming soon for integration with Wordpress, Magento, Drupal, DynamoDB, RabbitMQ, Doctrine ORM, and many more. Refer to our documentation for a more extensive list.
You can also manually instrument your PHP code to collect custom traces if you choose. However you’ve created your PHP application, you’ll be able to troubleshoot its performance with minimal setup.
Built on OpenTracing
The Datadog PHP tracing library implements the OpenTracing API, which means you can start viewing traces without adding any vendor-specific code. For details on Datadog’s OpenTracing support, see our documentation.
Service Map
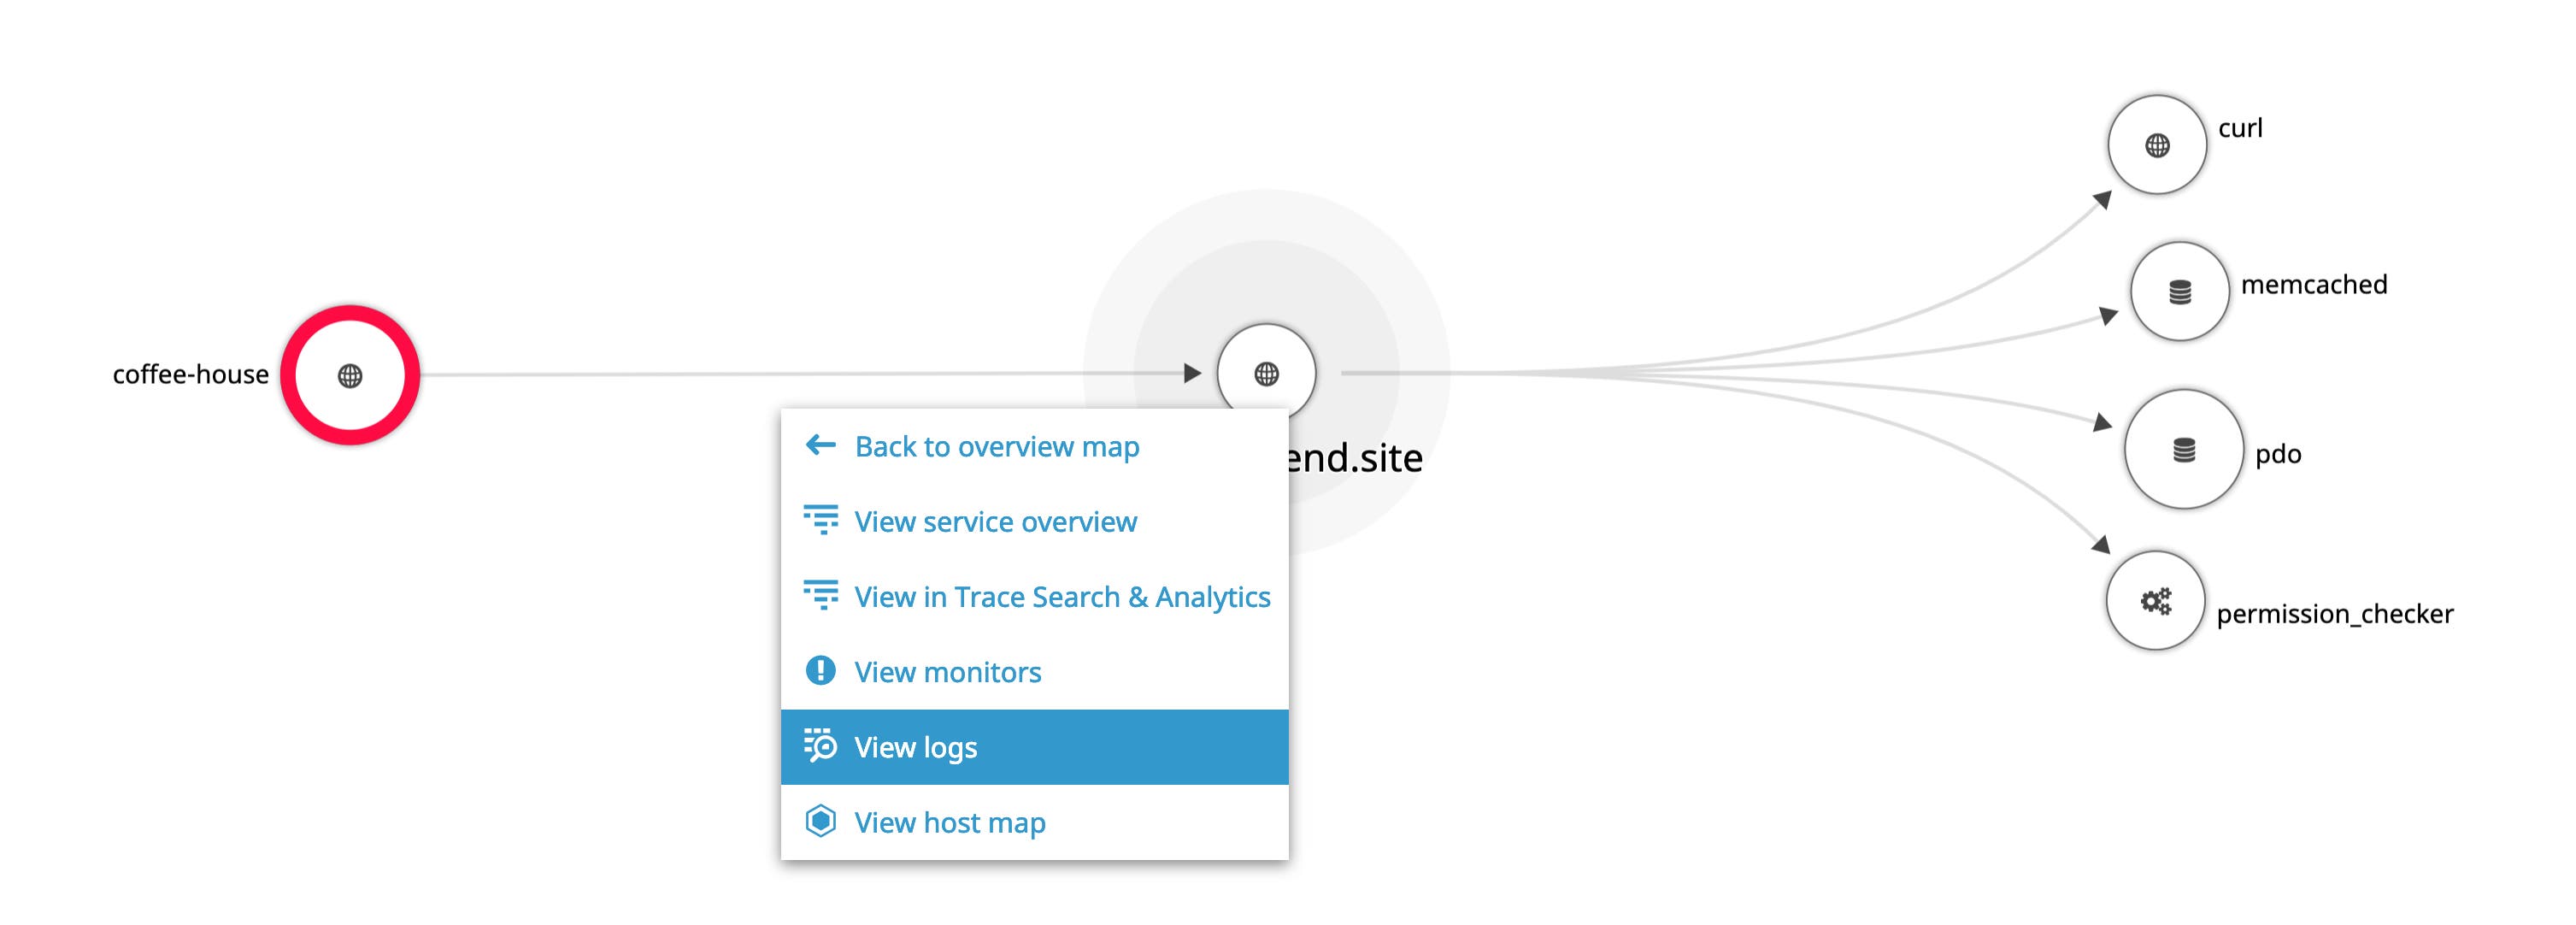
The Service Map visualizes your application’s component services and the request pathways between them. Because it is auto-generated based on the data collected from APM, you can access it right away—no additional setup required. This is particularly useful for seeing dependencies in complex, microservices-based applications.
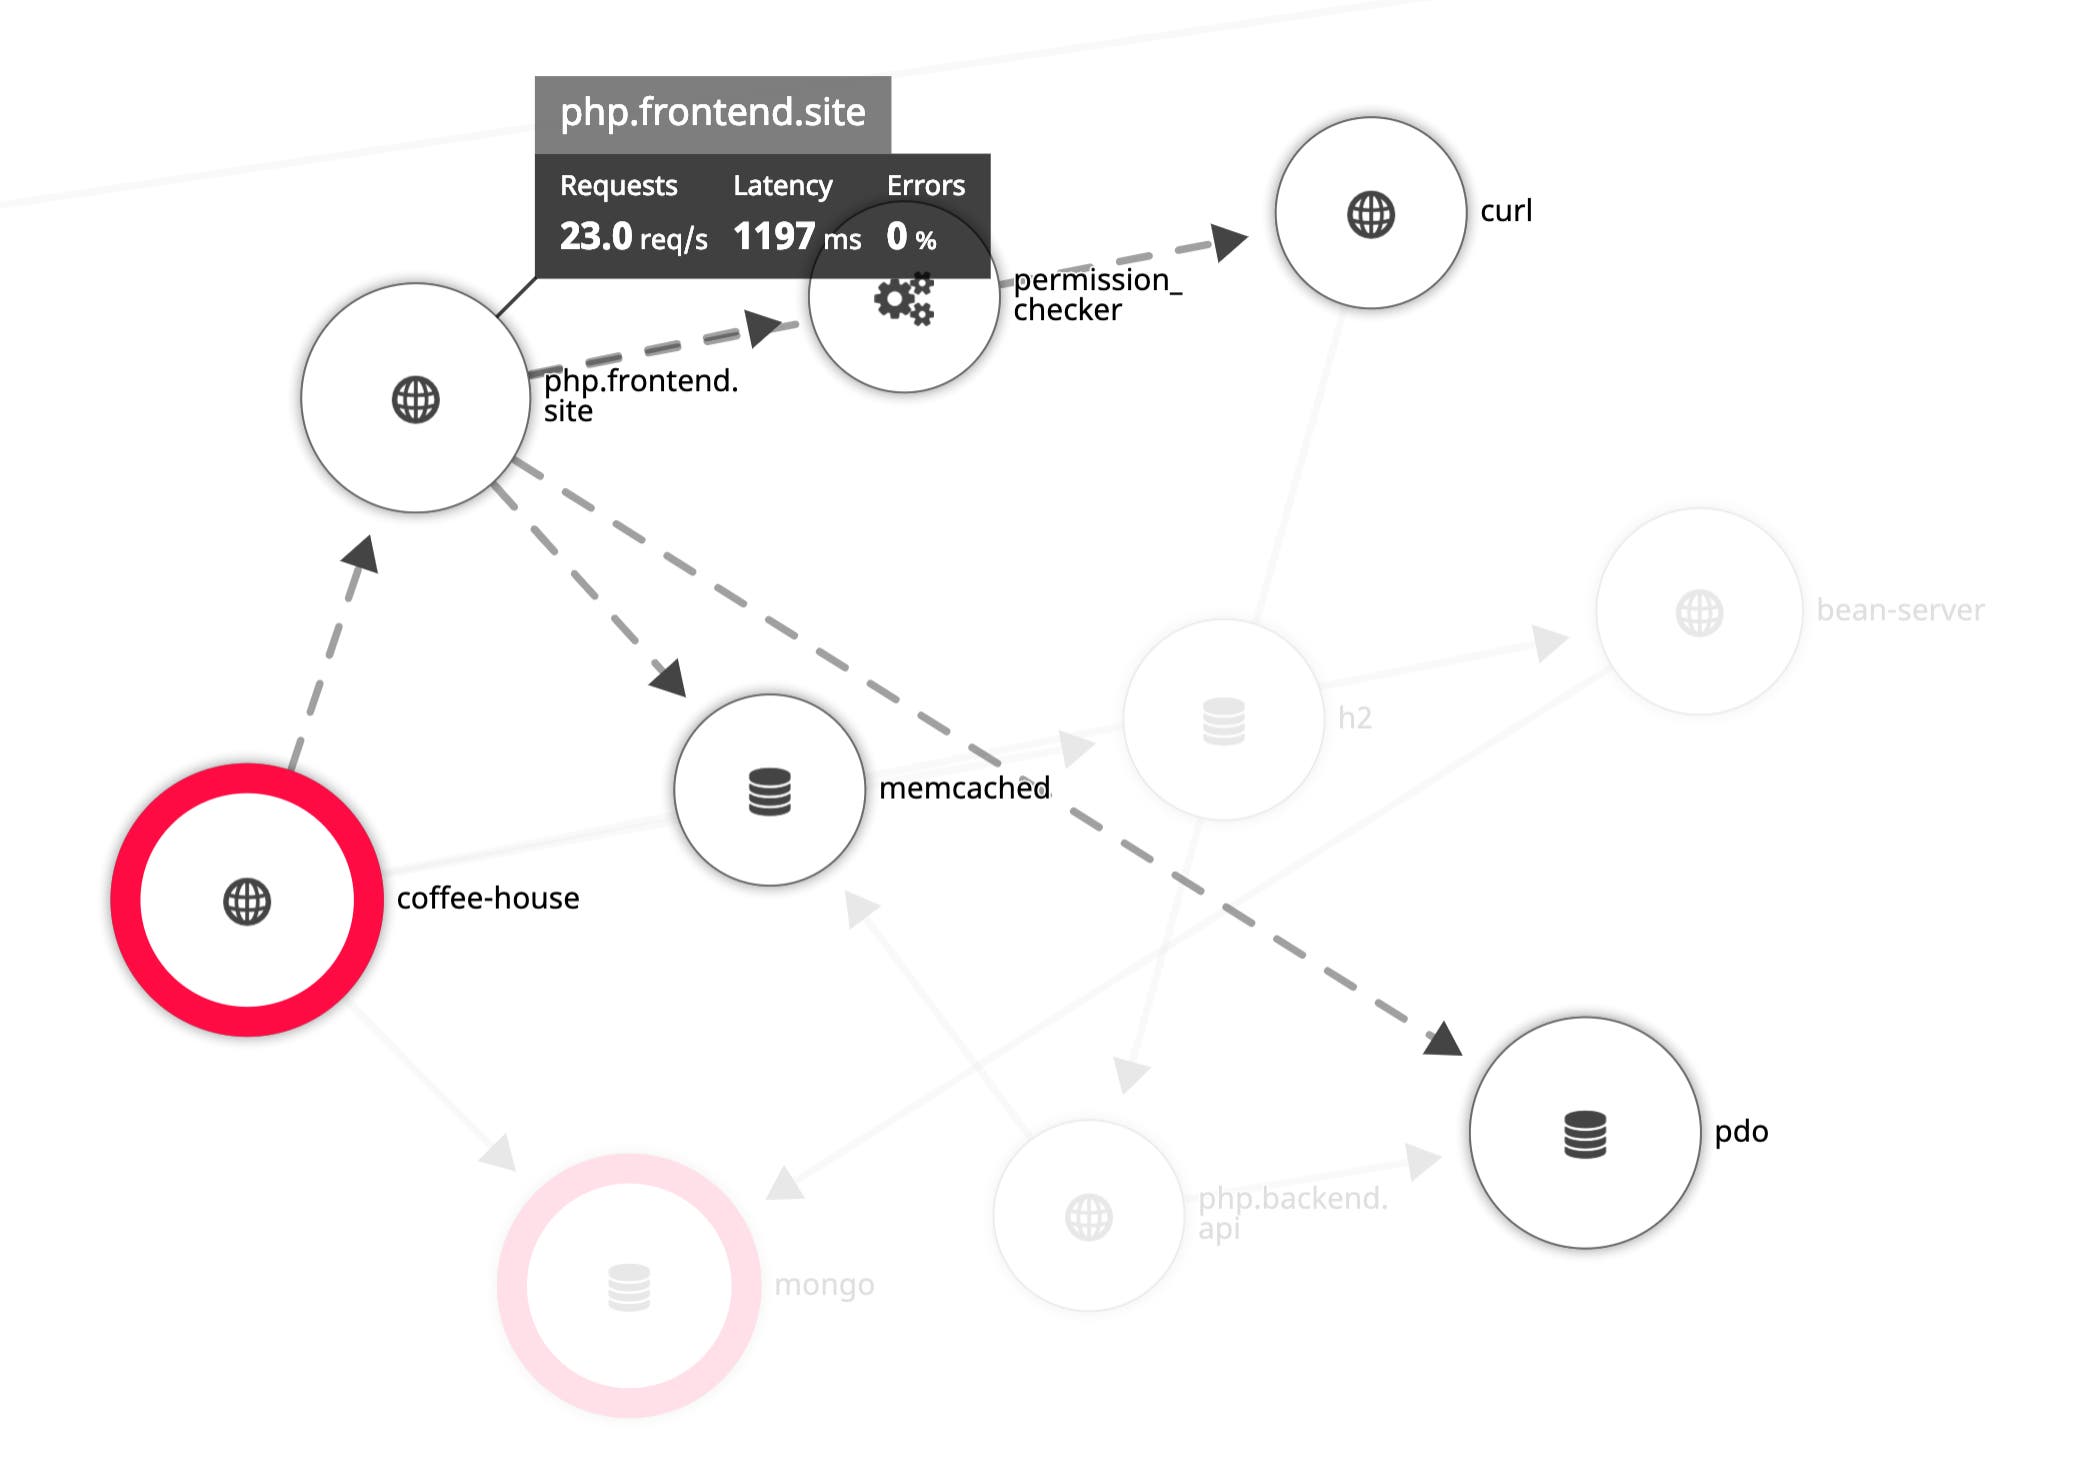
The Service Map helps you understand the intricacies of your application architecture and provides an effective starting point for investigating and troubleshooting issues. At a glance, you’ll see relationships between services, and you can easily drill down to view traces, logs, and underlying infrastructure from any service.
Optimizing PHP performance
Aside from the Service Map, you can use several Datadog APM features to visualize and analyze the performance of your PHP applications. In your Datadog account, you’ll see a high-level performance overview of each service you’re monitoring to help you easily spot issues you may need to investigate. The overview includes high-level metrics (latency distribution, traffic, errors), span-level statistics, and resource-level anomalies.
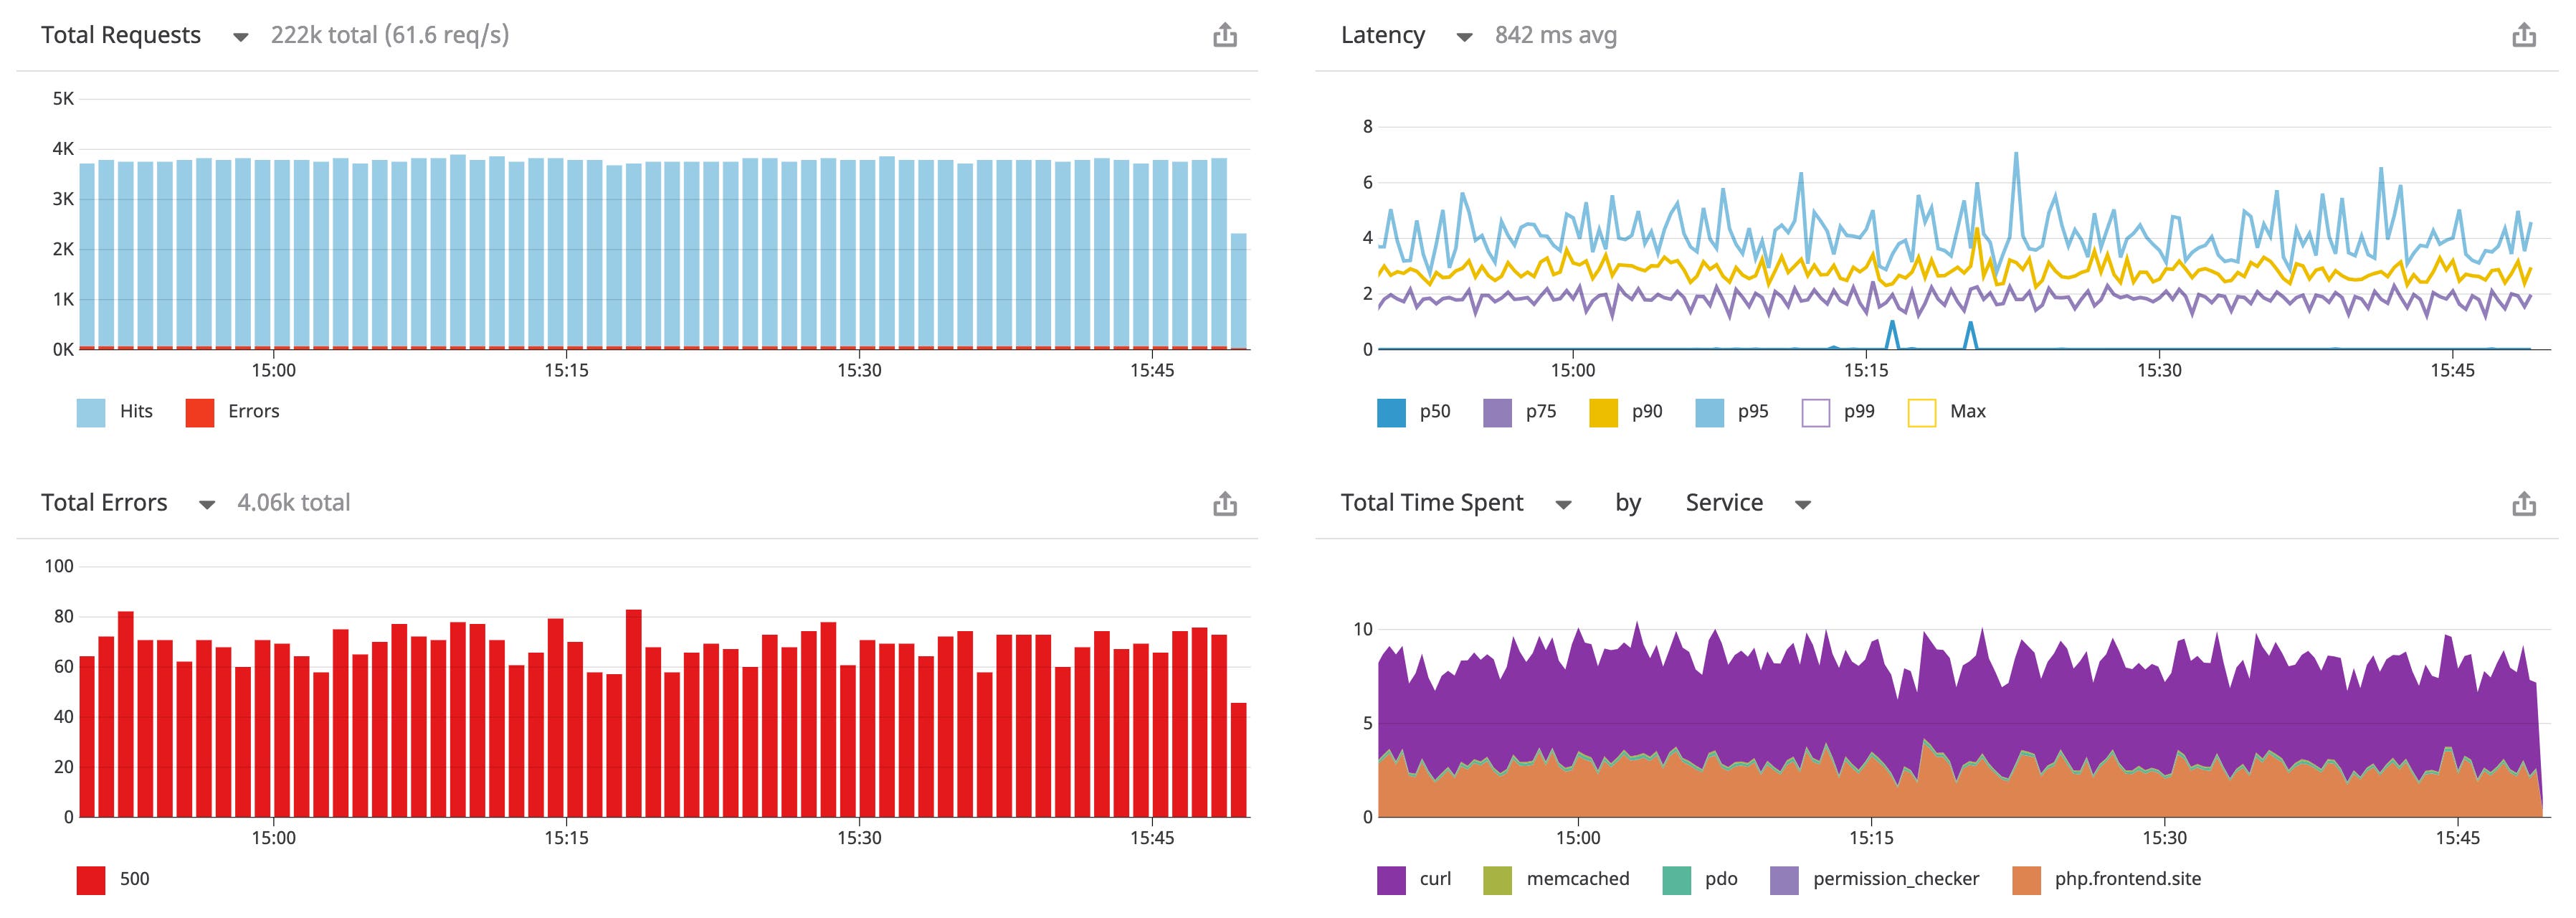
The high-level metrics give an overview of the health of your service and reveal where problems may be occurring. The screenshot below shows an example of a service overview. The graphs on the left show the service’s request and error counts, and on the right, the Latency graph shows the service’s latency distribution over time. The Total Time Spent graph illustrates the total amount of time spent by each service involved in the traced requests (for example, curl and pdo). For more information about this page, see our documentation.
Span summary
The service overview is a great place to determine where to optimize first. When you click on an endpoint, it displays span-level statistics so you can decide which function or service is driving the most latency per request.

Watchdog
One of the first things you’ll notice on the service overview is a list of any anomalies detected by Watchdog. Watchdog autonomously keeps an eye out for performance anomalies in your PHP applications, even if you haven’t defined any alerts. For example, when Watchdog notices an unusual change in the latency of a specific resource, you’ll see a Watchdog story summarizing the details of the anomaly so you can begin to investigate.

Traces and flame graphs
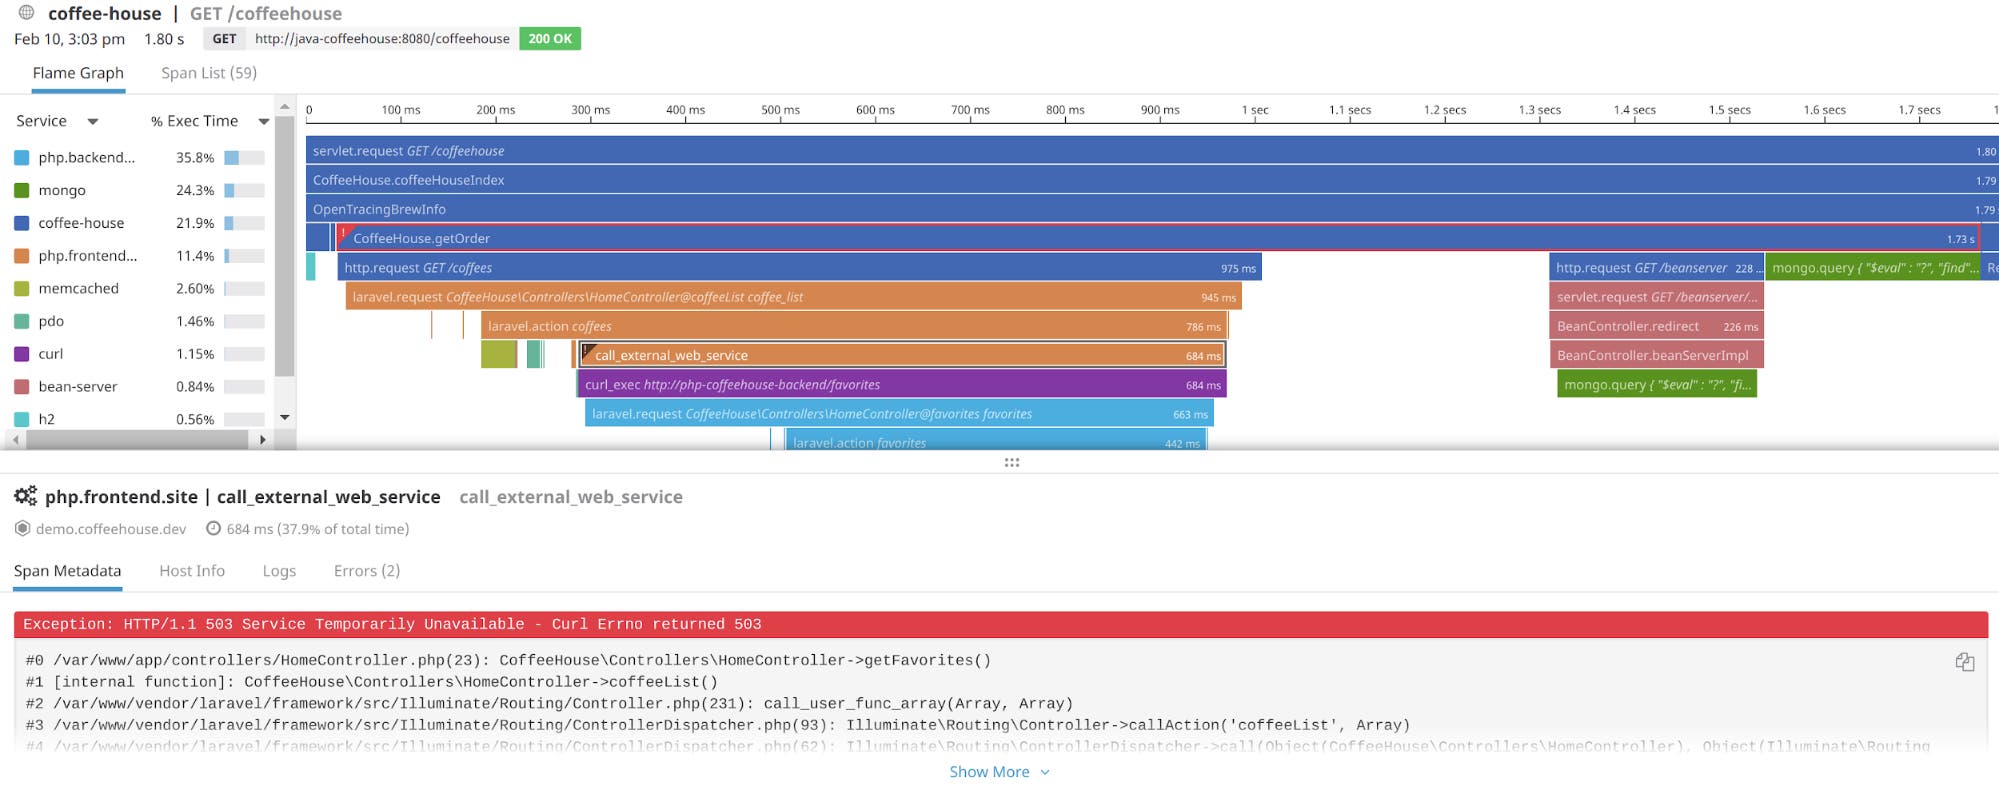
Flame graphs help you visualize the path of requests as they travel across the distributed services in your environment. You can see the details of the service calls your application makes and easily spot any services that respond slowly or return an error. The timeline of the request activity as a whole is called a trace, and each call to a required service within the trace is called a span. If your PHP application times out on an API call, or if a database query is slow, you can click on a specific span of the flame graph to investigate the cause of the delay.
In addition to timing and latency, the flame graph shows you details of each service call involved in processing a request. In the screenshot below, we’ve zoomed to an errored span showing a returned 503 response. Clicking this span, we can see its metadata, including the error message and stack trace.
Correlating traces and logs
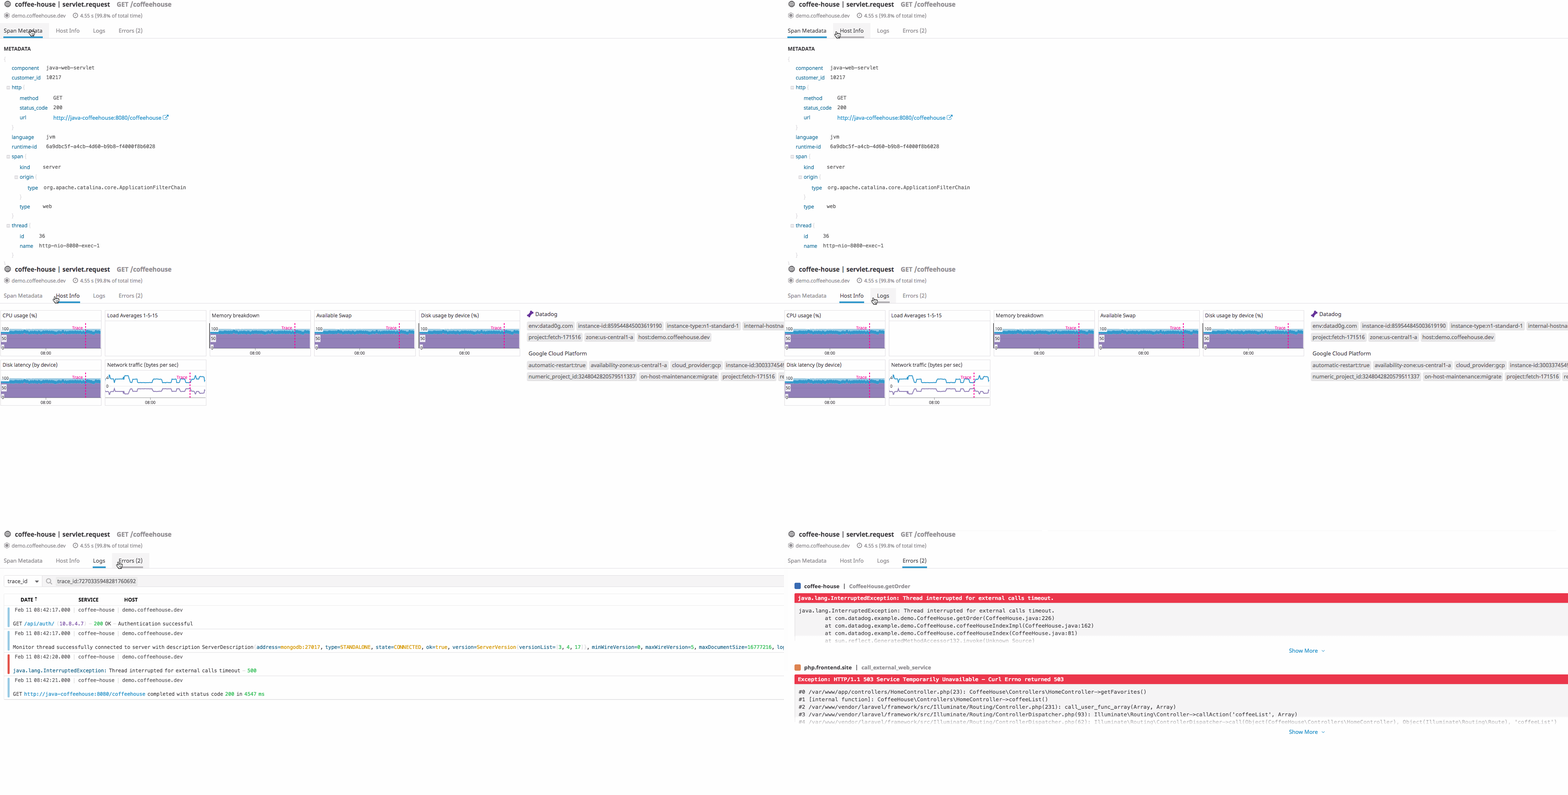
Additional tabs give you further context around the trace. The Host Info tab lets you correlate service performance to that of its underlying infrastructure; Logs shows you any available logs from your services, and Errors aggregates and surfaces any error messages.
Translate application insight to customer-level insight
As your application continues to send APM data, you can use App Analytics to find and display the traces that are useful to you. You can filter traces on tags and facets such as host, environment, customer ID, and the time required to execute a request. In the screenshot below, we’ve filtered by Status Code to isolate traces from a specific service that may provide more information about a 500 error returned by the application.
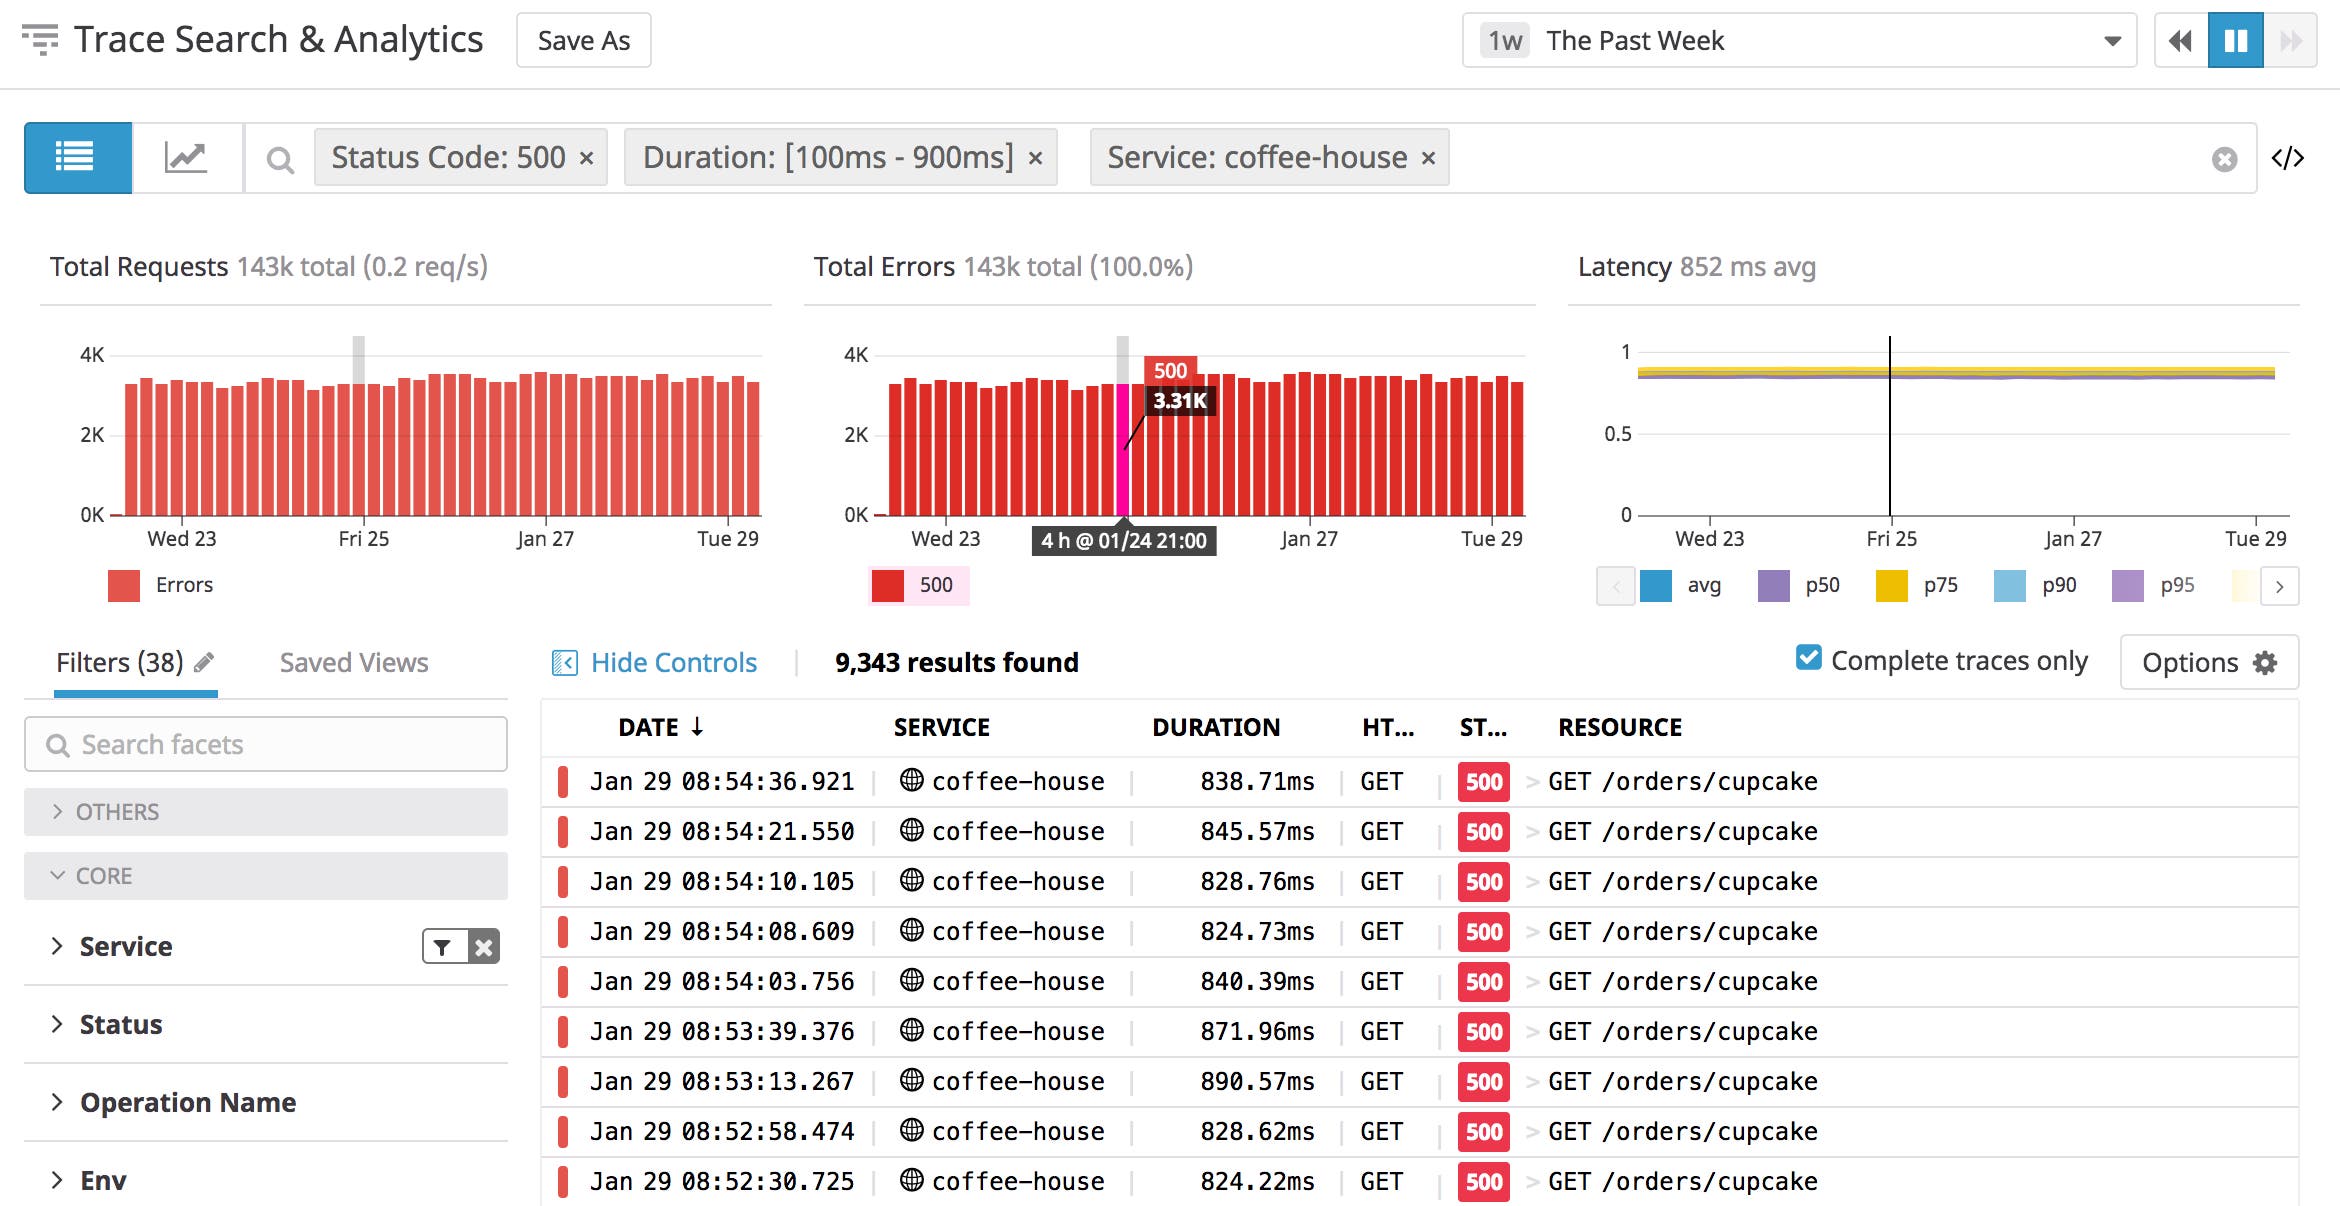
Any tags applied to your application and your infrastructure—including those inherited automatically from your cloud provider—are also applied to your traces and are available to you in App Analytics.
Once you’ve filtered for the traces you want to analyze, you can click on the “Analytics” icon to visualize that trace data as a timeseries and identify patterns in your application performance by user or version. In the image below, we’re graphing the average latency across all services for each customer (org_id).
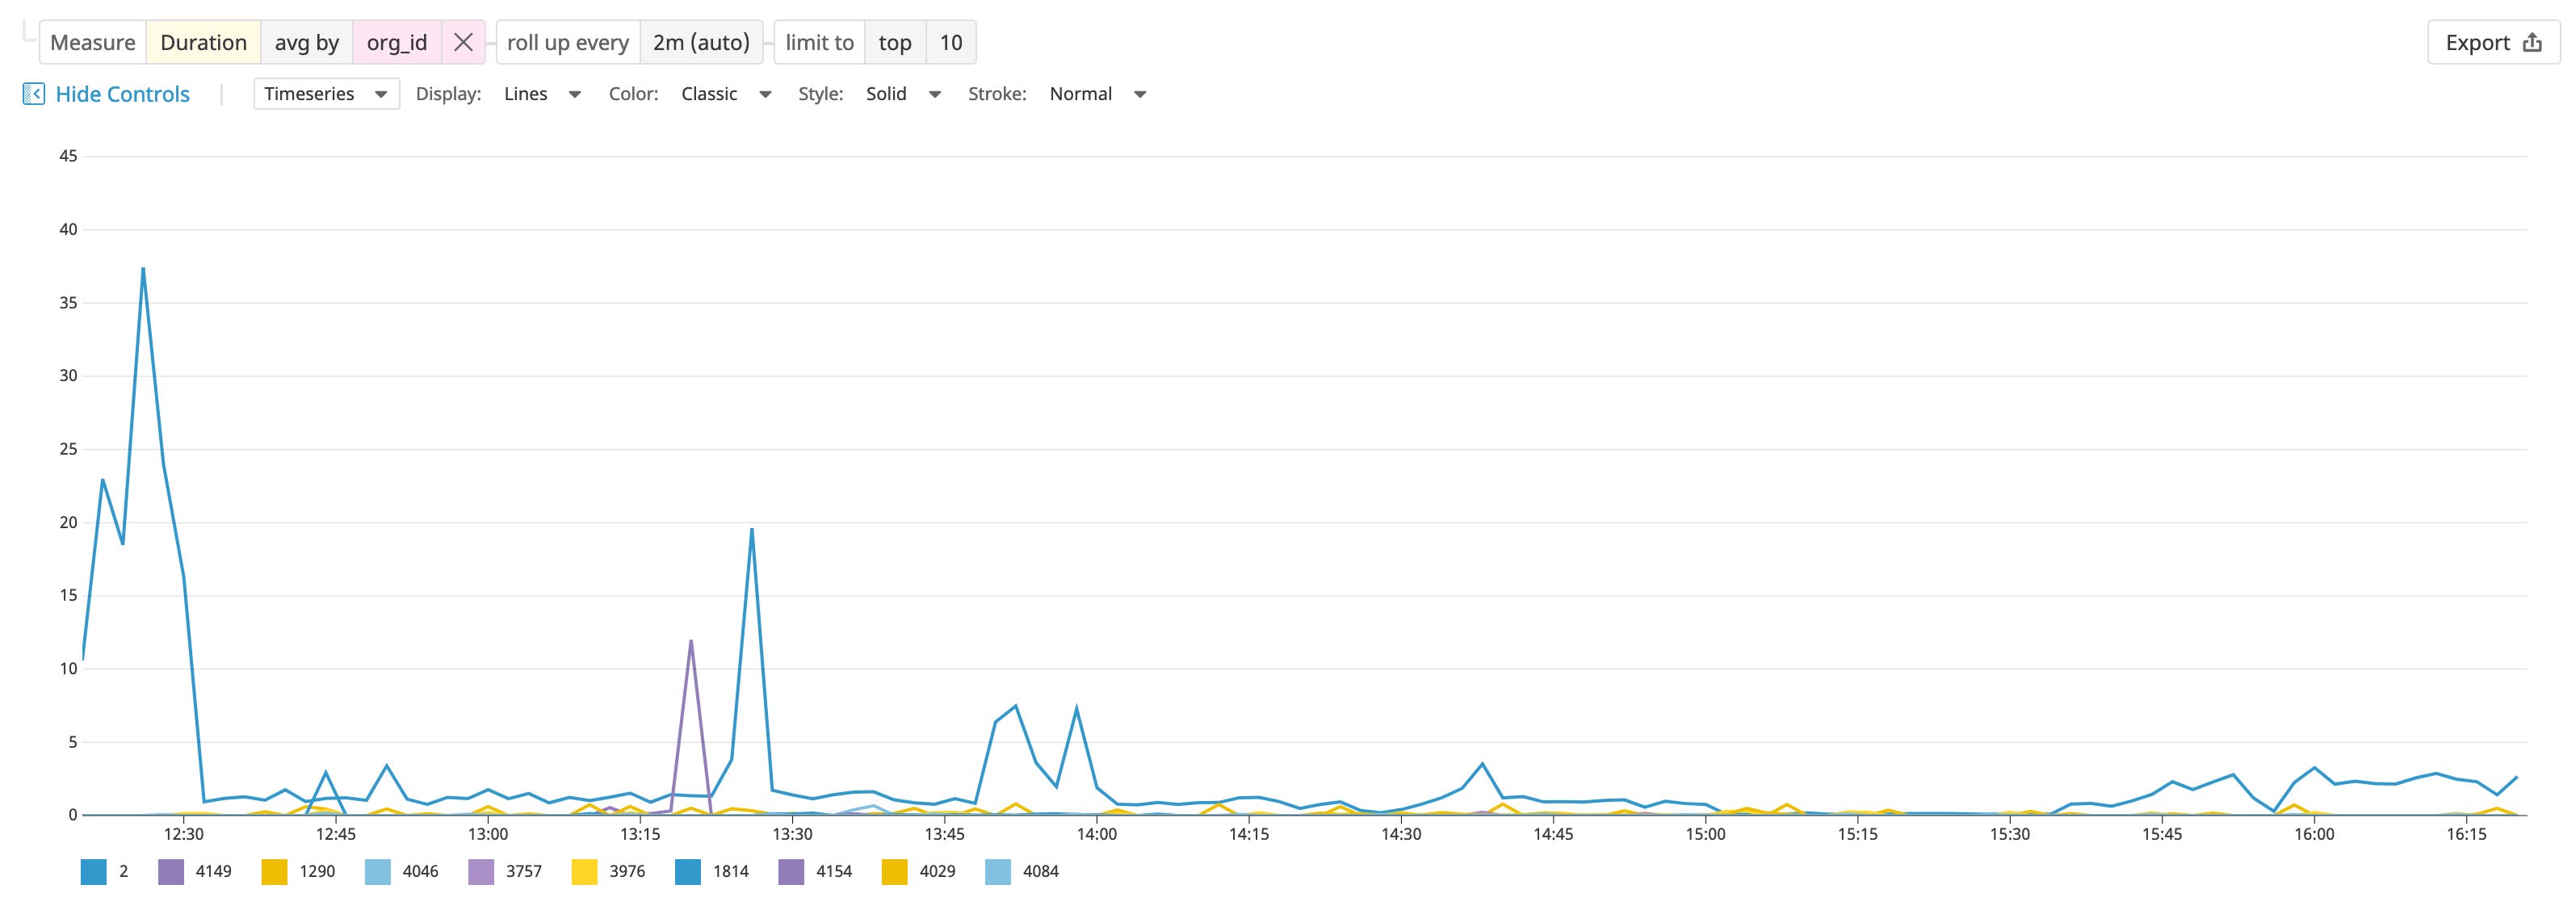
As you can see, App Analytics allows you to understand performance along any high-cardinality dimension. After troubleshooting with App Analytics, you can create a monitor to alert teammates using Slack, PagerDuty, or any other collaboration tool. But it doesn’t stop there—any of the visualizations created through App Analytics can easily be exported to a dashboard.
Flexible dashboards combine app performance, infrastructure, and logs
With the 1,000+ integrations Datadog offers, you can quickly start monitoring every layer of your PHP services, including your web servers (e.g., NGINX and Apache) and databases (e.g., MySQL, PostgreSQL, and MongoDB). Using those integrations, you can monitor your PHP web applications in the context of your LAMP or LEMP stack, all in one place.
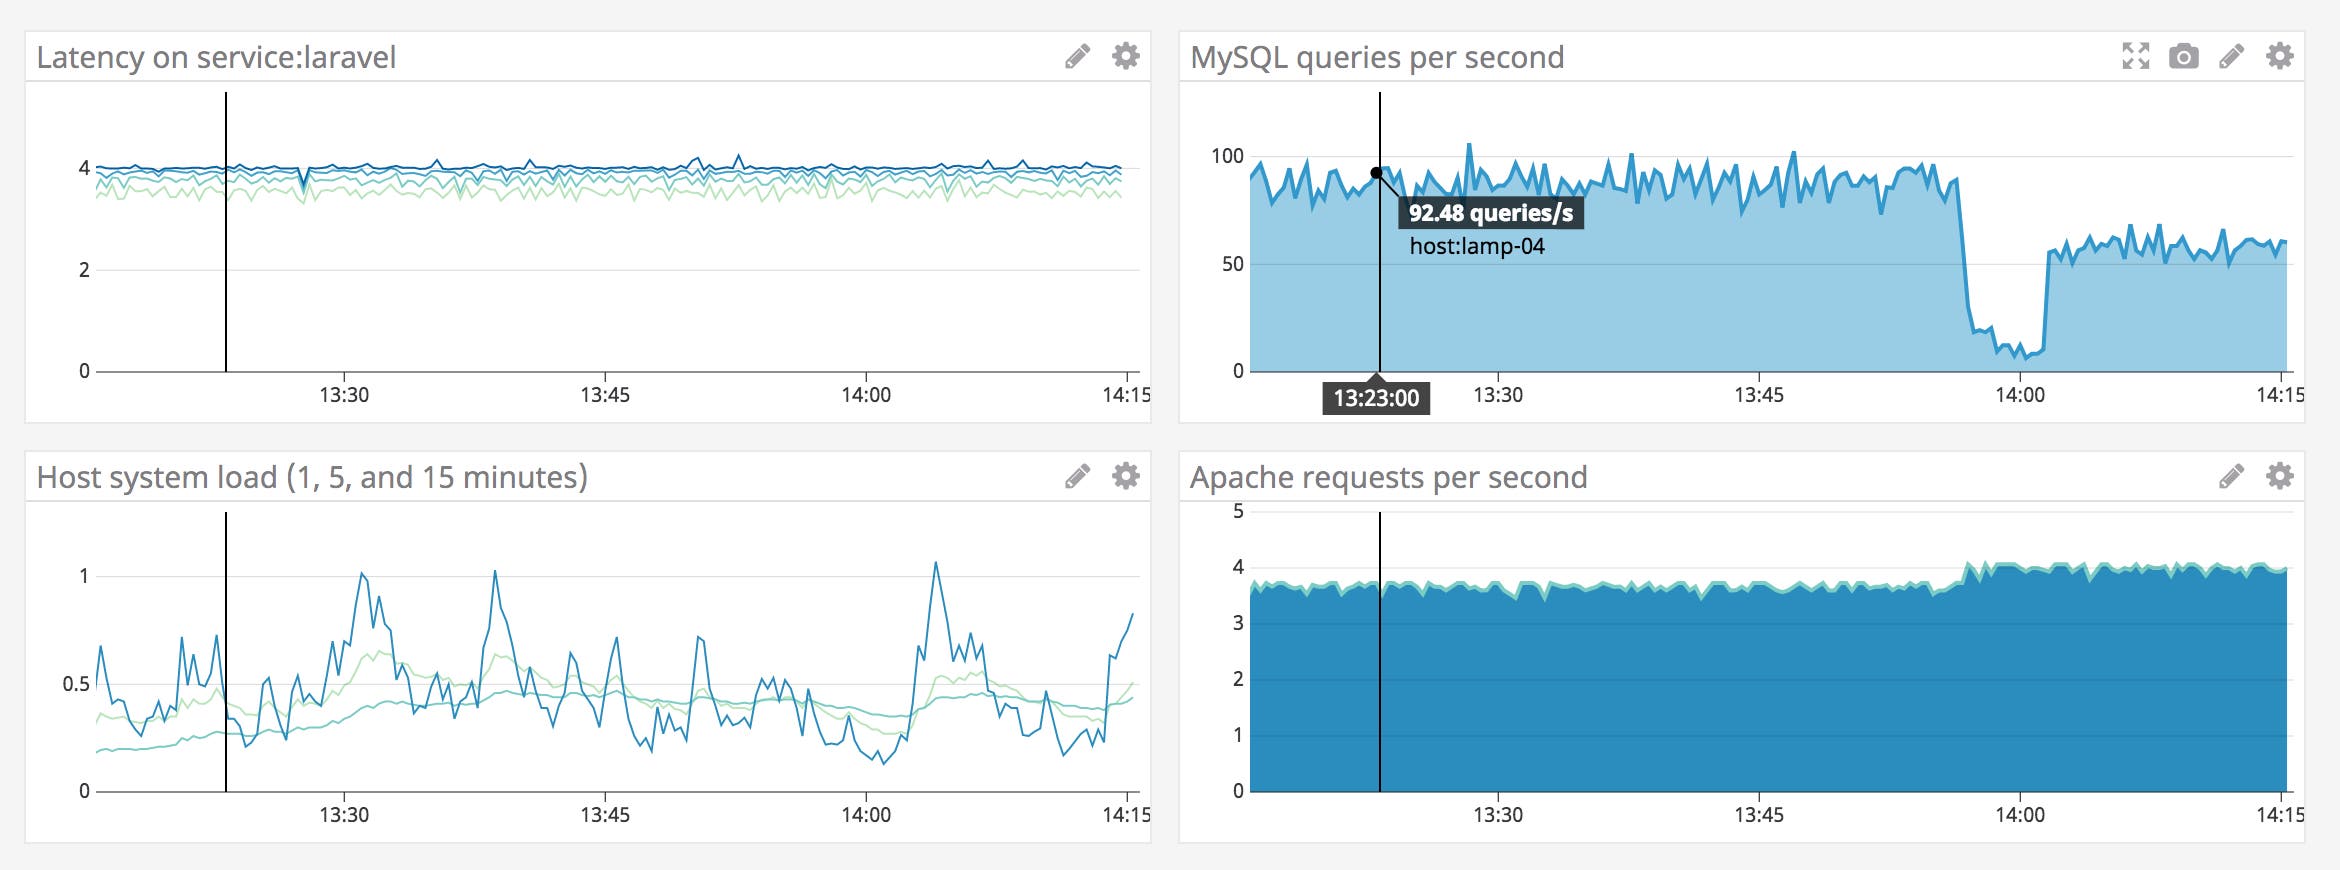
The example dashboard below shows infrastructure metrics and APM metrics alongside graphs from related applications. A dashboard like this one helps you correlate service latency with the load on the host system as well as that of the web server and database. With everything side by side, it’s simple to correlate monitoring data from all the components of your stack.
Monitor PHP with Datadog
Now that Datadog APM includes support for PHP, you can get deeper insights into your LAMP apps as well as any PHP services you operate. To start monitoring your PHP applications, see our documentation. If you’re not already using Datadog, you can start with a free 14-day trial.
