Mallory Mooney
Oracle’s Container Engine for Kubernetes (OKE) is a service that helps you deploy, manage, and scale Kubernetes clusters in the cloud. With OKE, organizations can build dynamic containerized applications by incorporating Kubernetes with services running on their Oracle Cloud Infrastructure.
We’ve partnered with Oracle so that you can use the Datadog Agent to get comprehensive visibility into your Kubernetes clusters on Oracle Cloud Infrastructure. Once you’ve enabled our Kubernetes integration, you can visualize your OKE container infrastructure, monitor live processes, and track key metrics from all of your pods and containers in one place.
How Oracle’s Container Engine for Kubernetes works
Oracle Cloud Infrastructure Container Engine for Kubernetes (OKE) provides a CLI and Console (browser-based interface) for creating and managing Kubernetes clusters. You can set up OKE to automatically provision and launch Kubernetes clusters based on a custom configuration or through a “quick cluster” option in the Console.
When OKE launches a cluster, it creates control plane and worker nodes in a node pool along with all of the network resources needed for that cluster, including a Virtual Cloud Network. You can view more details about the cluster and nodes in the OKE Console, as seen in the example below.
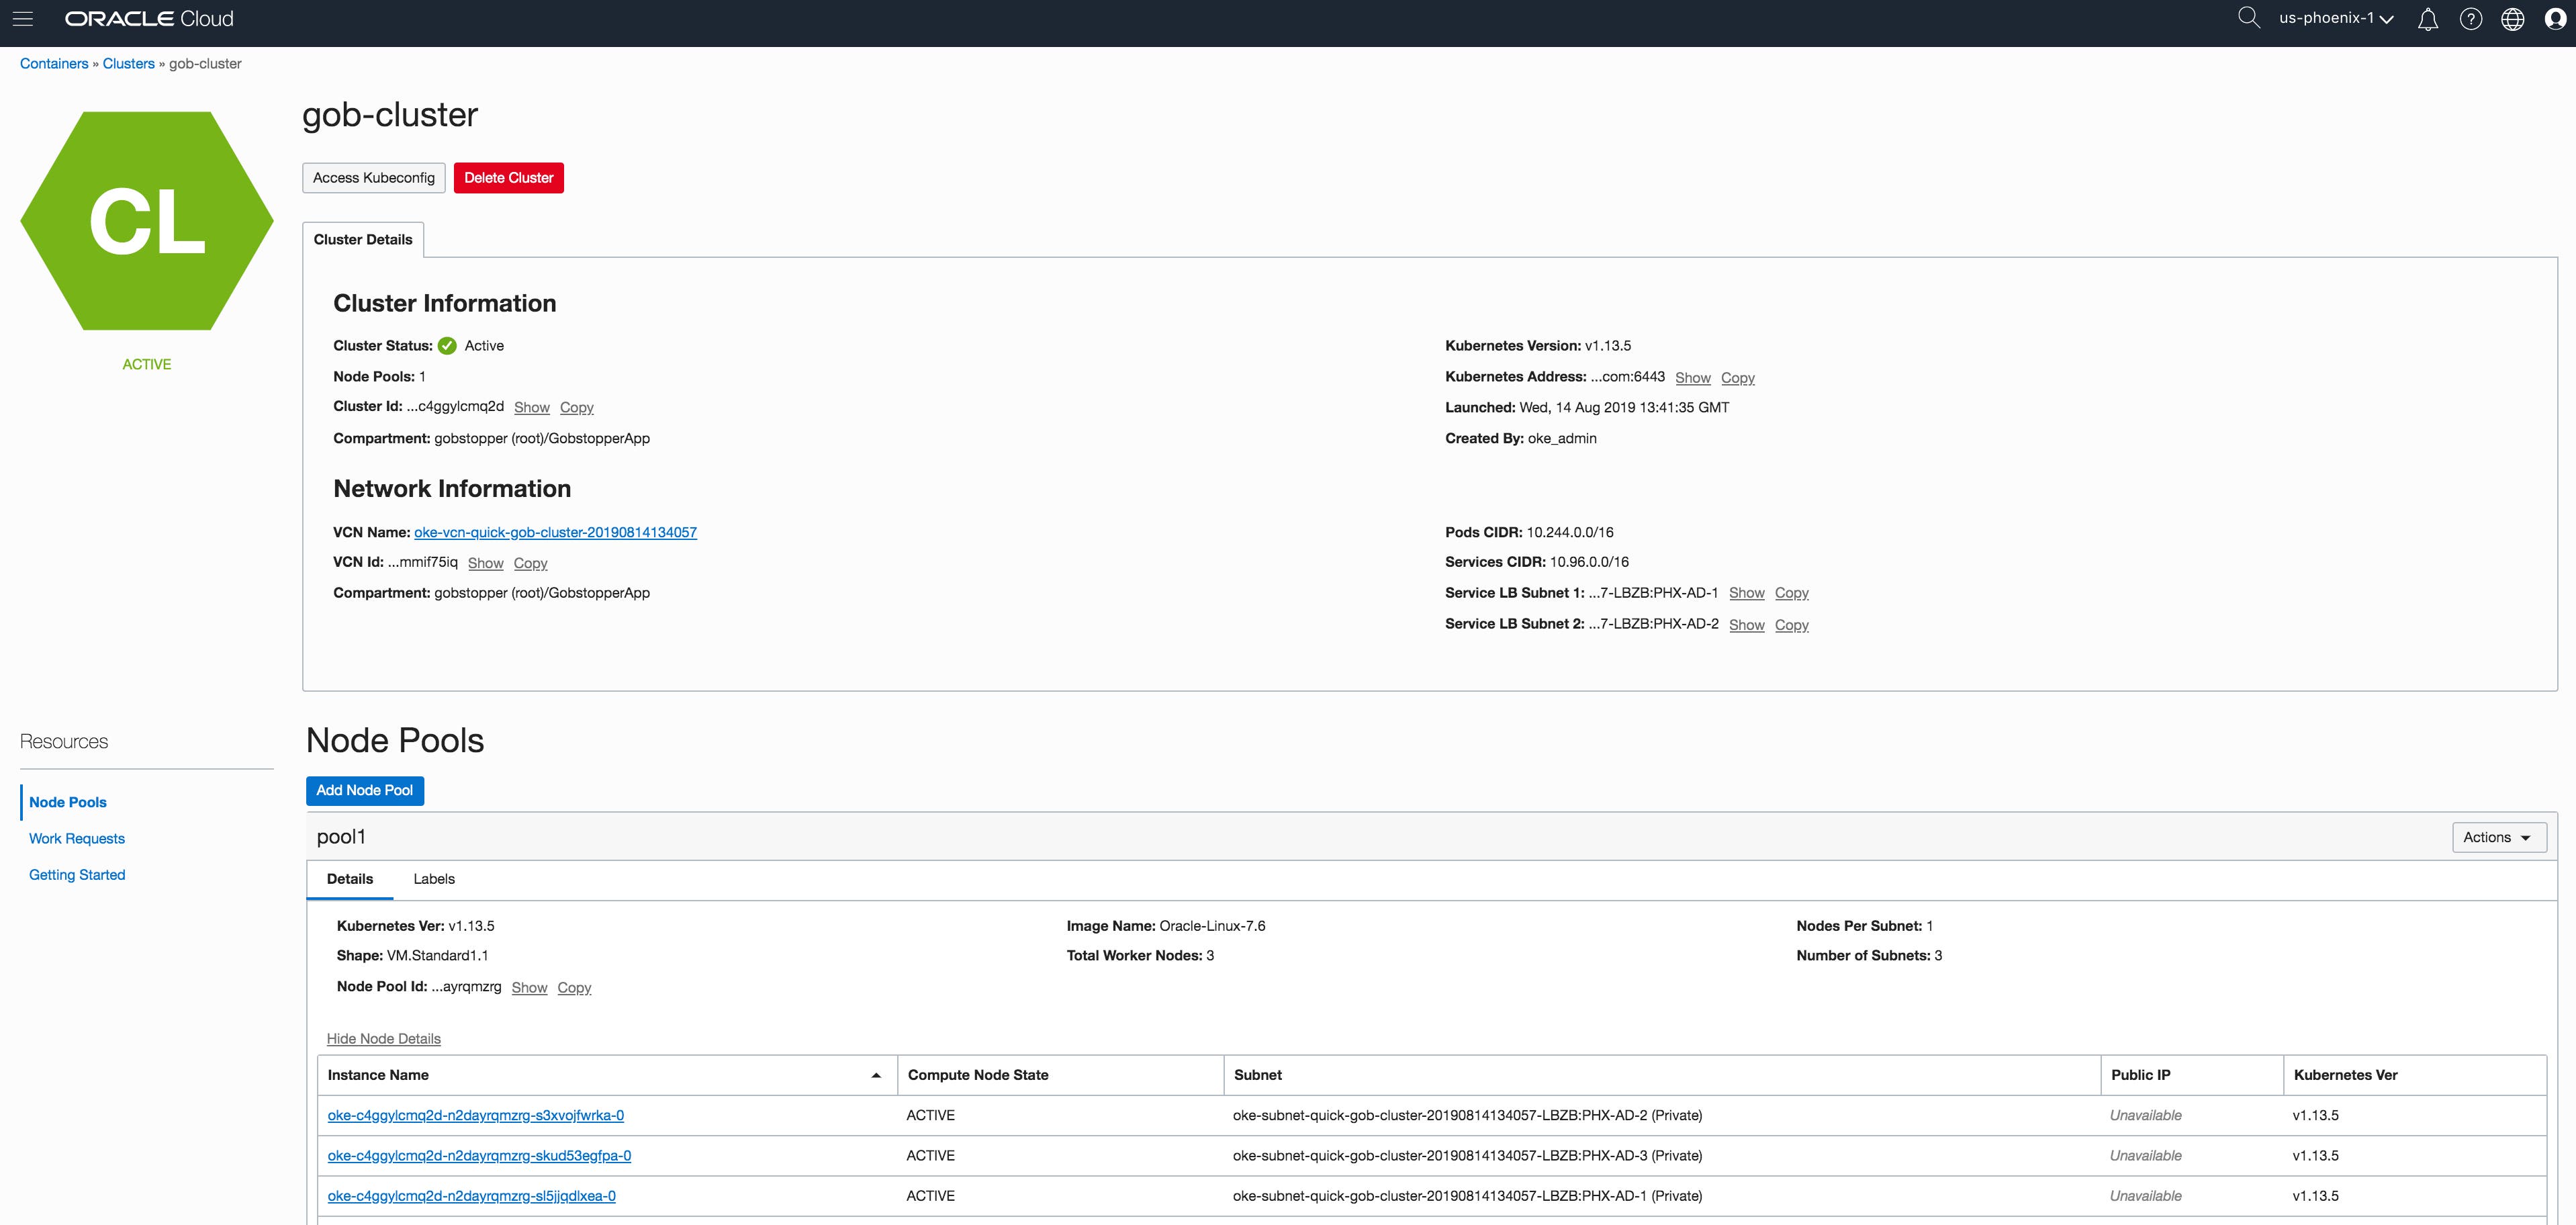
Since OKE is a managed service, you can easily modify your cluster and download your cluster’s kubeconfig file in order to perform additional management tasks with kubectl, including deploying the Datadog Agent.
Monitor your OKE clusters with Datadog
Monitoring Kubernetes is crucial to understanding the health of your dynamic, distributed environment. Once you deploy the Datadog Agent on your OKE cluster, you can track the load on your clusters, pods, and individual nodes to get better insights into how to provision and deploy your resources. In addition to monitoring your nodes, pods, and containers, the Agent can also collect and report metrics from the services running in your cluster, so that you can:
- explore your OKE clusters with dashboards
- monitor containers and processes in real time
- automatically track and monitor containerized services
Deploying the Agent as a DaemonSet via our Helm chart is the most straightforward (and recommended) method, since it ensures that the Agent will run as a pod on every node within your cluster and that each new node automatically has the Agent installed. You can also configure the Agent to collect process data, traces, and logs by adding a few extra lines to a Helm values file.
Explore a high-level view of your OKE clusters
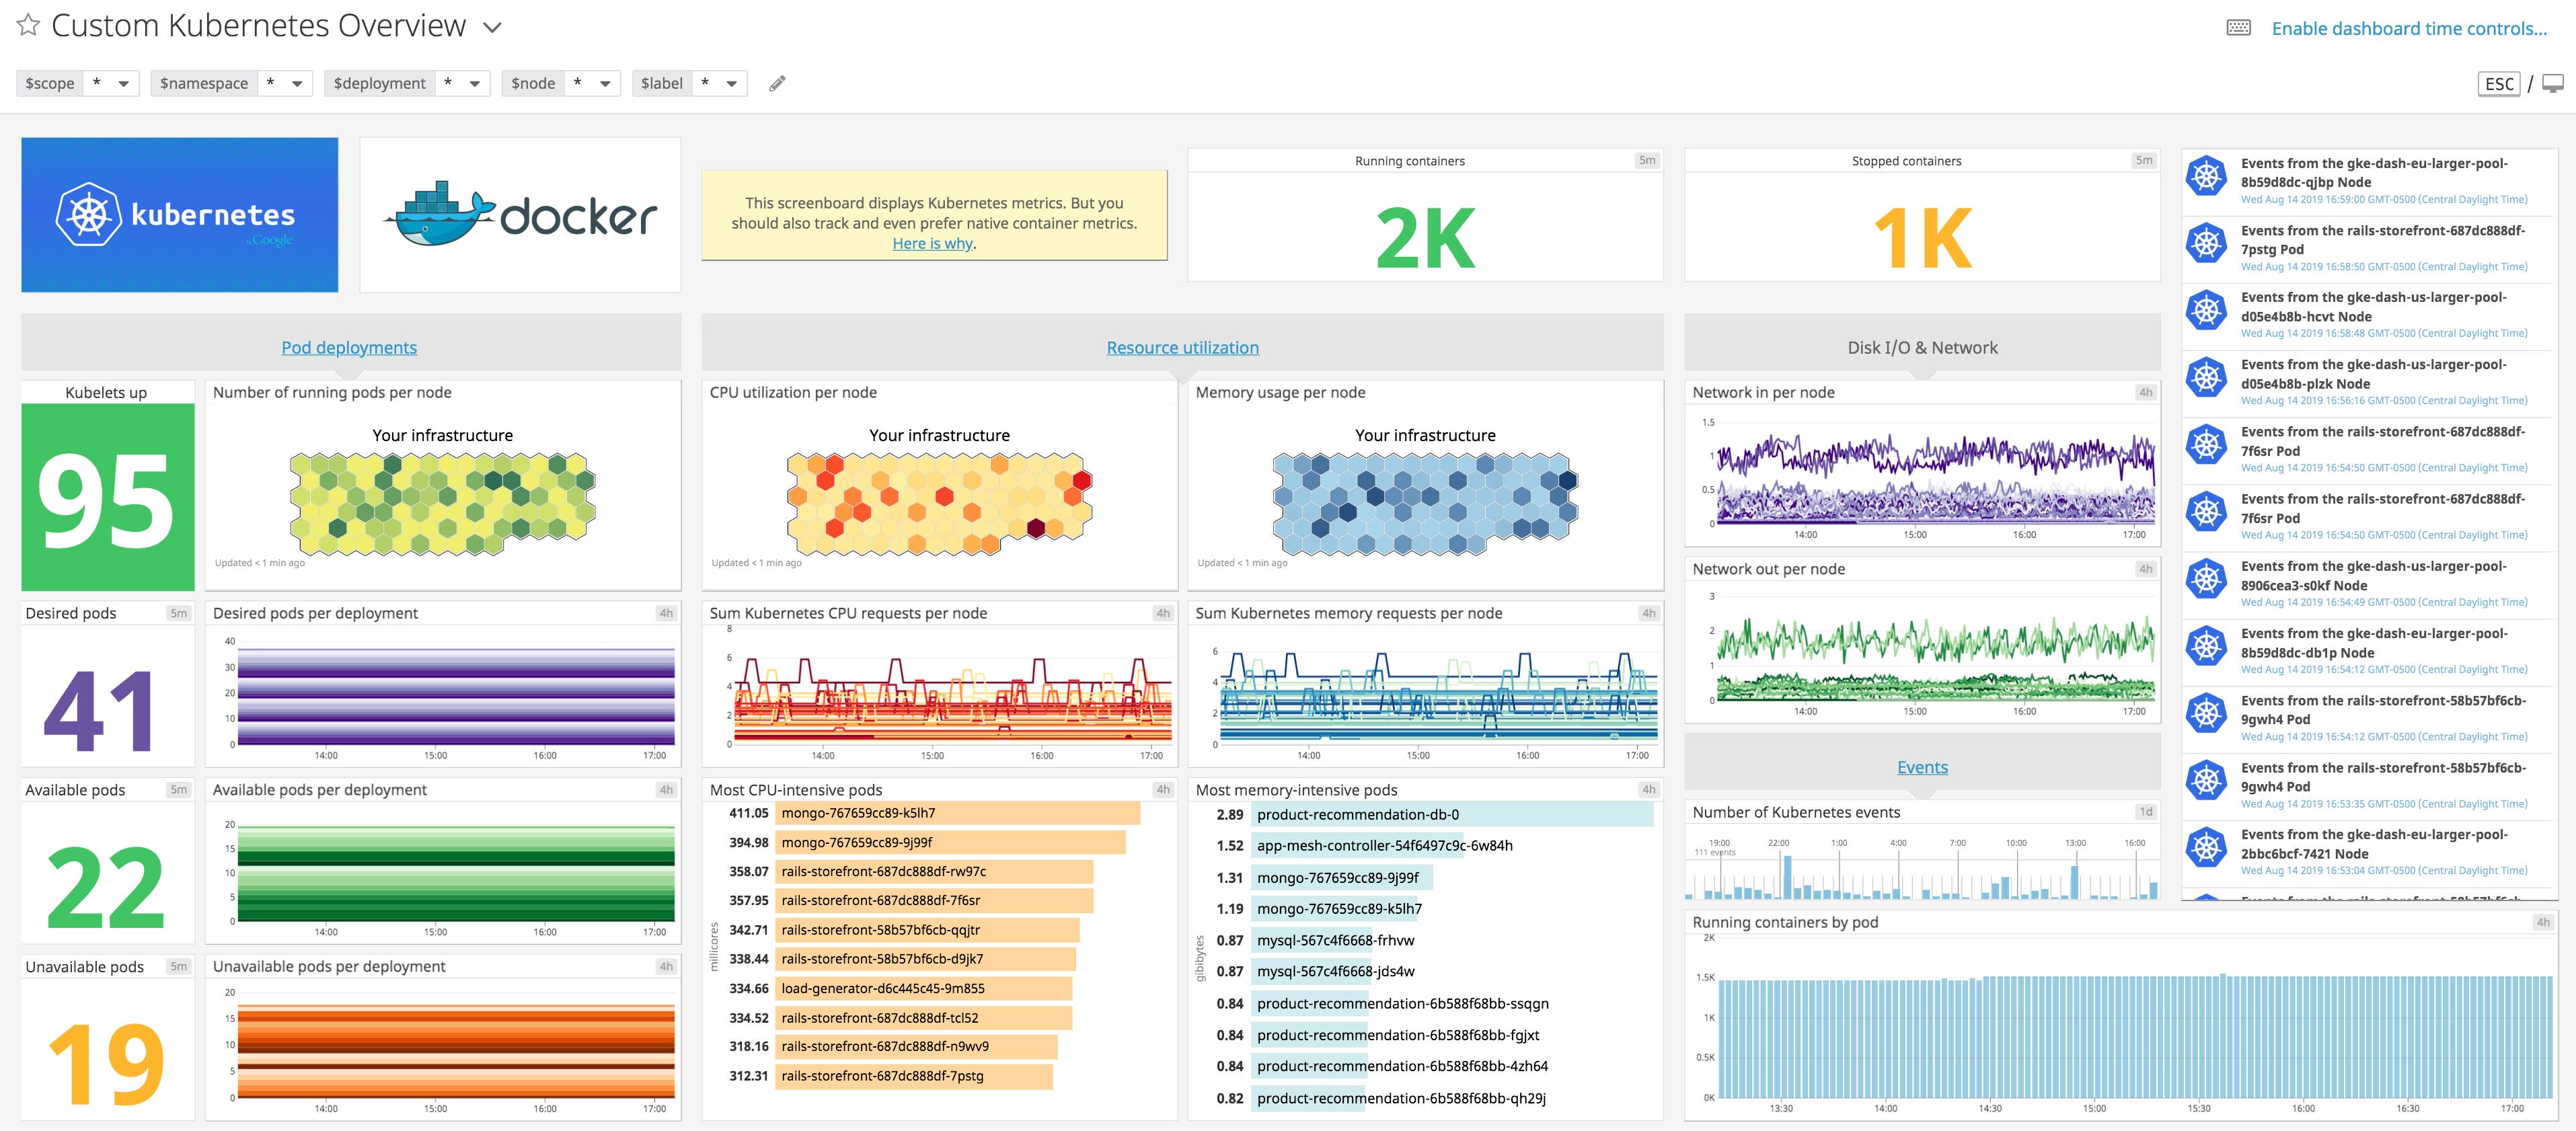
Datadog includes several built-in Kubernetes dashboards so you can monitor your Kubernetes Controller Manager and Scheduler as well as get a high-level view of your pods and kubelets . These dashboards automatically track key Kubernetes events and metrics, including:
- the number of running pods per node
- the most CPU intensive pods
- the number of running containers
You can clone any built-in dashboard and modify it to monitor the data that’s most important to you.
Monitor containers and processes in real time
With Datadog’s Live Container view, you can get detailed insights into your containers’ resource consumption, logs, and health in real time. Regardless of the size of your Kubernetes deployments on Oracle Cloud Infrastructure, you can quickly drill down to inspect any container (or a group of containers) when you need to troubleshoot an issue.
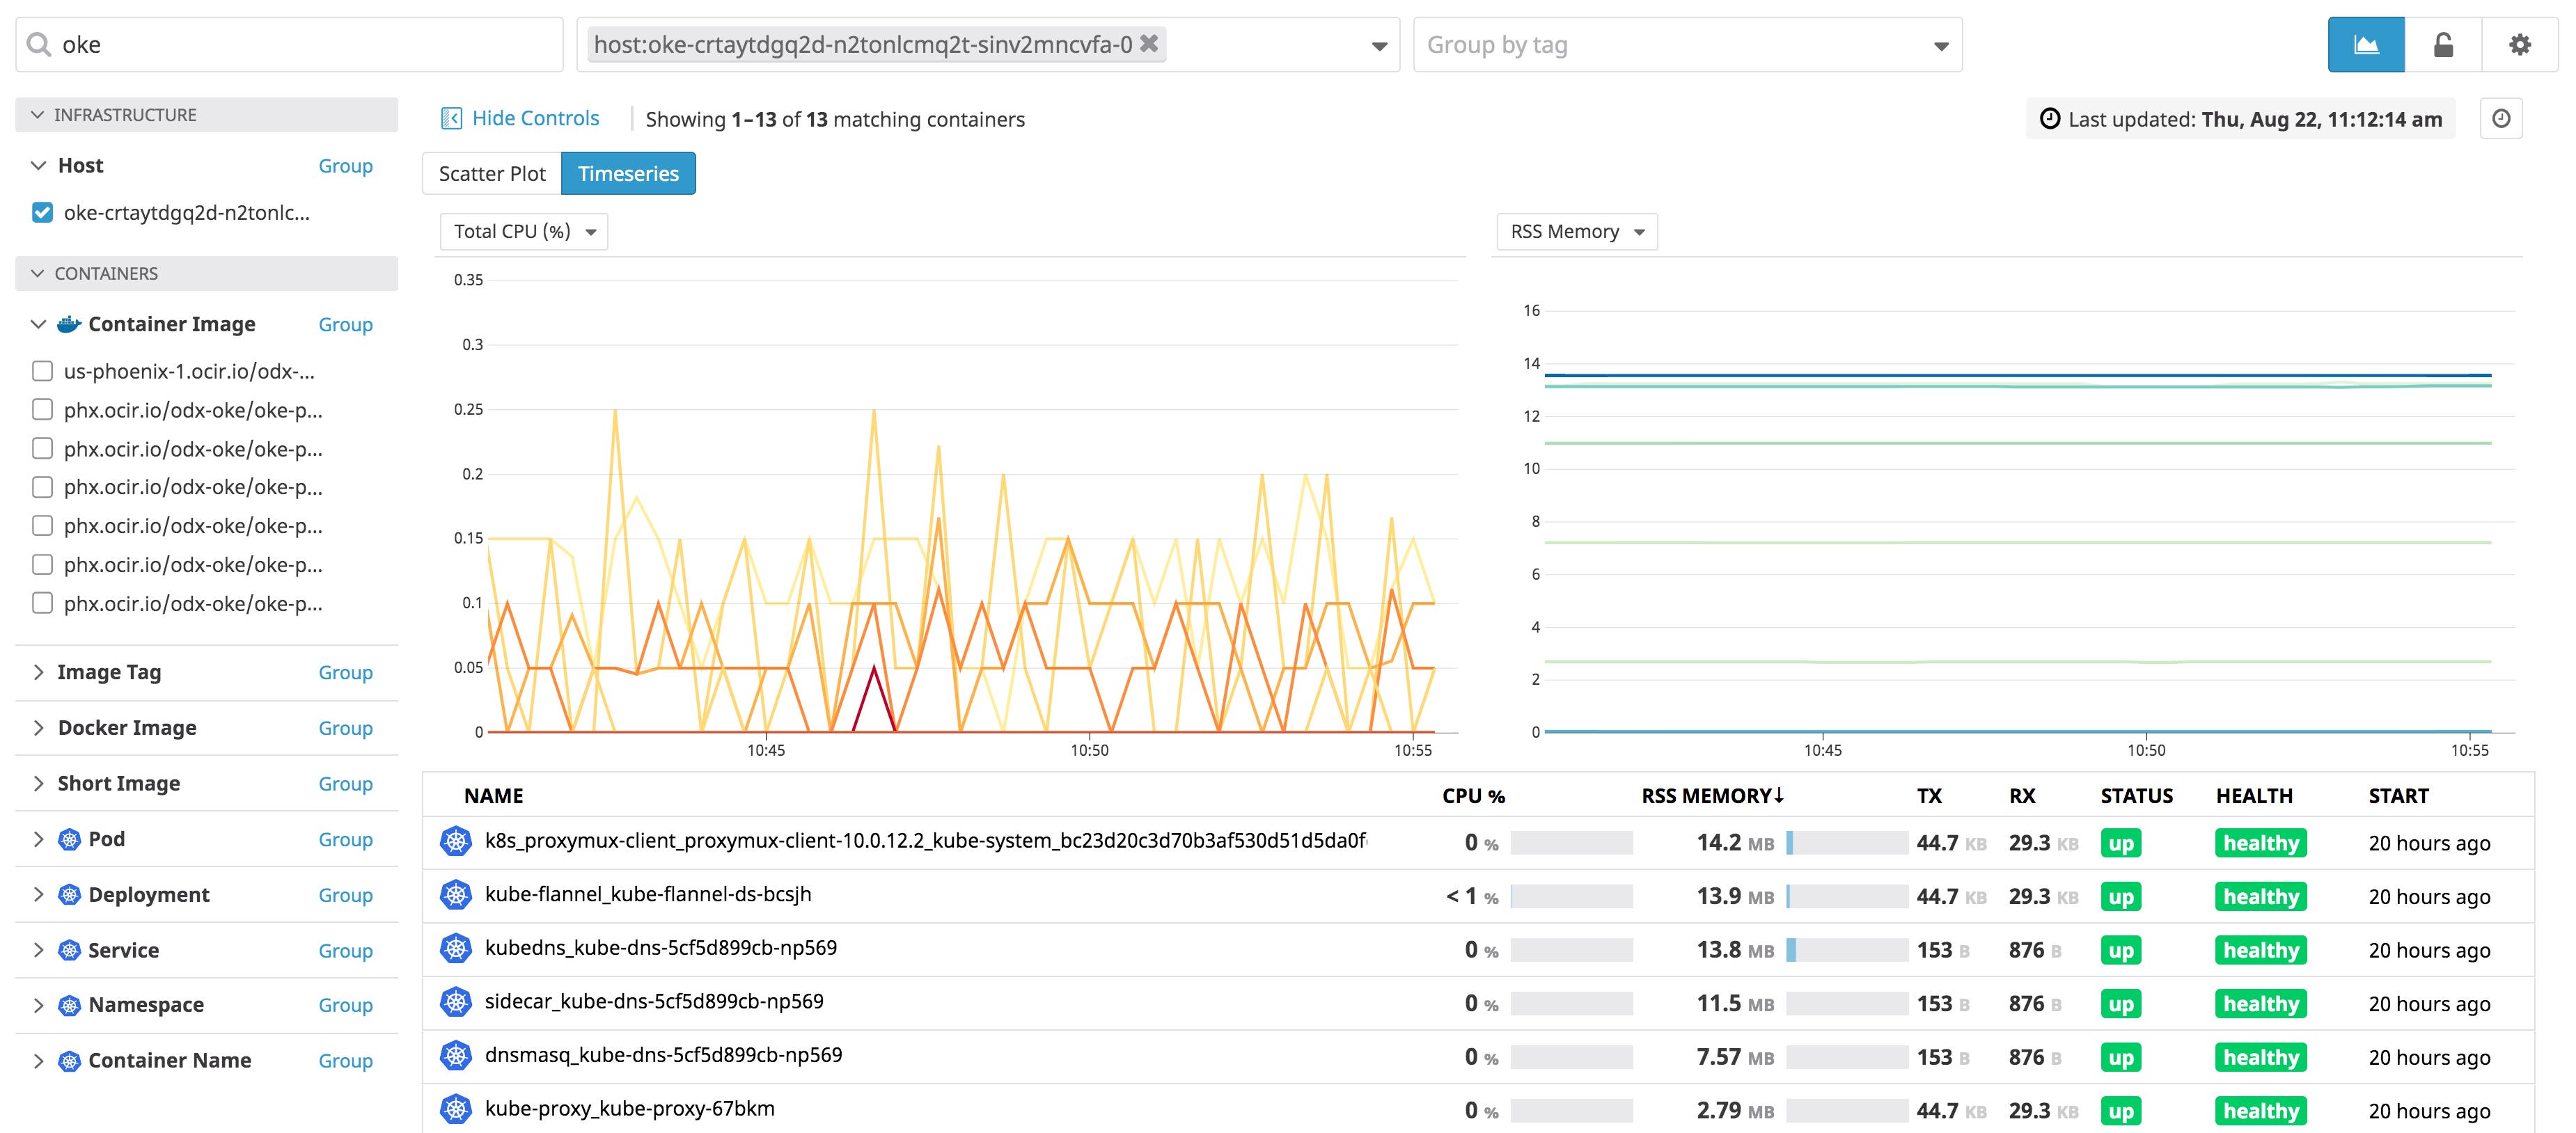
Datadog organizes your data with tags, including metadata that the Agent automatically extracts from Kubernetes (e.g., pod_name, container_id, docker_image, kube_deployment). These tags help you search, filter, and group all of the containers in your OKE cluster in Datadog. The example below shows all containers running from a single deployment, grouped by host.

If you select a specific container, you can view its resource metrics (at two-second resolution), running processes, and logs. From there, you can pivot to a host dashboard as well as other related logs and processes collected by the Agent. This provides you with more context as you monitor your systems and debug issues.
If one of your containers begins consuming too many resources, you can dig into its processes to determine which one is causing the problem through Datadog’s Live Process view. For example, you can track all running processes for a single OKE node.
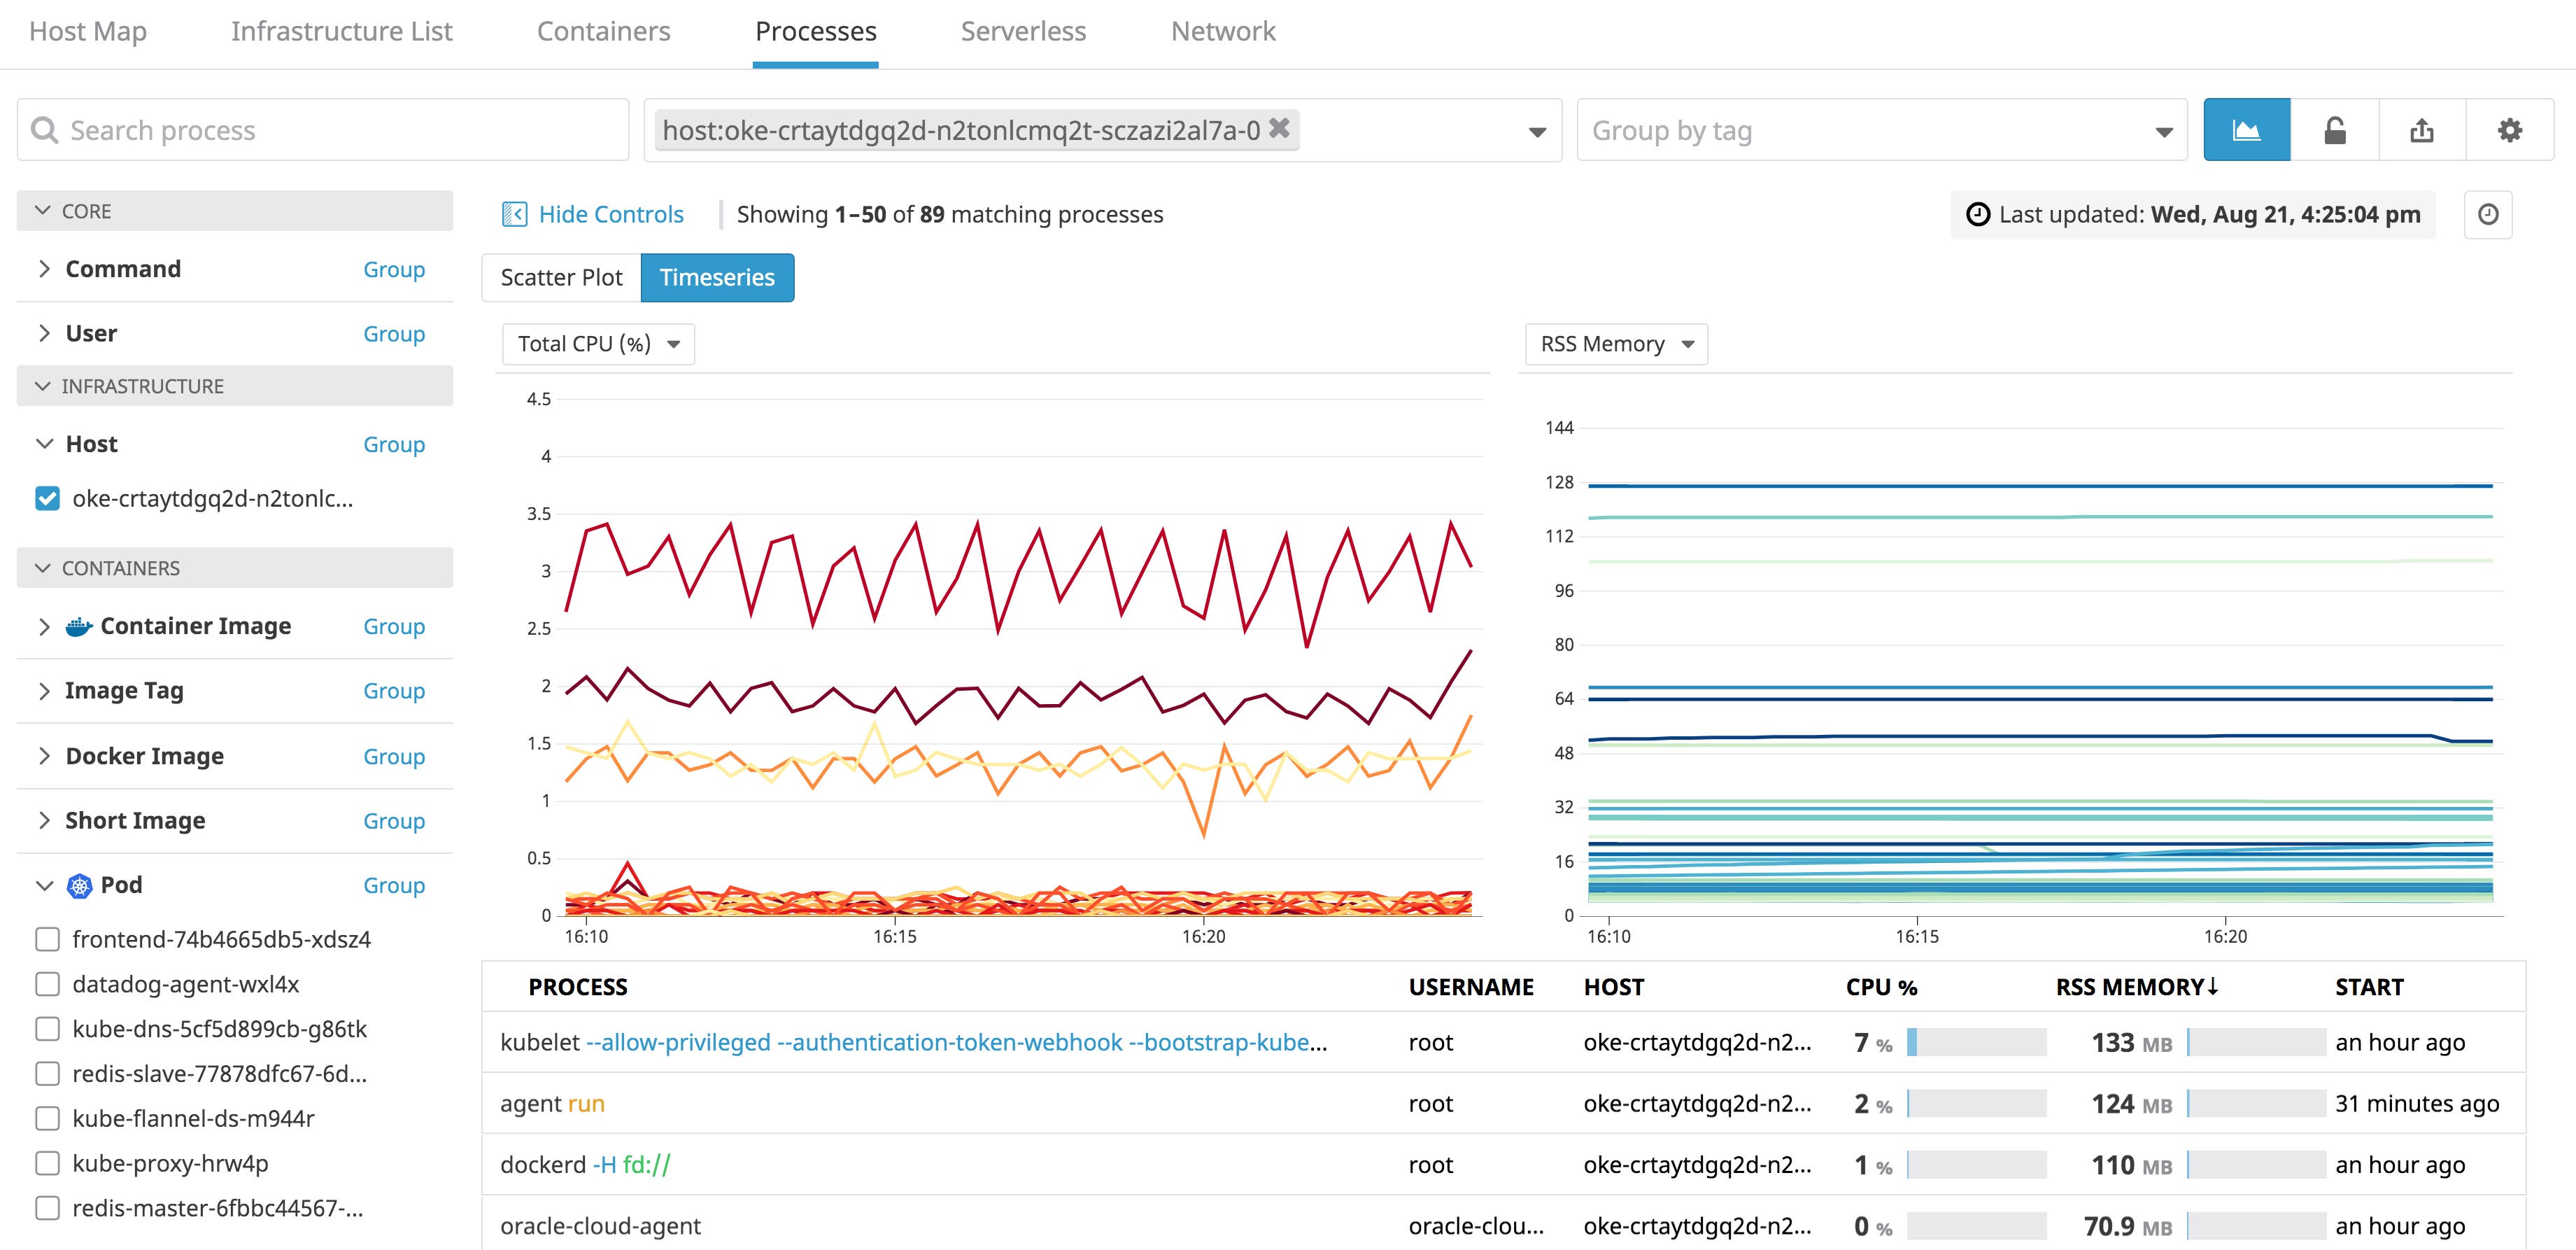
This view enables you to easily visualize resource consumption (e.g., total CPU, RSS memory) for processes within a single container, using any of the tags that are automatically pulled from Kubernetes.
Autodiscover containerized services
As your infrastructure grows, tracking its many moving pieces becomes more difficult as containers are created (or destroyed) and move across nodes. The Datadog Agent’s Autodiscovery feature helps you stay on top of the containerized services running in your dynamic environment. Once enabled, the Datadog Agent will automatically collect and report on data from the services running on the containers in your OKE cluster (e.g., Cassandra, Redis, PostgreSQL), even as they move across your infrastructure. And, if a container shuts down or is destroyed, the Agent will disable checks for those containers. Autodiscovery helps you monitor only the resources you need so you can be confident in knowing that the data you see in Datadog is the latest.
Know what’s going on with your OKE clusters
With Datadog, you can get deep visibility into all of the Kubernetes clusters running on your Oracle Cloud Infrastructure, alongside more than 1,000 other technologies running in your environment. If you already use Datadog, check out our Kubernetes documentation to learn more about how you can seamlessly monitor your OKE clusters alongside the rest of your infrastructure. Otherwise, sign up for a free trial of Datadog to get started.
