John Matson
Editor’s note: Mesos uses the term “master” to describe its architecture and certain metrics. When possible, Datadog does not use this term, so in this post we will use “leader” instead.
Apache Mesos is an open source cluster manager for scheduling and managing distributed applications. Mesos allocates resources such as CPU and RAM almost as if the entire cluster were a single machine.
Mesos was built to run high-scale distributed applications such as Spark, Hadoop, and Kafka. And although it predates the explosion of container technologies over the past few years, it is often used to launch and orchestrate clusters of Docker containers.
See the whole cluster
Mesos can help you efficiently allocate resources from your cluster to the applications that need them, but seeing what’s happening across the entire cluster can be a challenge. That’s why we added Mesos to the list of 1,000+ technologies that Datadog natively monitors.
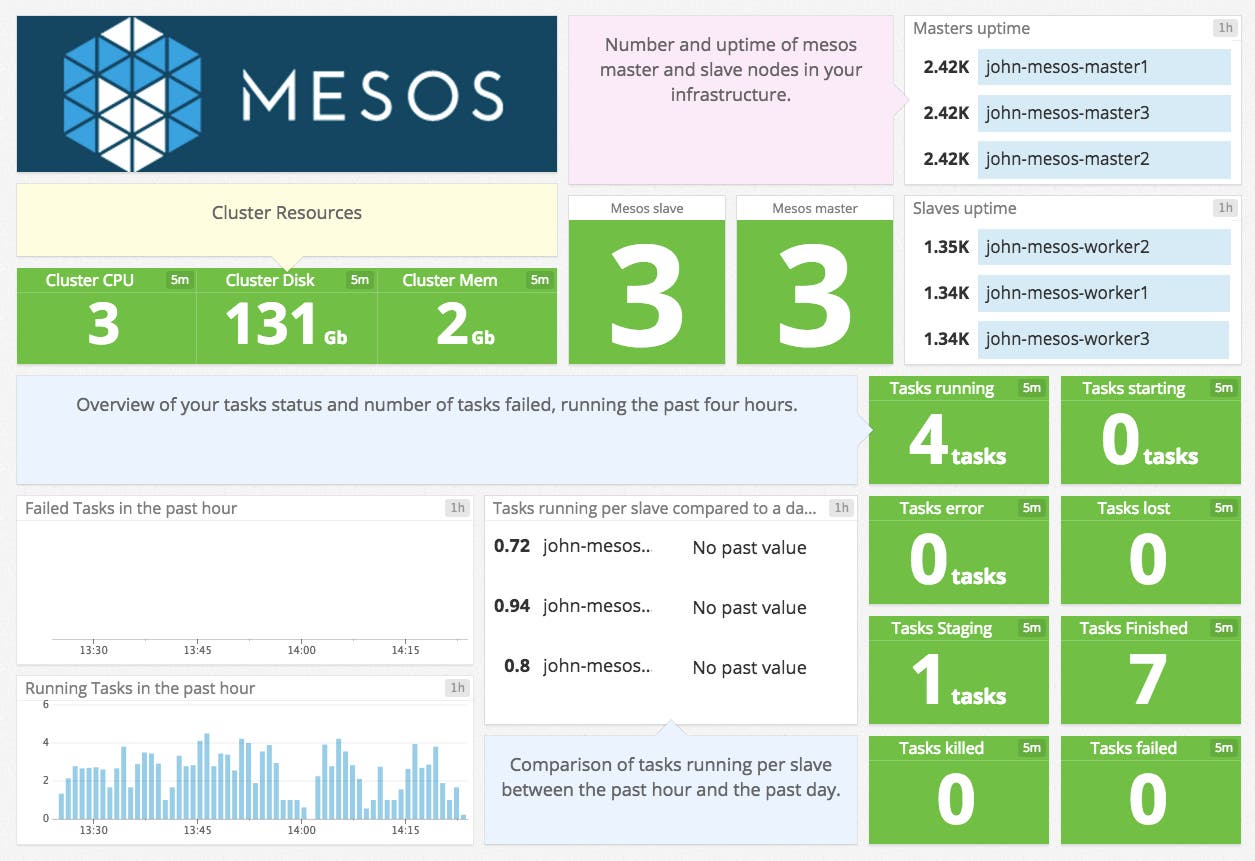
Datadog makes it simple to aggregate metrics from all your Mesos nodes so that you can see, for example, whether the cluster has enough capacity to support your workload or whether it should be scaled out. You can then dive in to see real-time and historical metrics from any node or subset of nodes in your cluster, as well as from any of the services running on those nodes.
Our integration with Mesos collects more than 100 metrics from the leader nodes that orchestrate tasks and the agent nodes that run those tasks. The metrics include resource metrics such as CPU, memory, and disk utilization, as well as more targeted metrics around task execution (tasks finished, failed, killed, etc.).
Monitoring Mesos and friends
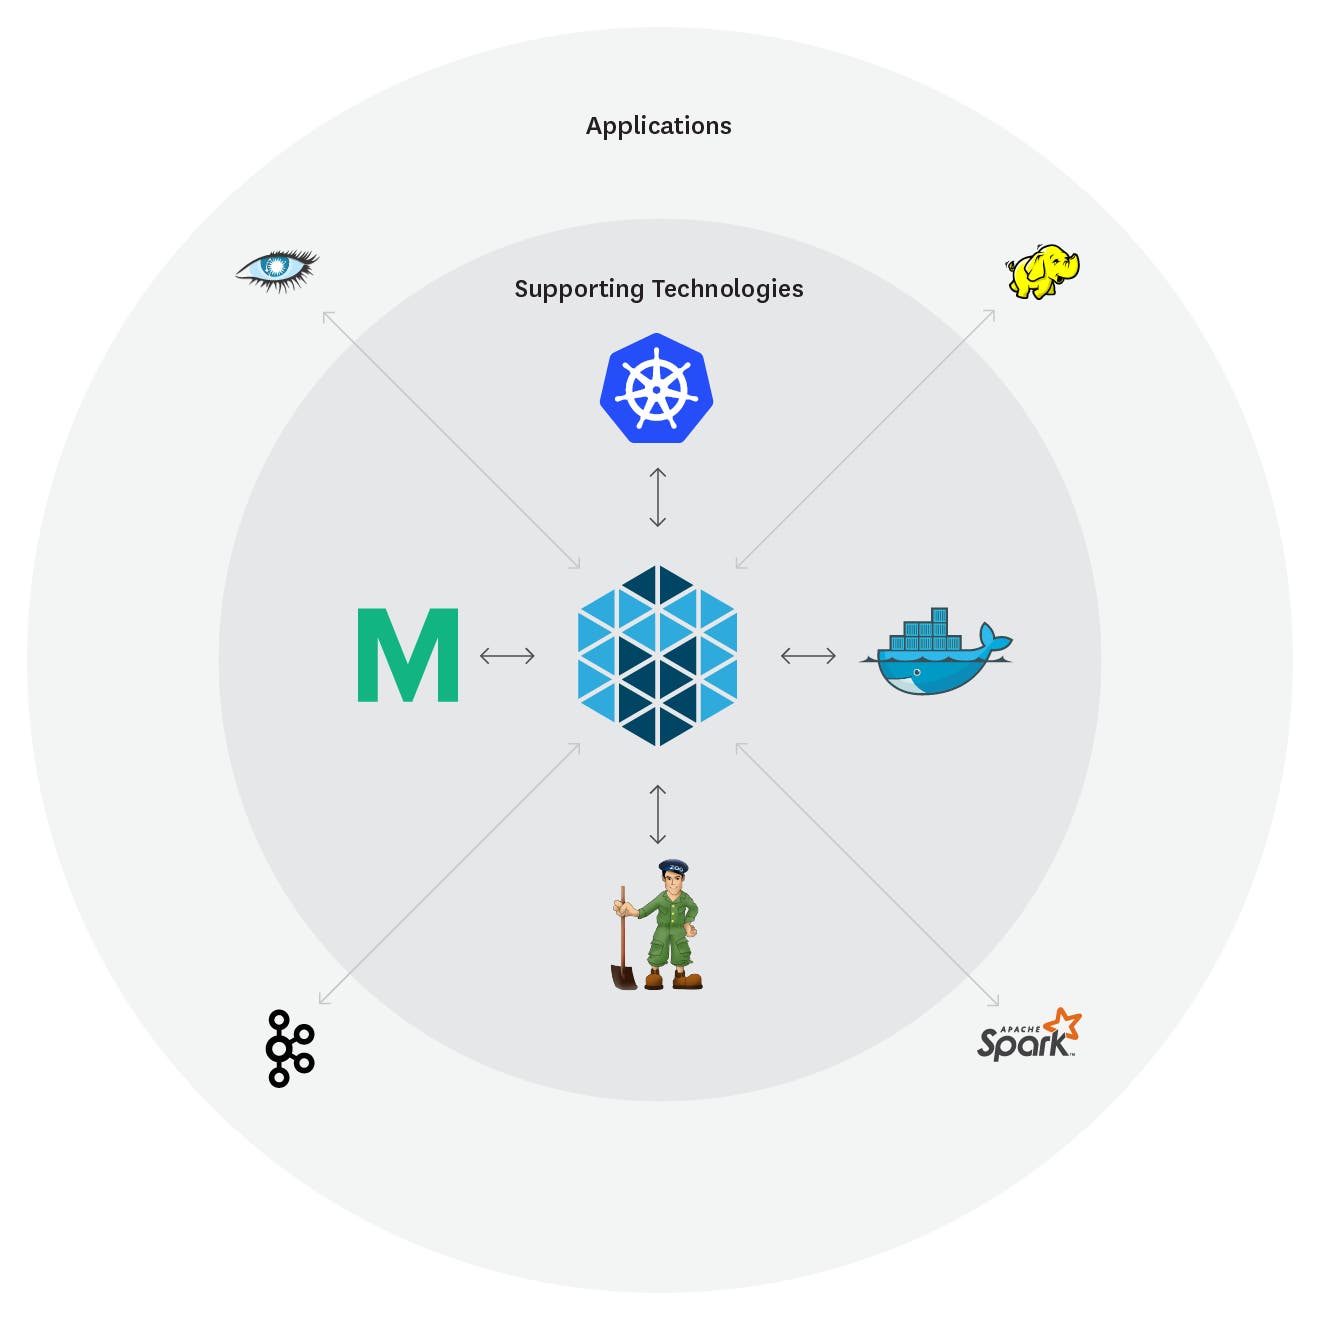
In a typical Mesos use case, you might run ZooKeeper for leader election, Marathon for container orchestration, Docker for containers, and a workload including distributed applications such as Cassandra. Or you might run Kubernetes as a container orchestrator on top of Mesos to add the auto-scaling functionality of Kubernetes to the resource allocation of Mesos.
Because Datadog integrates with all of the above technologies, you can monitor all the components of your cluster in one place instead of running ad hoc command line queries or checking a separate web UI for each technology. You can build comprehensive dashboards for each of your services that include resource metrics, Mesos task metrics, application performance metrics, scaling events from Docker, and more.
If you’re already using Datadog, you can start monitoring your Mesos cluster by following the integration steps here. If you don’t yet have a Datadog account, here is the link to start your trial.


