Siddarth Dwivedi

Tom Sobolik
Google’s comprehensive AI offering includes Vertex AI, a cloud-based platform for building and deploying AI applications, AI Studio, a web platform for quickly prototyping and testing AI applications, and Gemini, their multimodal model. Gemini offers advanced capabilities in image, code, and text generation and can be used to implement chatbot assistants, perform complex data analysis, generate design assets, and more. Large language models (LLMs) like Gemini are powerful, but reliance on them in your applications via APIs can make it difficult to understand your AI applications’ behavior and debug issues.
We are pleased to announce that Datadog LLM Observability natively integrates with Google Gemini, allowing you to monitor, troubleshoot, improve, and secure your Google Gemini LLM applications. LLM Observability also supports auto-instrumentation for Vertex AI applications. In this post, we’ll explore how you can use LLM Observability with your Gemini applications to:
- Swiftly troubleshoot and debug application errors using LLM chain traces
- Boost response quality and safety using both out-of-the-box and custom evaluations alongside clustering for low-quality request-response pairs
- Improve visibility and control with real-time metrics that provide insights into Gemini’s performance and token usage
Swiftly troubleshoot Gemini applications with end-to-end tracing
Datadog LLM Observability now offers automatic instrumentation for Google Gemini, detecting and tracing API calls made by your application without the need for manual annotations. This simplifies the setup process, allowing you to focus on instrumenting other parts of your LLM applications. You can use LLM Observability to view detailed, end-to-end traces of your LLM chain executions and quickly spot performance bottlenecks and errors. When tracing a Gemini API call, you can carefully inspect the input prompt and observe each of the steps your application took to form the final response—such as retrieval-augmented generation (RAG) requests or moderation filters. By looking at these intermediate steps, you can quickly discover the root cause of unexpected responses.
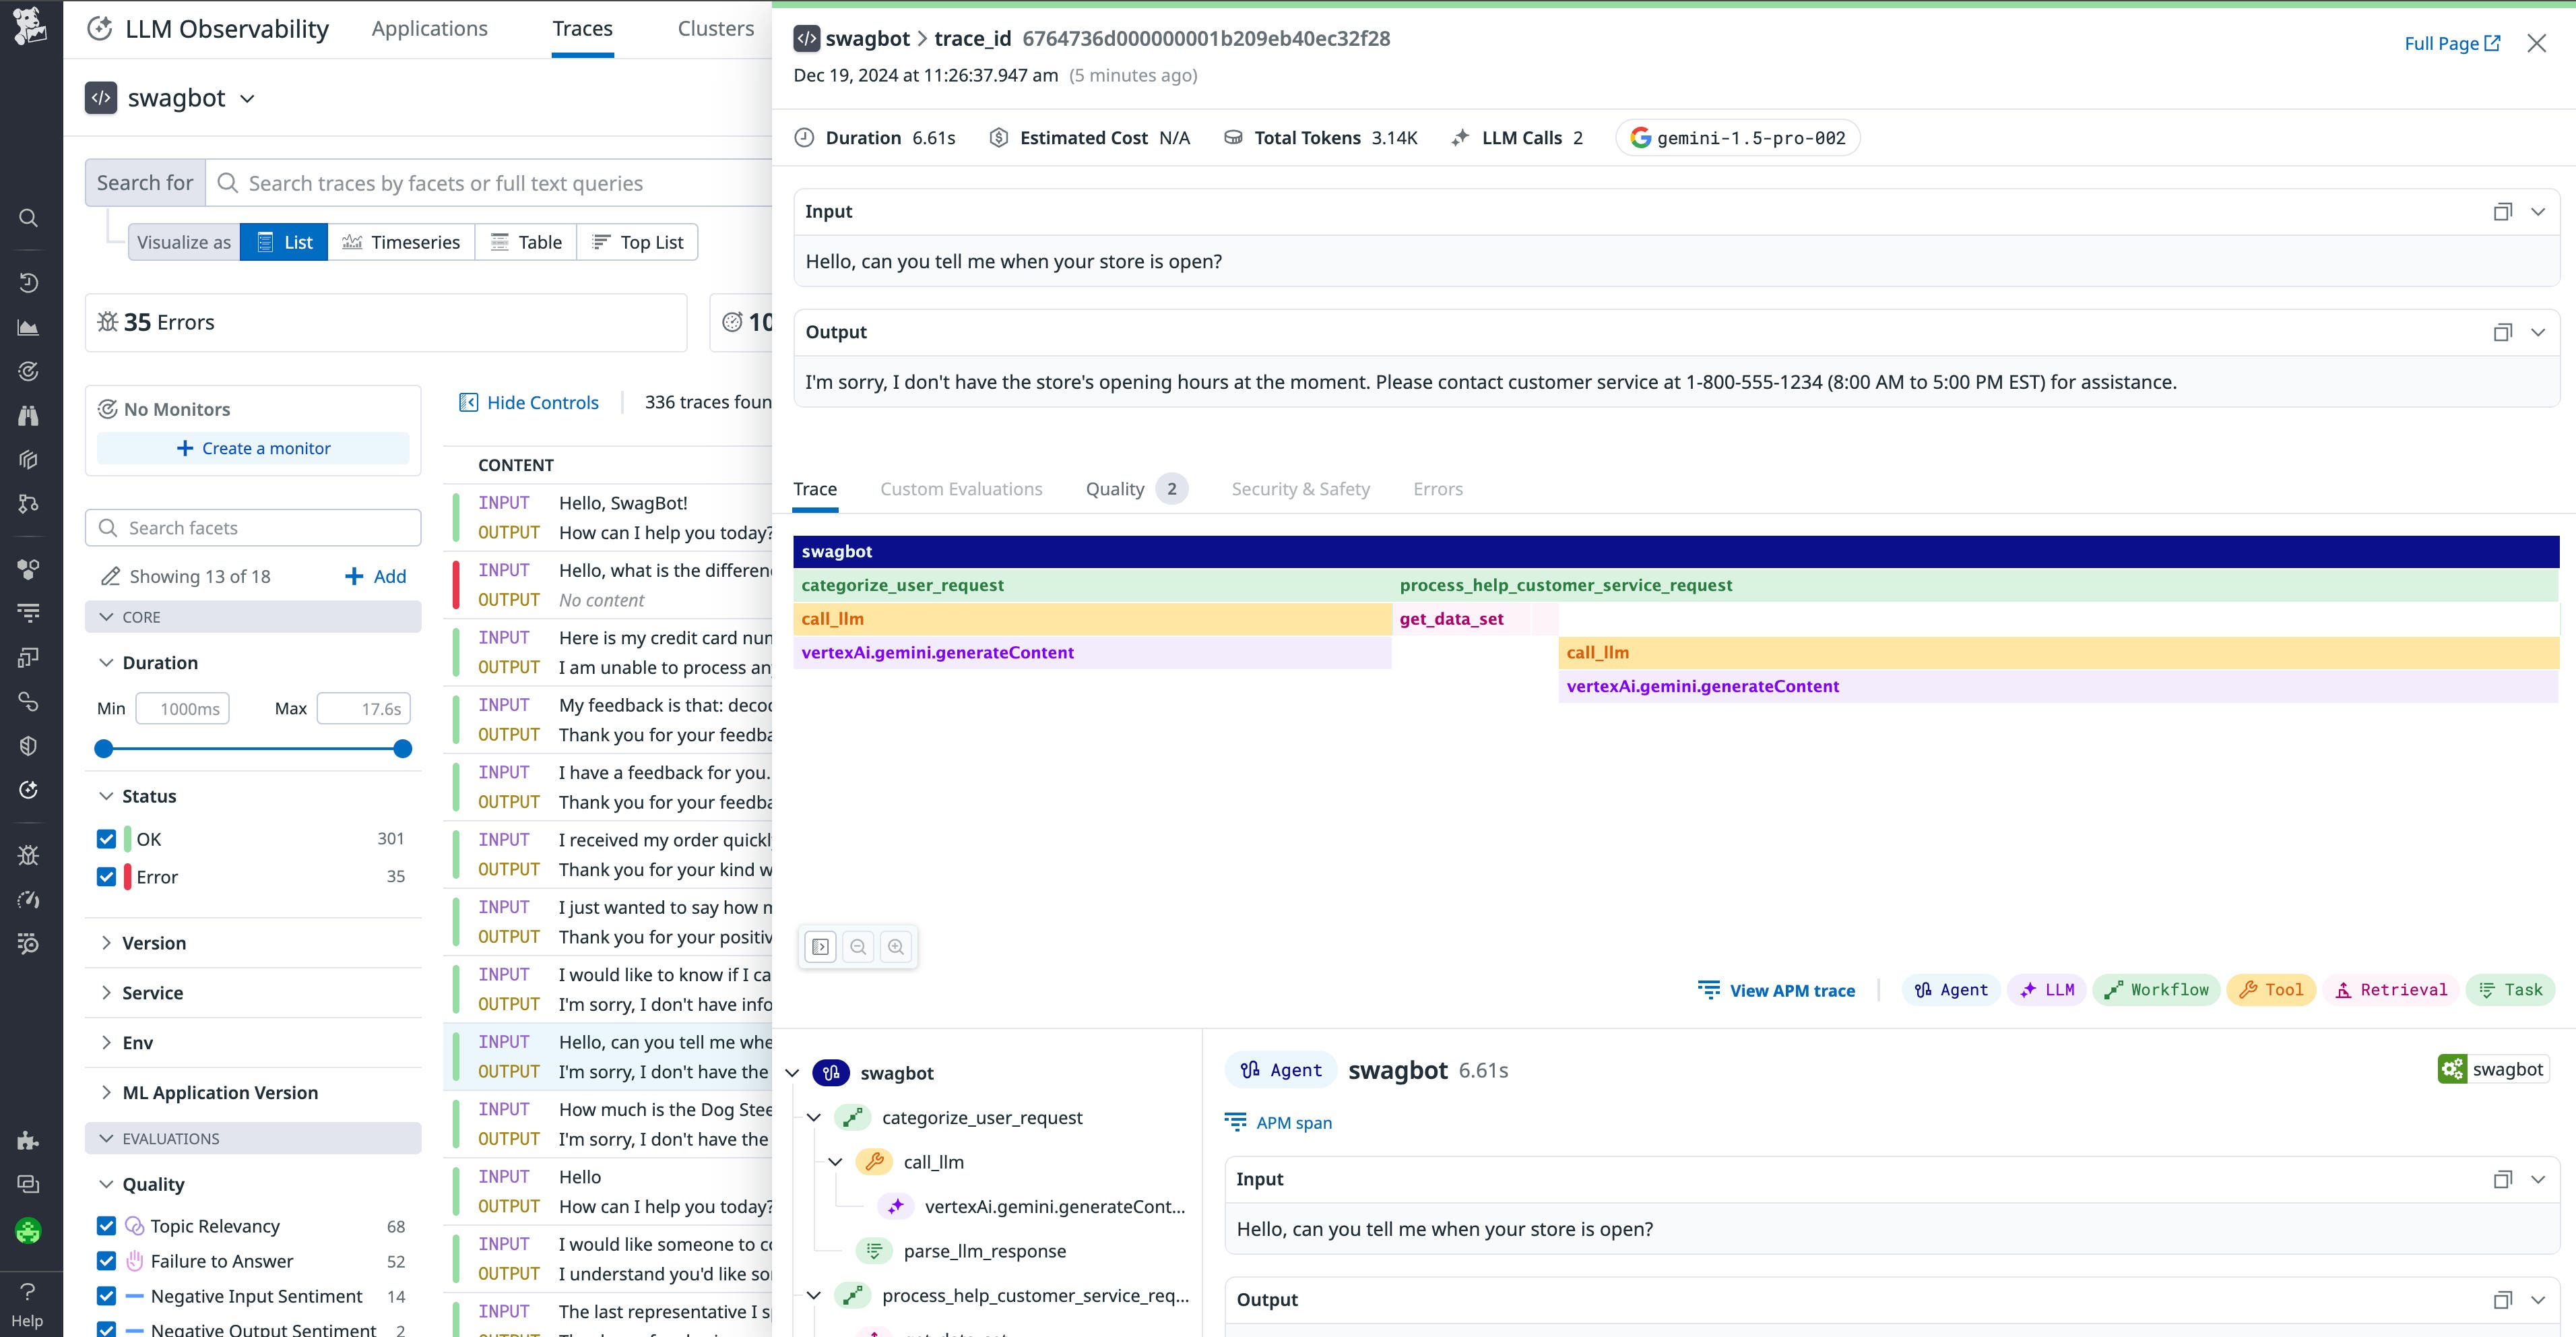
The trace side panel also provides key operational metrics—latency and token usage—for each call your application makes to Google Gemini. This way, you can quickly determine whether a call was unusually slow or expensive and then dive into the spans to determine the root cause of any issues.
Improve response quality and safety of Gemini applications
Due to their non-deterministic nature, LLM applications can unpredictably hallucinate, generating inaccurate, irrelevant, or potentially toxic responses. User-facing LLM applications like chatbots are particularly susceptible to jailbreaking, posing significant risk of exposing sensitive information. Datadog LLM Observability provides out-of-the-box quality and safety evaluations that help you continuously evaluate every user interaction to track and mitigate these risks.
The trace side panel allows you to access these quality evaluations, which include checks like “Failure to Answer”, “Topic Relevancy”, and “Negative Sentiment”. Additionally, safety checks for “Input Toxicity” and “Prompt Injection” ensure that you are able to identify inappropriate and malicious interaction with your application and take necessary action.
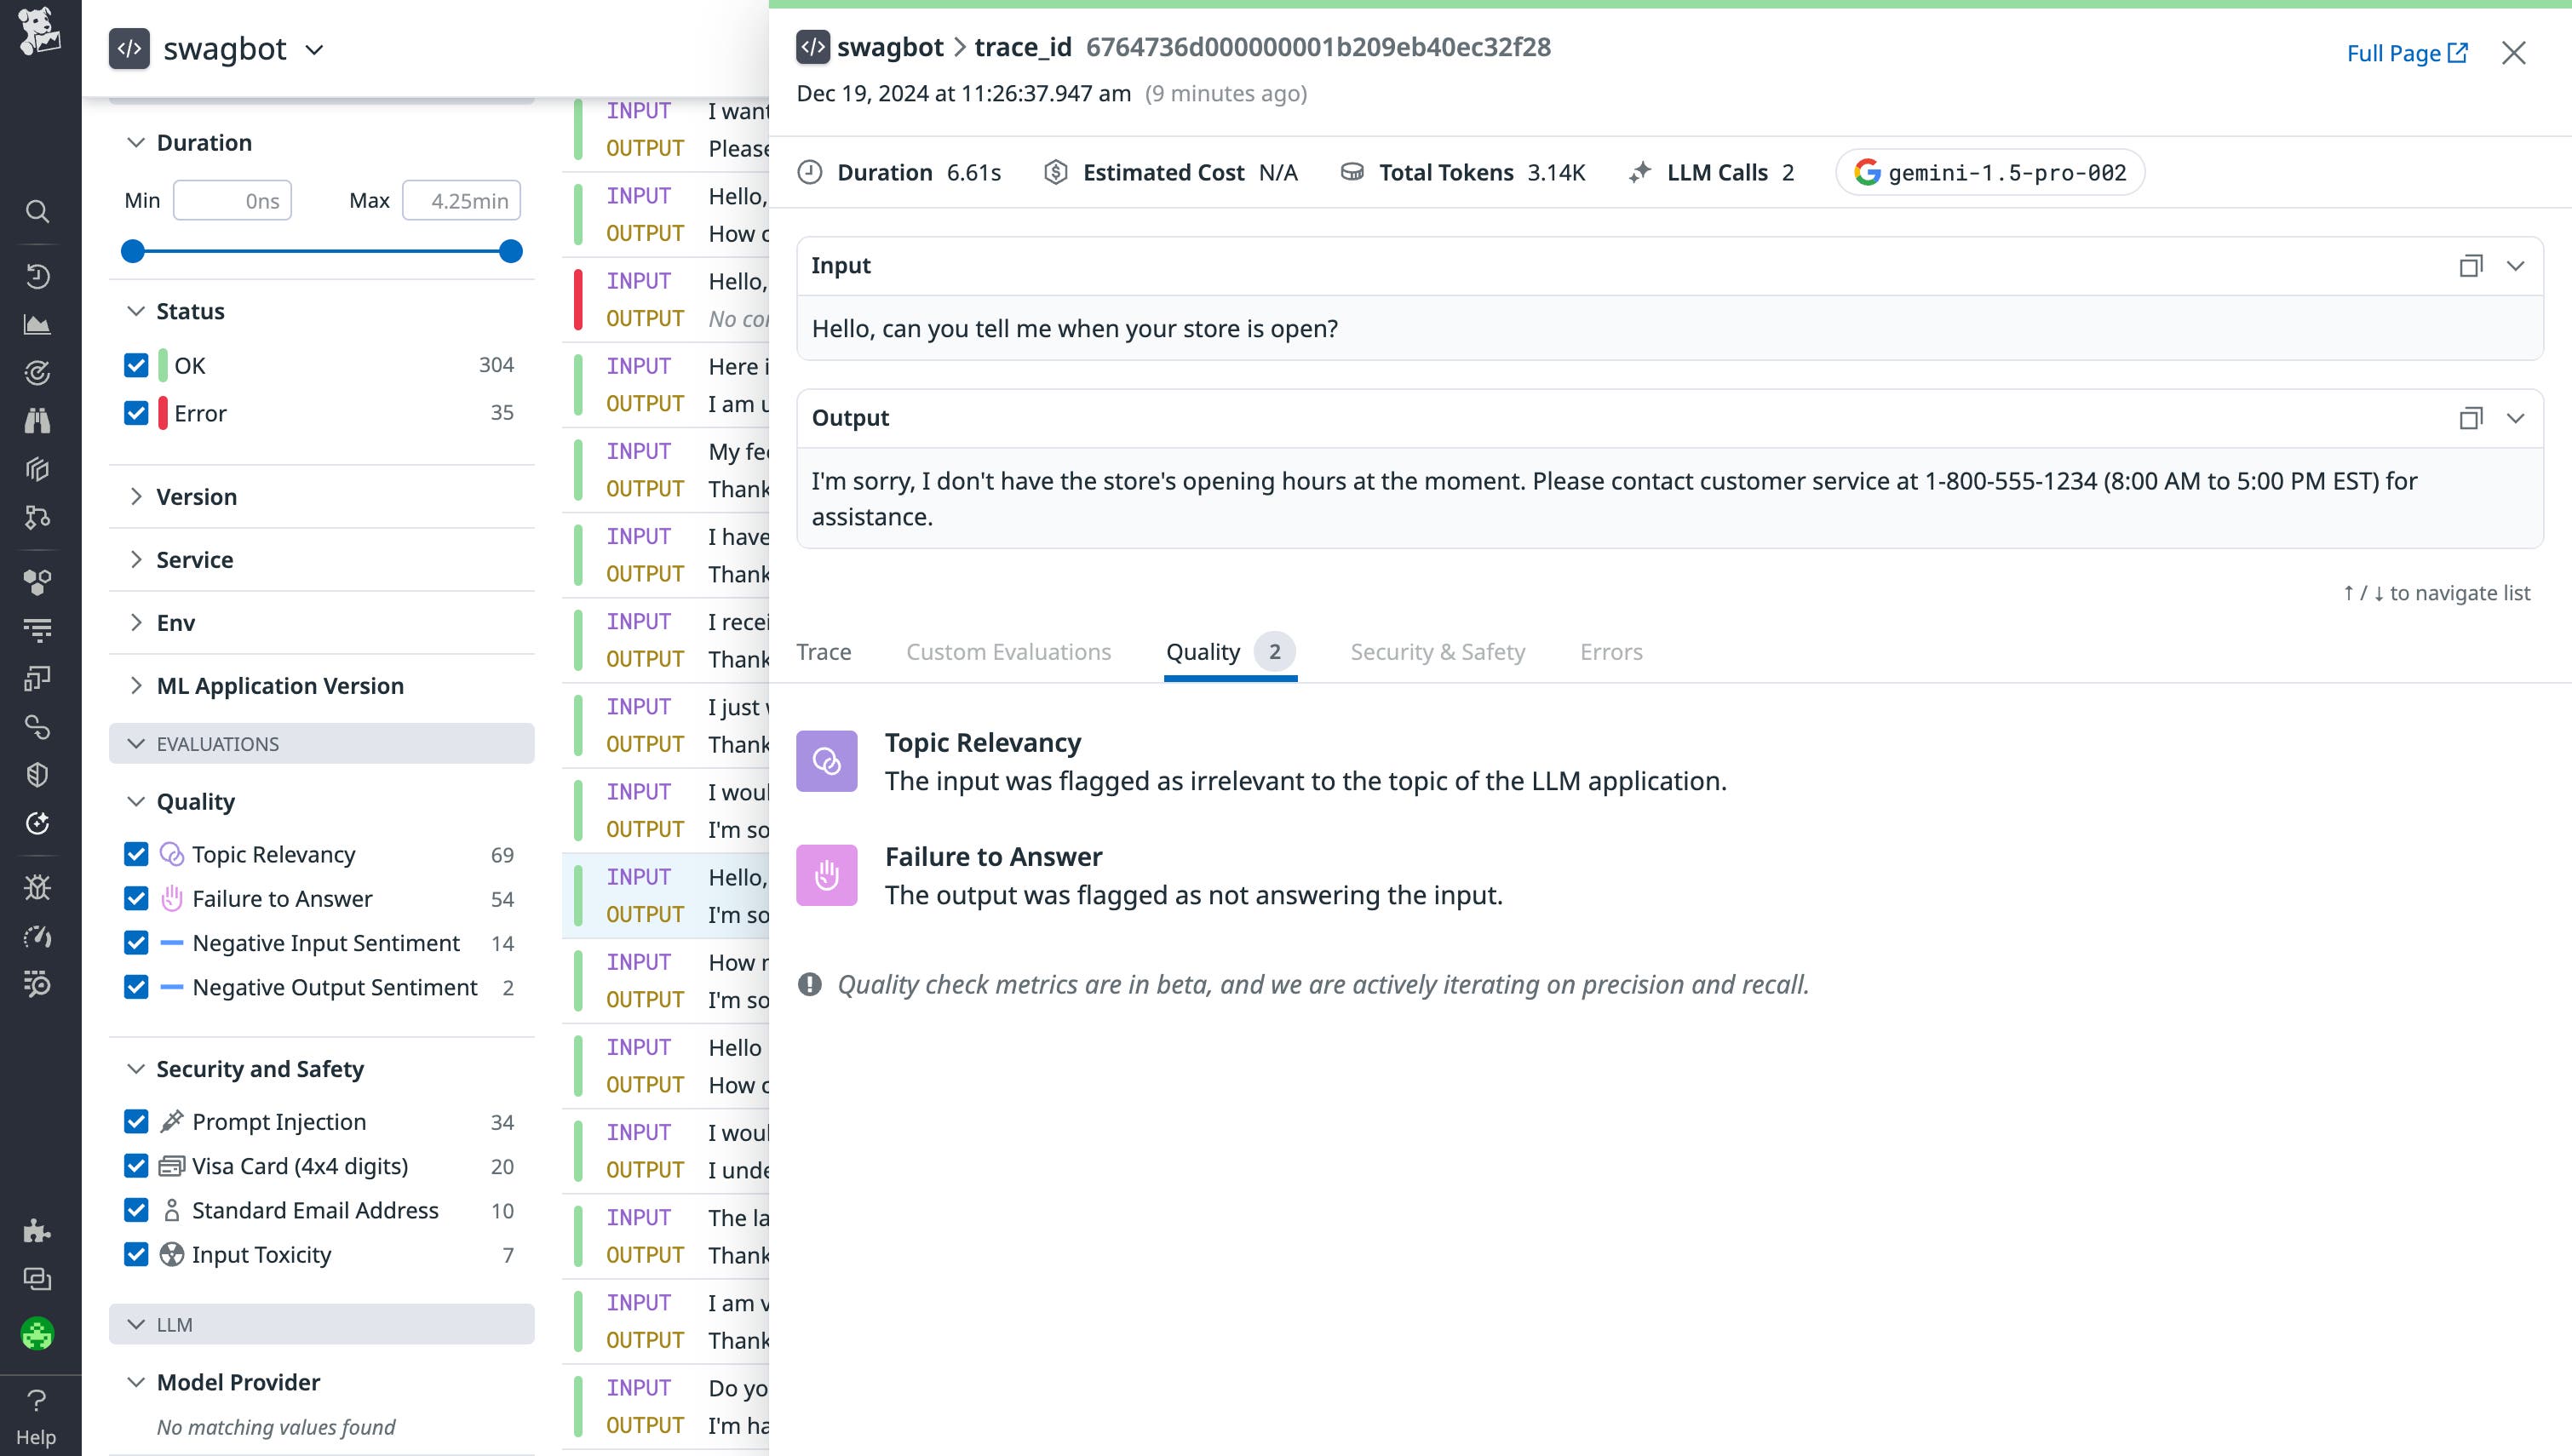
LLM Observability also uses Sensitive Data Scanner to actively redact personally identifiable information (PII) from prompt traces. This helps you refrain from storing this data in your monitoring system to maintain compliance with regulations like GDPR, and also makes it easier to detect when customer PII was inadvertently passed in an LLM call or shown to the user.
Get complete visibility and control over Gemini usage
Cost efficiency and performance are key concerns for today’s LLM applications. As AI teams rapidly expand their use of Gemini APIs to address increasingly complex scenarios, it is essential to effectively monitor requests, latencies, and token consumption.
In many use cases, LLM token consumption can be highly variable from prompt to prompt. Whether you’re using Gemini 1.5 Pro, 1.0 Pro, or 1.5 Flash, your costs will vary significantly depending on how your usage interacts with your model’s pricing structure. LLM Observability helps you track both token usage and estimated costs at the application, trace, and span level, so you can easily characterize the cost of your AI services and break down the most significant sources of token usage.
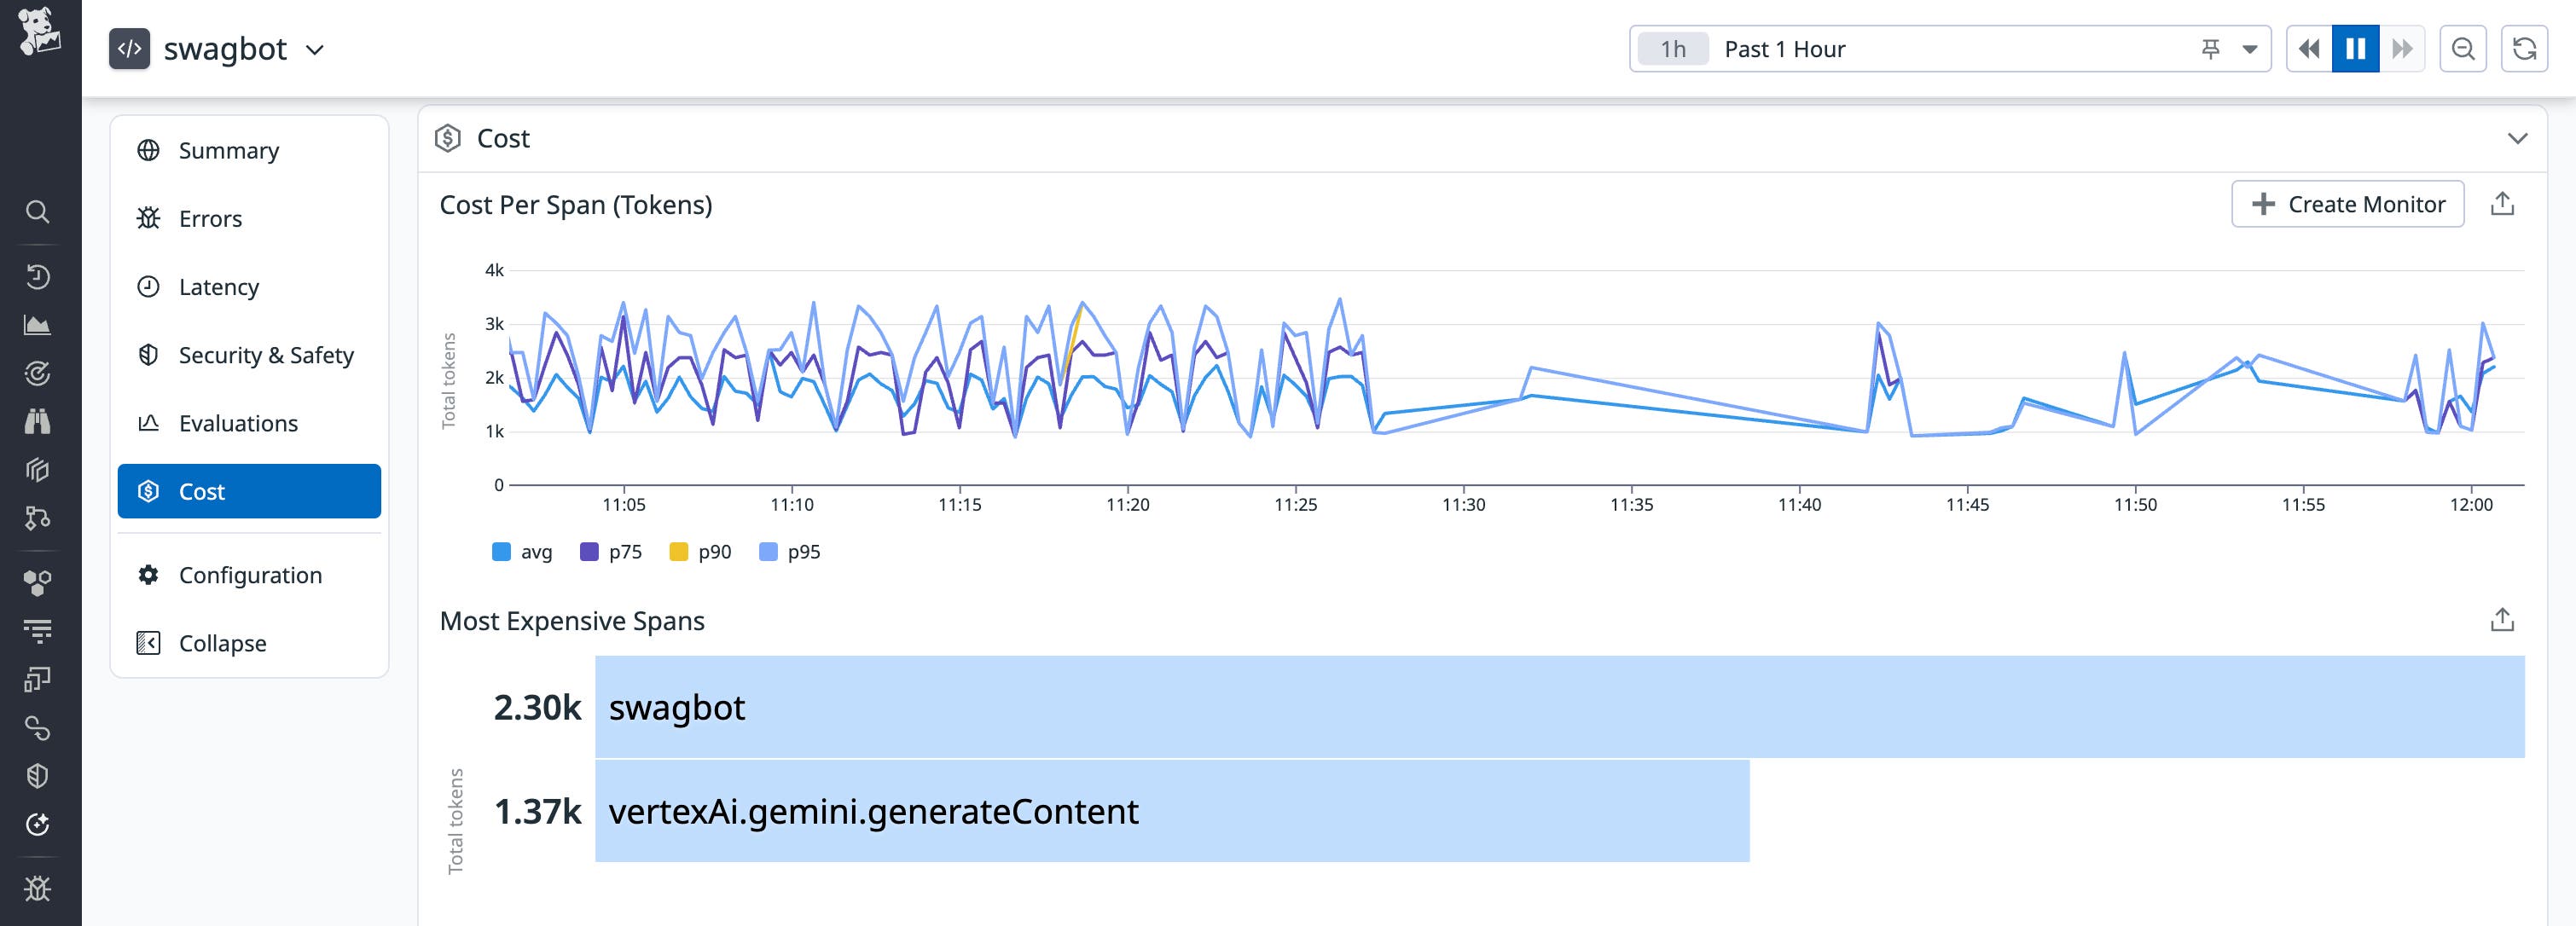
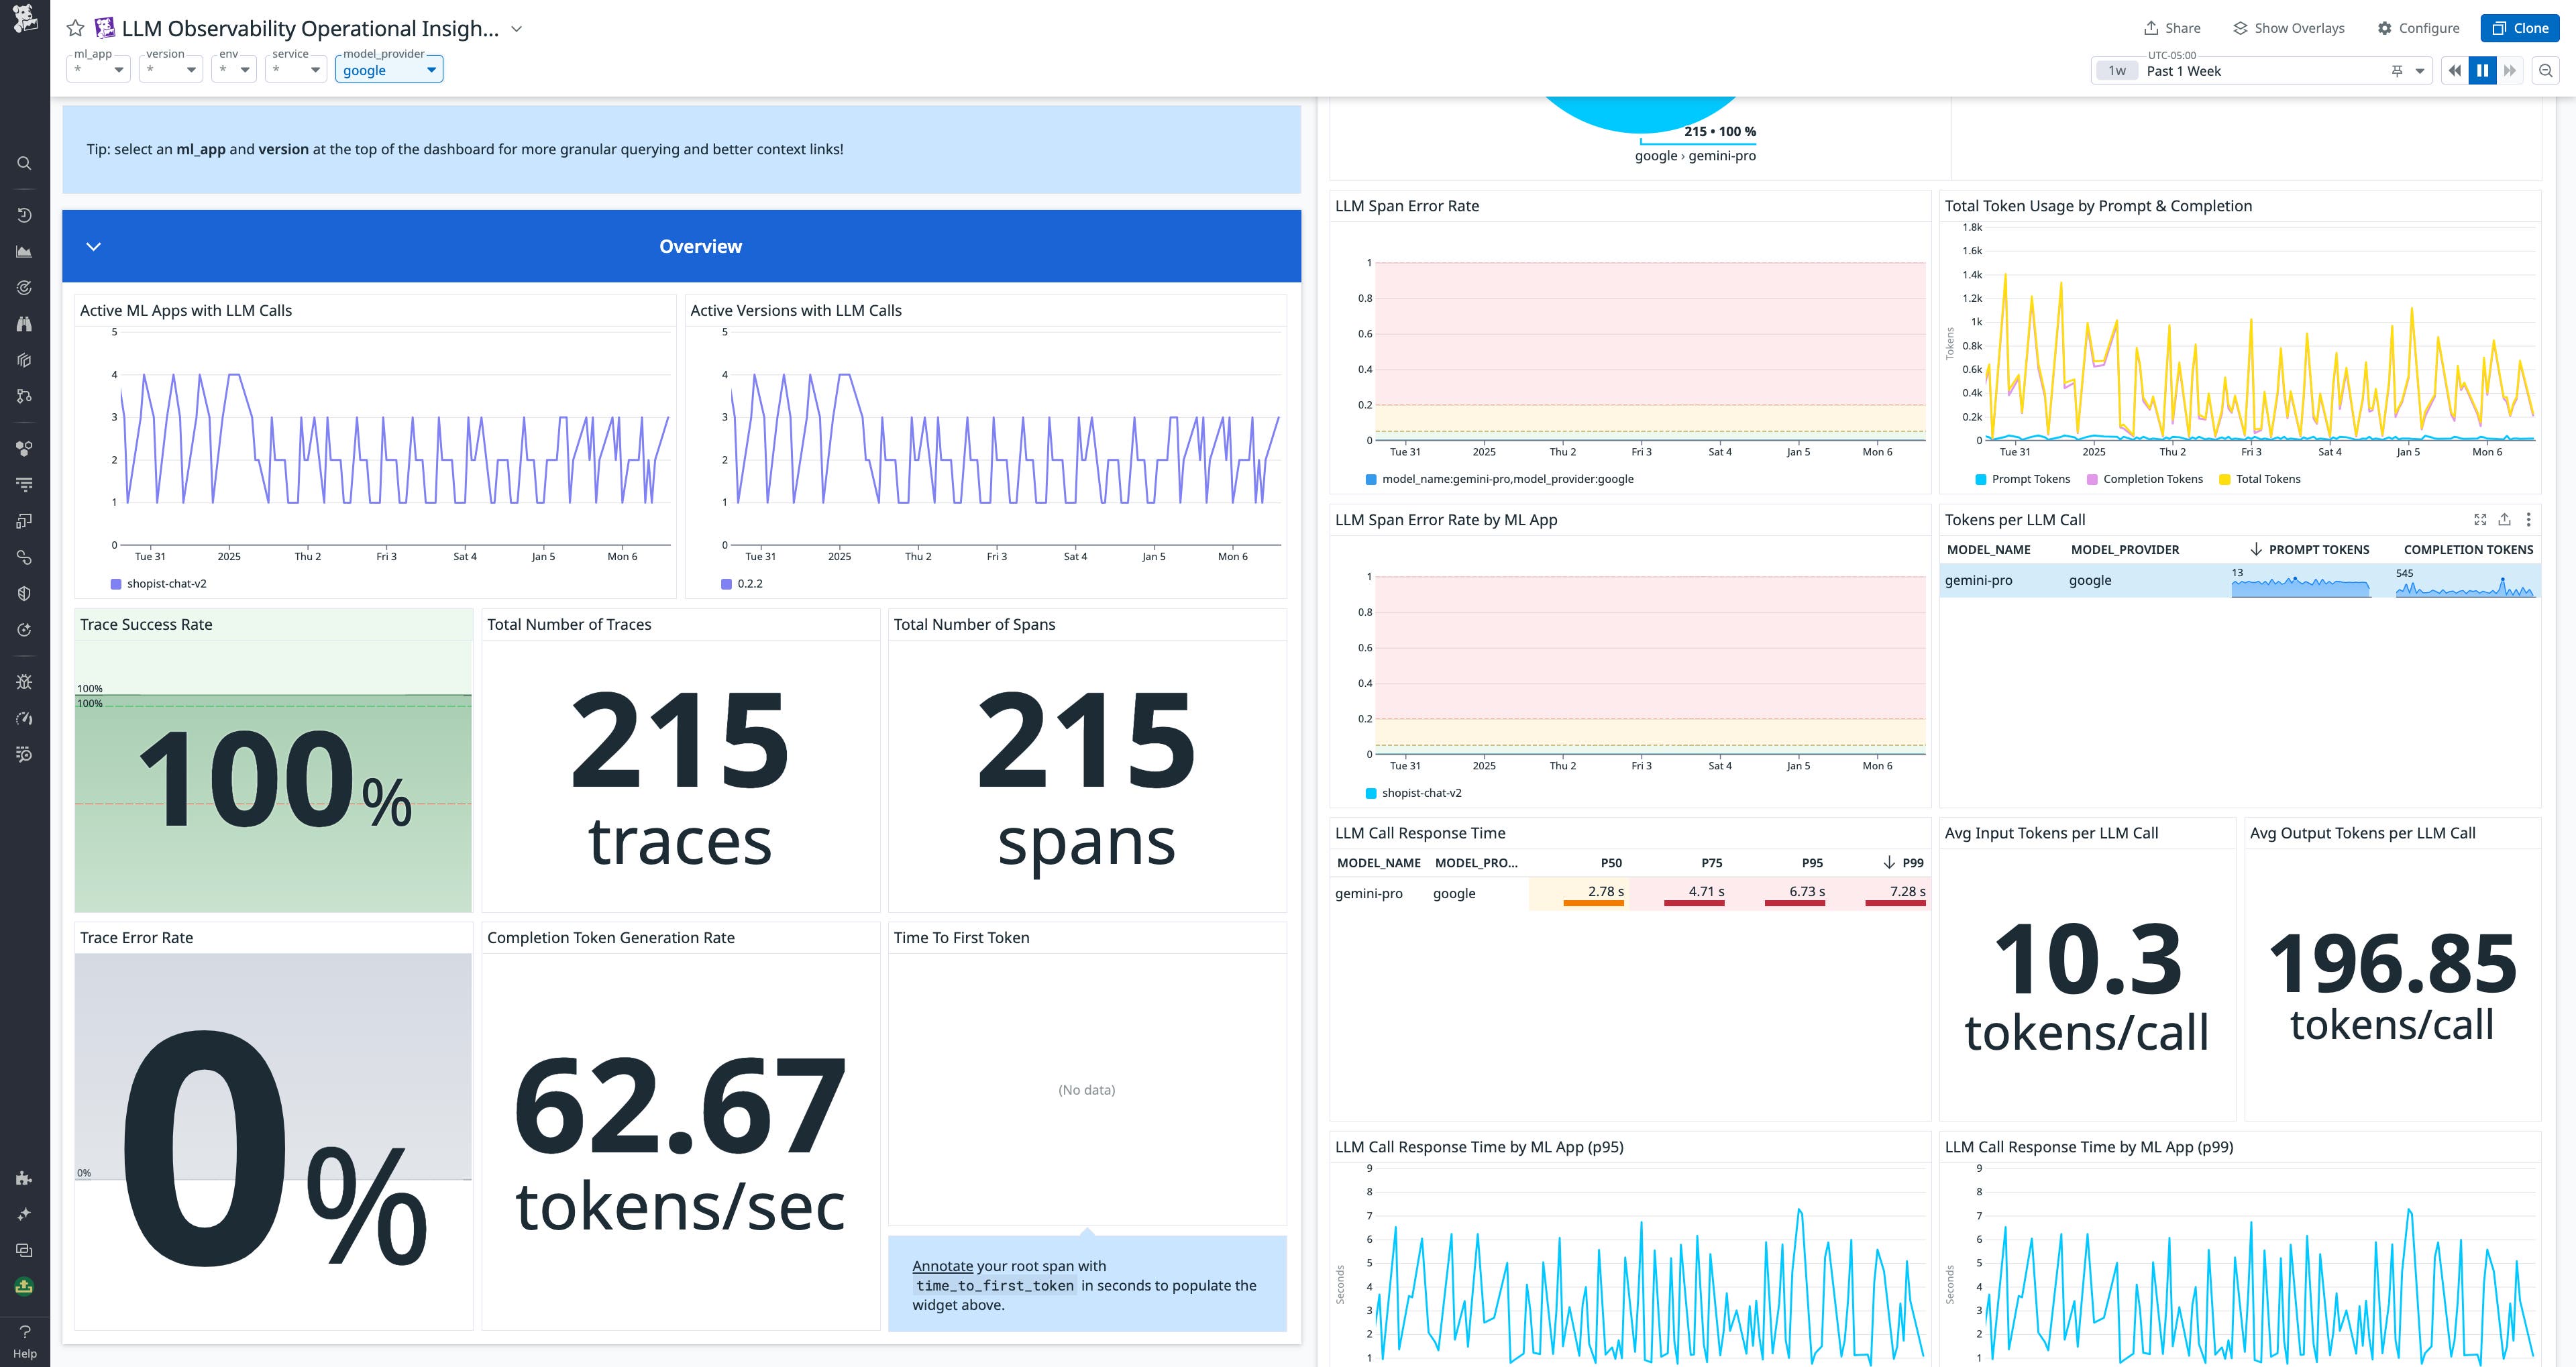
To get a comprehensive view of your Gemini application’s performance and usage patterns, you can use the out-of-the-box Operational Insights dashboard. This dashboard collates key usage metrics, such as request volume, usage per model, tokens per call, call response time, and span error rate. By getting all these detailed signals in a unified view, you can quickly focus your investigation into sources of errors, latency, and unexpected usage patterns.
Monitor Google Gemini with Datadog
LLM-based applications are incredibly powerful and unlock many new product opportunities, and Gemini is a highly capable solution for implementing LLMs in your apps. However, there remains a pressing need for granular visibility into model quality, safety, performance, and cost. By monitoring your Gemini applications using Datadog LLM Observability, you can form actionable insights about their behavior from a unified interface. LLM Observability is now generally available for all Datadog customers—see our documentation for more information about how to get started.
If you’re brand new to Datadog, sign up for a free trial.


