Candace Shamieh

James Eastham

Piotr Wolski

Jane Wang
Microservices architectures empower individual teams to choose their own programming language, tools, and technologies, resulting in more independence and the ability to develop and release features faster. While there are various types of integration patterns that can facilitate microservice communication, many organizations choose to adopt event-driven architectures (EDAs) because of their scalability, agility, and resilience.
An EDA is a microservices architecture pattern in which a software component executes in response to receiving one or more event notifications. In a traditional request-response microservices architecture, communication is synchronous, meaning services send requests and wait for a response before performing their next task. Event-driven microservices communicate asynchronously—events are created, routed, or received without a direct response. Because asynchronous events make it difficult to anticipate a specific order of occurrence, and since services don’t send a response, there is no assurance of delivery, which poses unique monitoring challenges.
In this post, we’ll discuss best practices for monitoring an EDA. Your EDA monitoring system must enable you to:
- Implement distributed tracing
- View all of your services, components, and dependencies cohesively
- Collect telemetry that provides you with detailed insights of EDA performance and efficiency
- Detect errors immediately
But first, we’ll briefly discuss the fundamental concepts of an event-driven architecture.
What is event-driven-architecture?
As you may already be aware, the term “messaging” describes the methods of communication that occur between the services in your system. Messages can be sent externally or between components within an application. When sent externally, messages can be delivered synchronously, like via HTTP connection, or asynchronously, via intermediaries like event brokers, discussed in detail below. The three most common types of messages used in event-driven architectures are events, commands, and queries.
In an EDA, services primarily interact and communicate via events. Events signify a change in the system’s state, like when an open slot at a doctor’s office gets booked by a patient or when a health insurance claim is successfully processed. When an event occurs, the system that created the event is completely unconcerned and unaware of what happens to the event downstream. Services in an EDA can also make requests that are to be executed by another service. Requests can be in the form of commands, prompting a service to take action, or queries, prompting a service to provide data. Commands and queries delivered asynchronously to an event broker enable the service that sent the request to continue performing tasks without waiting for a response.
EDAs are comprised of three core components: producers, consumers, and brokers. When an end user, application, or service performs an action that generates new data or updates information, the producer creates an event representing this change and publishes it to the broker. The broker then routes the event to downstream consumers who react to it as necessary, performing their own operations in response. In this setup, the broker manages the delivery of the event without altering or consuming it, allowing consumers to process the events independently.
Producers and consumers are loosely coupled, primarily interacting with events, and are not required to be aware of each other’s existence. This makes it easy to add or remove consumers in accordance with an organization’s needs, allowing for greater flexibility and a lower risk of failure. Producers might be SaaS applications, IoT devices, user interfaces, or external systems, generating events based on changes in a system. Consumers can be services that initiate workflows, update resources, begin analyses, or even generate new events as a result of a producer’s event.
Event brokers manage the flow of events using a variety of different message transport mechanisms. Brokers can be self-hosted, like running one in your own Kubernetes cluster, or SaaS, helping to facilitate service communication and disperse events from producers to the relevant consumers. Queues, buses, streams, and topics are different types of transport mechanisms that group related events together based on the data embedded within an event’s message. Depending on the type of integration pattern you need to facilitate microservice communication in your EDA, the broker will use the transport mechanism differently. The transport mechanism can act as a channel, actively distributing events to downstream services, or it can allow services to subscribe to it, like in the case of a topic. When services are subscribed to the transport mechanism, they will automatically receive any events published to it.
While brokers can vary widely in their capabilities, there are three basic types of event brokers: queue-, log-, and subscription-oriented. Queue-oriented brokers typically include routing logic that allows for “selective” subscriptions and ensures that each consumer (or consumer group) has a dedicated queue. RabbitMQ, ActiveMQ, and SolacePubSub+ are examples of queue-oriented brokers. Unlike queue-oriented brokers, log-oriented brokers retain event messages after processing, allowing you to replay events as necessary for stream analytics or troubleshooting. Only one consumer process can read from a topic at a time, so logs are separated into “mini-logs” in order to scale. Apache Kafka is a widely used example of a log-oriented broker. Subscription-oriented brokers implement rules that enable subscribers to choose which types of events they are interested in. Consumers, serverless functions, or even other brokers are invoked when an event occurs based on what set of rules they subscribe to. Amazon EventBridge and Microsoft Azure Event Grid are examples of subscription-oriented brokers.
For example, let’s say you’re an admin for an online bookstore and you’re ready to sell a new book on your website. You create a product on the Product Management service, triggering an event. The Product Management service recognizes the change and updates its status, publishing the Product Created event to the broker. After processing, it routes the Product Created event to the Inventory service. Reacting to the event, the Inventory Service updates its status to reflect the number of new books you have in stock. Your customers are now able to order the new book on your website.
Implement distributed tracing for easier troubleshooting
To simplify EDA monitoring, we recommend that you embed a standardized specification into all of your events. The specification can include details like the event source, type, date and time created, and a correlation ID, like a trace identifier, providing you with key details that will accelerate your troubleshooting efforts. Event specification will allow you to implement distributed tracing easily, enabling you to pinpoint exactly where an exception occurred and reduce mean time to resolution (MTTR). As an example, you can use a specification like CloudEvents (a Cloud Native Computing Foundation project) to standardize and describe event data in a common way.
Distributed tracing helps you identify the root cause of bottlenecks and performance issues within an EDA. With distributed tracing, you can track a single event as it flows through your infrastructure and have visibility into any additional actions the event took before arriving at its final destination. You’ll understand cause-and-effect relationships between the services in your EDA, allowing you to obtain the information necessary to optimize for efficiency.
Understanding cause-and-effect relationships is imperative to detecting performance issues in any architecture. In architectures that have a synchronous communication pattern, Service A directly calls Service B and Service B directly responds to Service A. When you’re alerted to a problem, you’ll be able to quickly identify where and when the breakdown occurred. An EDA’s asynchronous communication pattern means that Service A publishes an event and then continues to perform subsequent actions, completely unaware of whether or not the event was properly routed or consumed. Service B consumes the event, but has no easy way of identifying what happened upstream before consumption. When an issue occurs, it isn’t immediately clear where things went wrong.
For example, let’s say you receive an alert that the average latency for an event to route from your Payment service to your Delivery service is rising, which could lead to a delay in customers receiving their book orders. Because you’ve implemented distributed tracing, you decide to trace the end-to-end pathway of a Payment Completed event. Following the event’s flow through your architecture, you see that after the customer’s payment was successfully processed, the event was never routed to the Delivery service or the Order service. Investigating further, you see that a queue wasn’t cleared before your Delivery service went offline. This scaling issue means that a number of Payment Completed events remained stuck in the queue, preventing them from being consumed by the Delivery service. Consequently, the Delivery service would not generate a new event to initiate the shipping process, and the Order service would not send customers shipping confirmation emails with associated tracking numbers. If the Delivery Service doesn’t consume Payment Completed events, it ultimately results in unhappy customers who never received their books. You manually clear the queue so the Payment Completed events can continue their journey, and collaborate with your team to address the scaling issue.
Many organizations use open source platforms or tools to implement distributed tracing, like OpenTelemetry, Zipkin, or Jaeger. Datadog offers distributed tracing with APM and integrates with the current open source instrumentation or tracing tools that you already use.
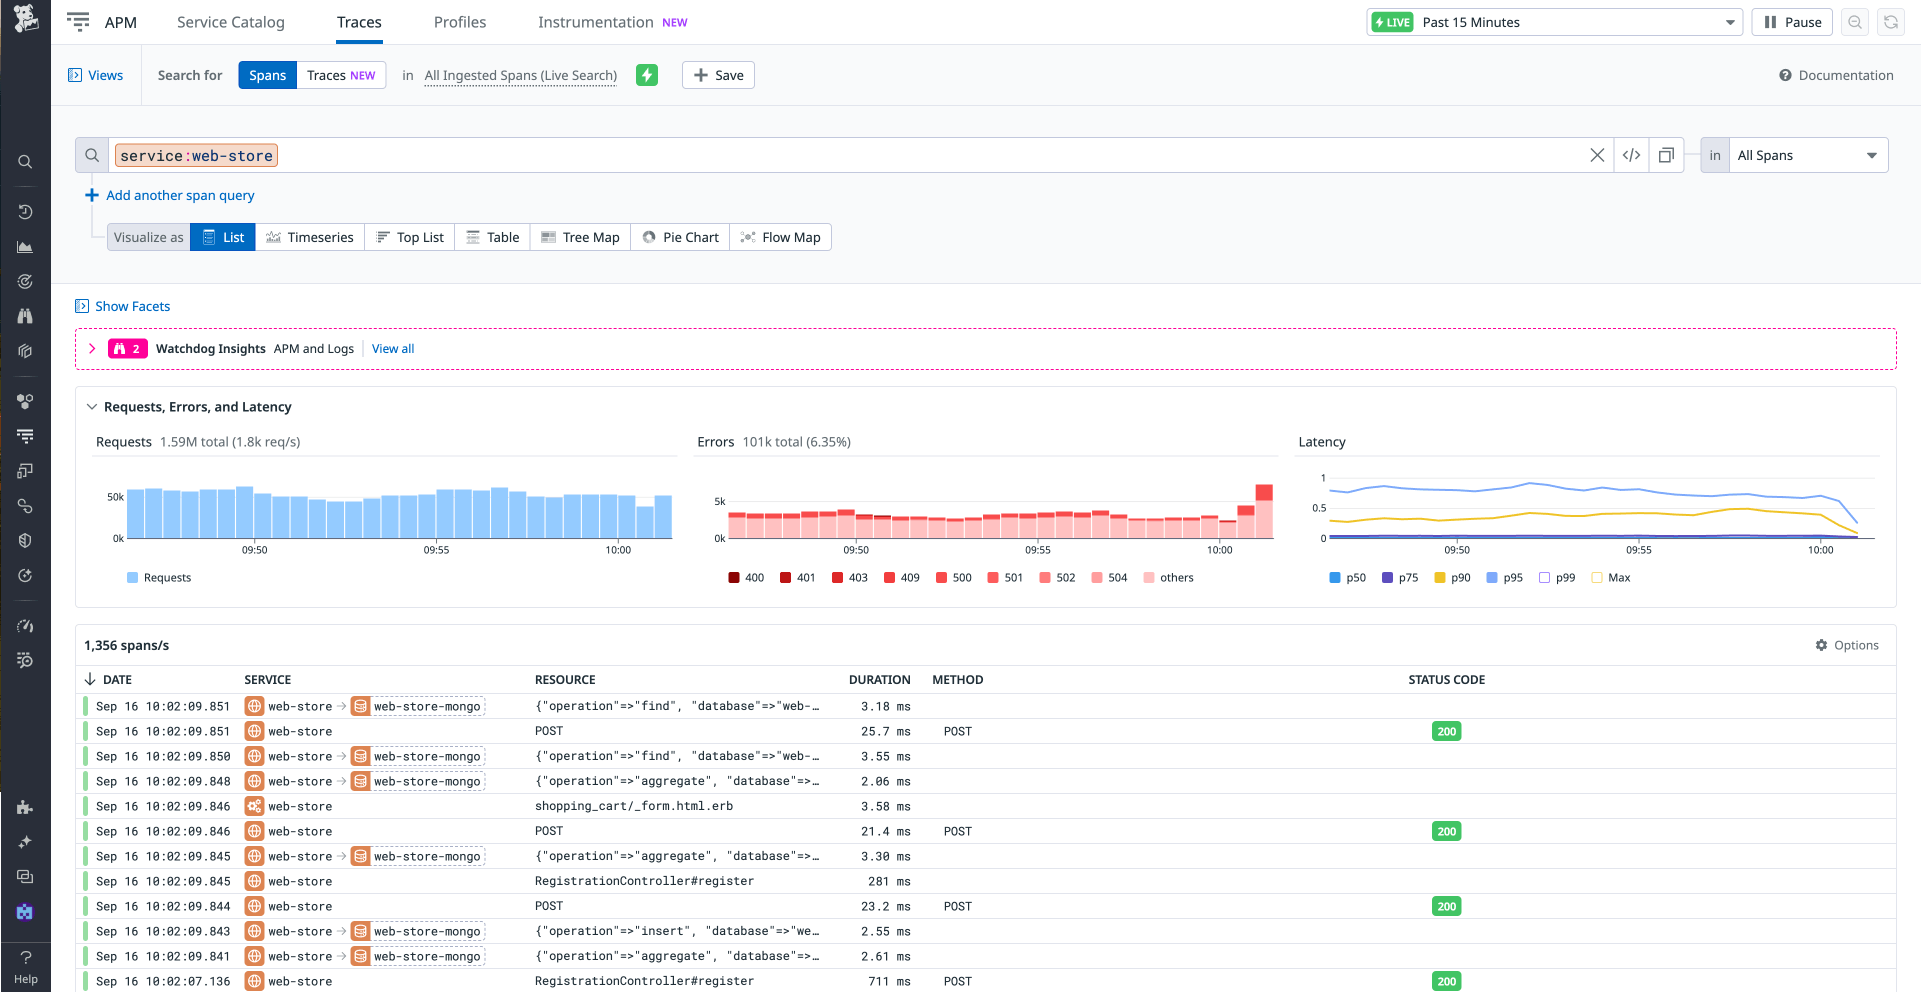
While many distributed tracing tools don’t contain built-in visualization and analysis, or only ingest a sample of your traces, Datadog APM enables you to visualize, search, analyze, and retain all ingested traces. You can correlate them with logs, code profiles, infrastructure metrics, and other telemetry that you monitor in Datadog.
Discover and view all of your services, components, and dependencies for a deeper understanding
As we’ve stated before, the distributed nature of services in an EDA makes it difficult to fully understand all of the interactions that occur across your system. Having the ability to visualize all of your services, components, and dependencies in a single location will enable you to understand how changes impact your system, pinpoint inefficiencies, and proactively identify bottlenecks that can arise in the future. As your EDA scales, you’ll also need the ability to automatically discover new services and components.
Many organizations use tools like event portals or methods such as event storming to create a visual map that displays every aspect of their EDA. Event portals are software that allows you to design, visualize, share, and manage events and event-driven applications, while event storming is a collaborative workshop that helps you identify duplicities and complexities within your EDA. Mapping your architecture enables you to gain insight into your system’s behavior at a granular level, helping you see the areas where you can optimize and reallocate resources so that you can prevent incidents before they occur.
With Datadog, you can use Data Streams Monitoring (DSM) to view your EDA and gain a more holistic understanding of data flow. DSM enables you to visualize each service and queue across your EDA end to end, helping you identify any faulty producers, consumers, and brokers.
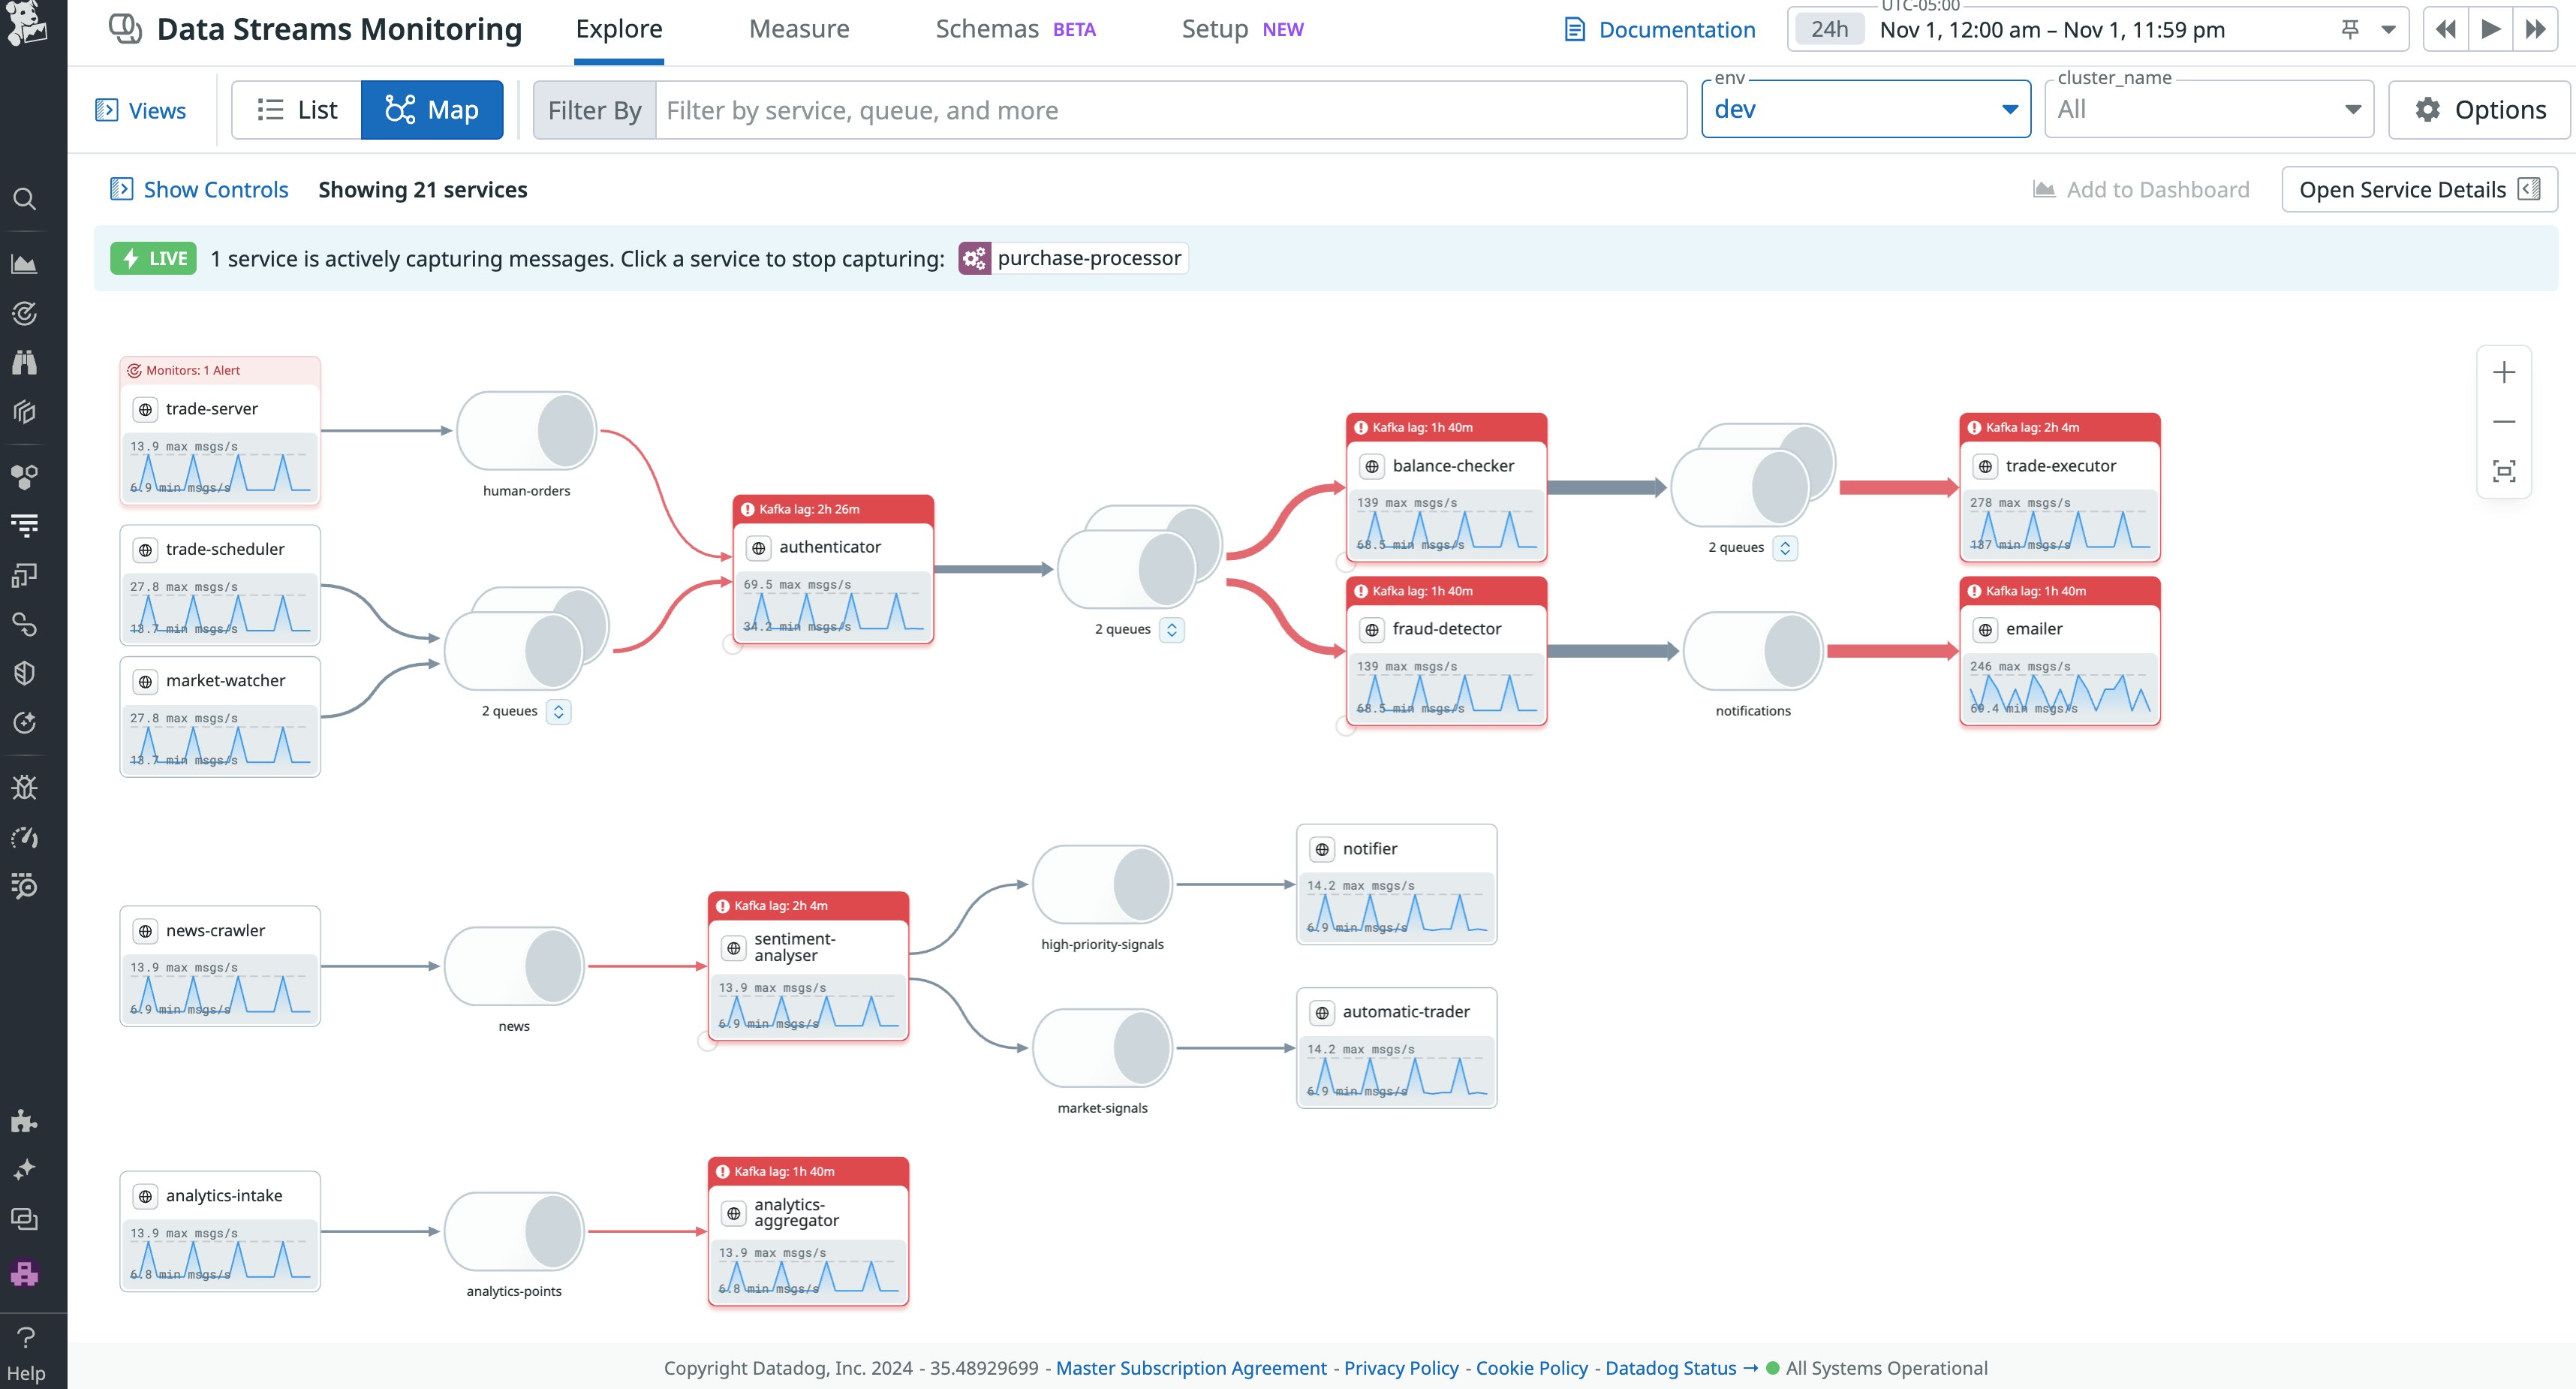
DSM clearly displays when the services in your EDA are experiencing issues, like Kafka lag for example, and allows you to search and filter by service, environment, cluster, and more. And if you’re using Datadog APM, Universal Service Monitoring, or RUM, Service Catalog will automatically discover new services as you instrument more applications across your environment.
Collect the right telemetry to track trends and monitor performance
To properly assess and analyze the state of your EDA, it’s imperative that you collect telemetry on individual services and components as well as the entire system. When you collect the right metrics, logs, and traces, you’ll be able to quickly identify anomalies and intervene early to minimize downtime and optimize performance.
Traces enable you to gain insight into the behavior and performance of your EDA, helping you identify where bottlenecks or failures are occurring. Traces provide information such as:
- The actions that trigger an event
- Types of events generated/consumed
- The format that events are created in/transmitted in. This can also include event logic, the predefined rules that you’ve set to ensure events are being processed correctly.
- The context of an event. Services in an EDA can add important context to a trace that reduces the time spent troubleshooting—annotating the trace with attributes like a product ID or current amount of inventory. This context enables you to filter, search, and query for information easily.
Capturing metrics can help you identify trends so that you can properly allocate resources and optimize your EDA for efficiency. Visualizing your metrics with dashboards enables you to analyze patterns, and configuring metric-based alerts allows you to be notified immediately if an issue arises. Helpful metrics include:
- Latency, like the rate that events are successfully generated/consumed in a specified amount of time or the time it takes for an event to route from a producer to a consumer
- Number of events lost in transit
- Number of successfully published messages
- Number of successfully consumed messages
- Average size (bytes) of successfully published messages
- Average size (bytes) of successfully consumed messages
- Message processing time
- Message in-flight time—The time spent inside the broker’s transport mechanism
- Message age—The age of the last message the consumer received
- Number of messages failed to publish
- Number of messages failed to consume
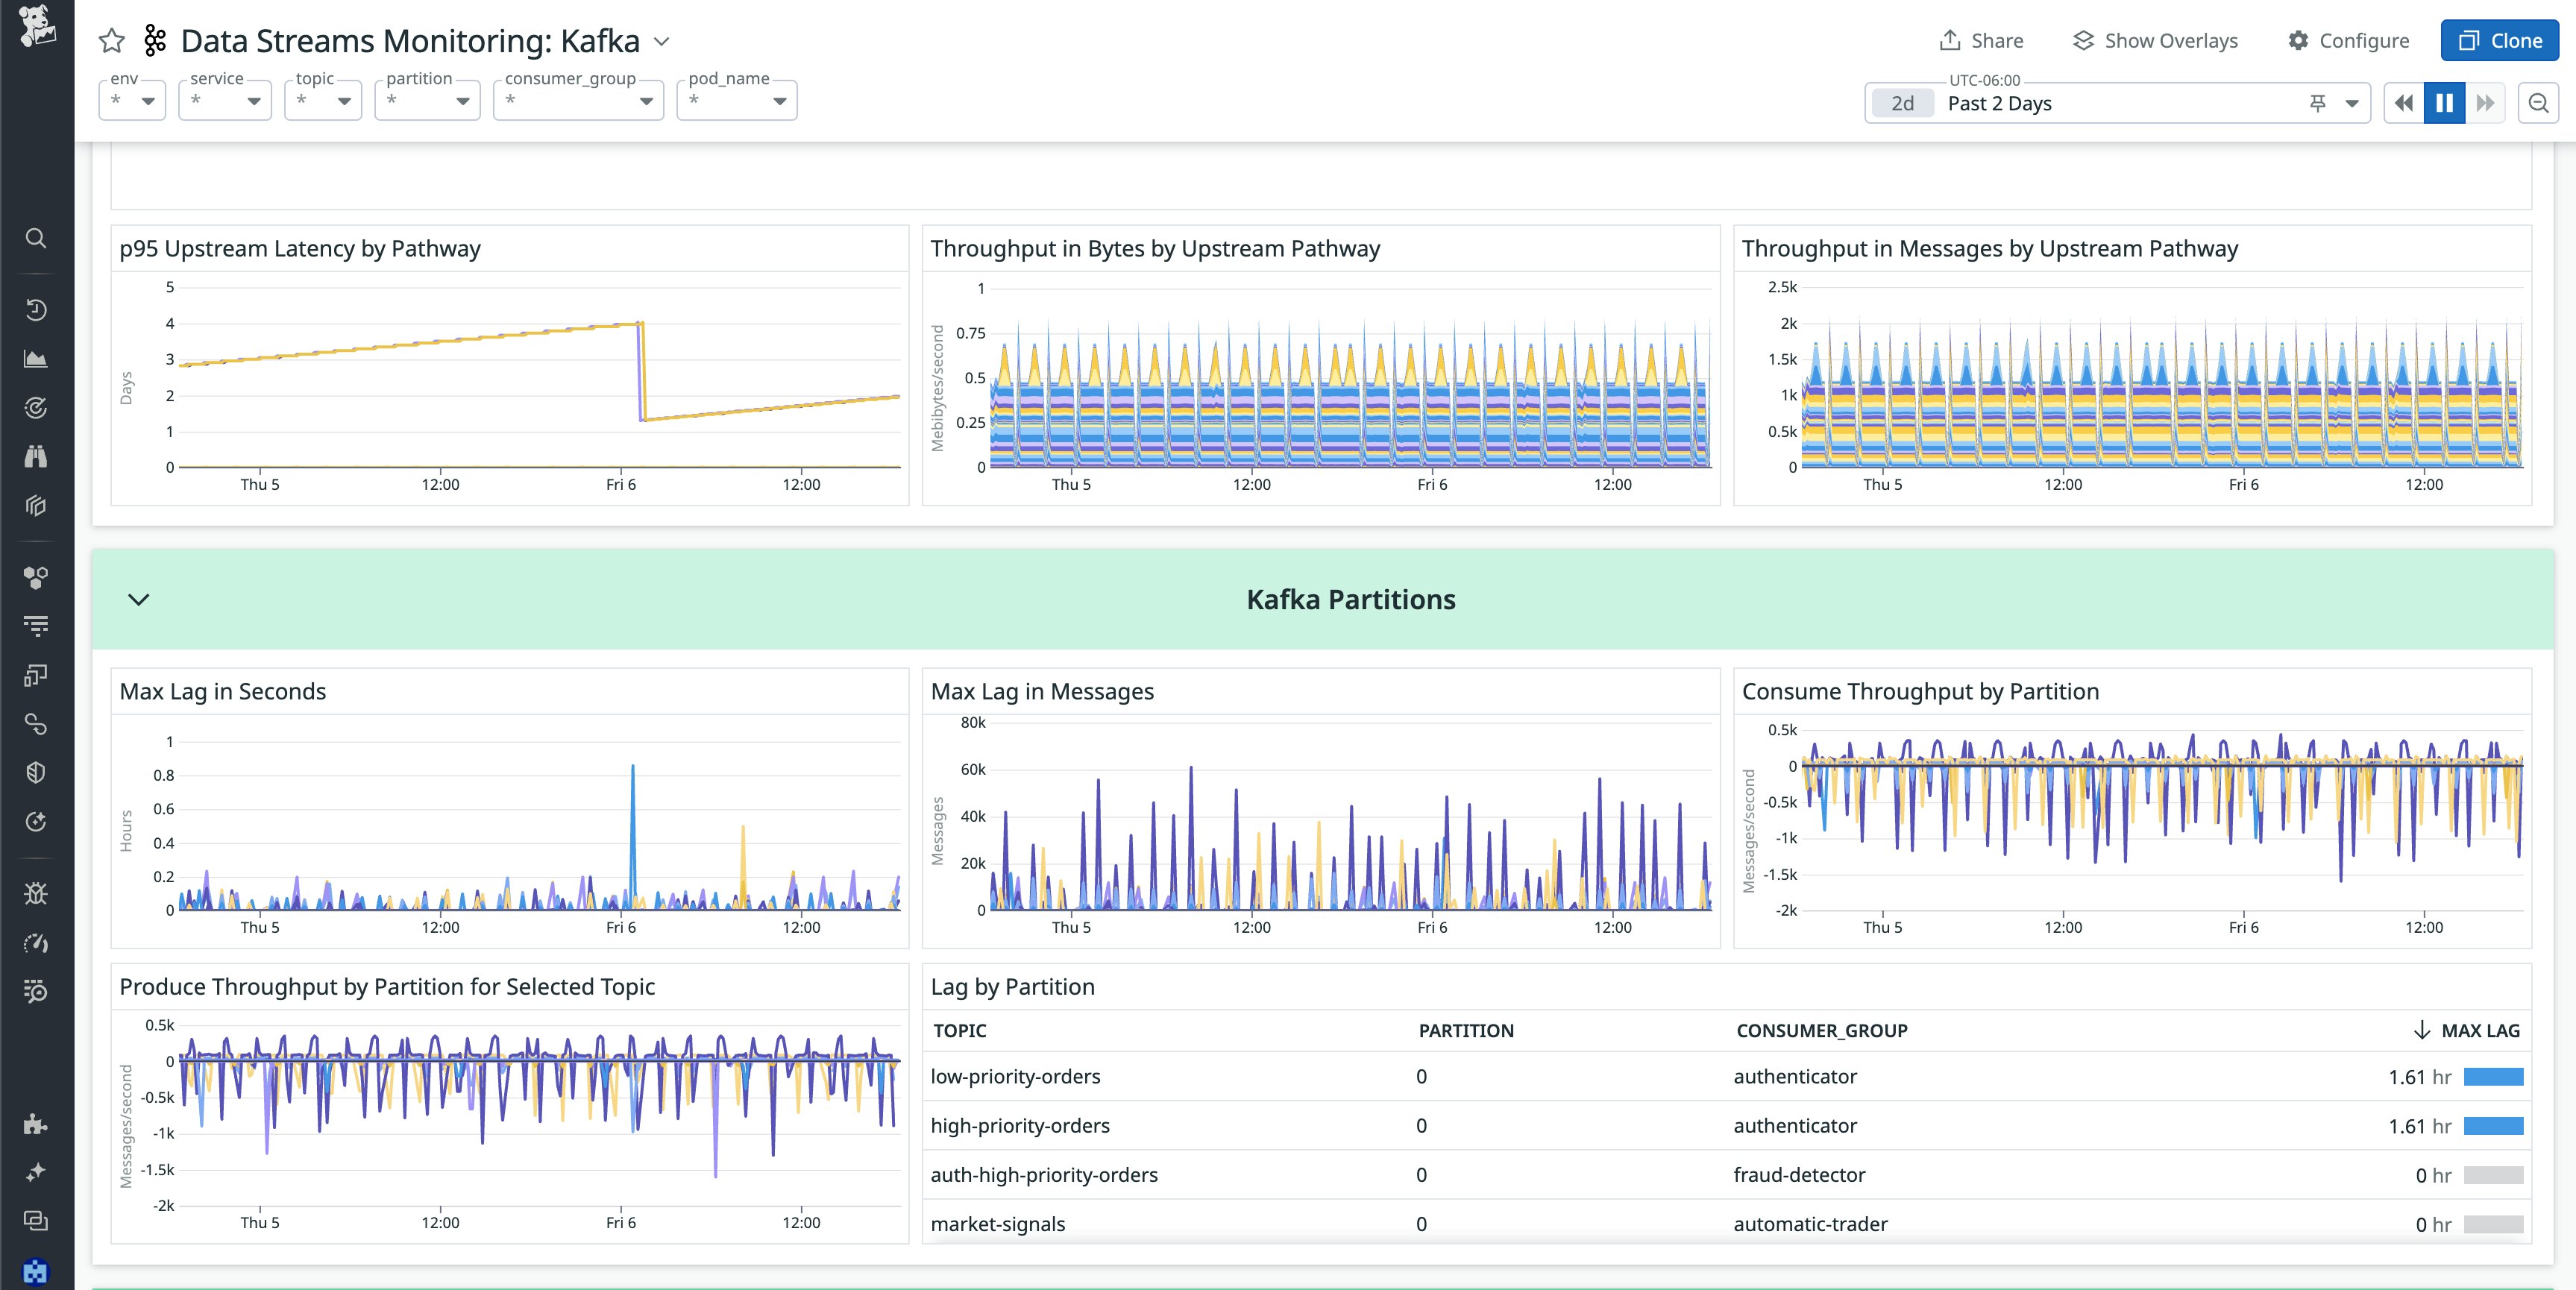
The logs collected from the components in your EDA show how services behave individually and how they respond to one another. Your logs can be used for in-depth troubleshooting and debugging, as well as extensive historical analysis. For example, using a standardized event specification can help you ensure that a unique event ID is generated every time an event is published. By including that event ID in your logs, you’ll have the ability to query all logs related to a specific event, allowing you to reduce time spent identifying the root cause of any issues.
Consolidating this telemetry into a unified observability platform and using monitoring tools that are specifically designed for EDAs allows you to gain a holistic understanding so you can make calculated, informed decisions about how to best optimize your environment and enhance end-user experience.
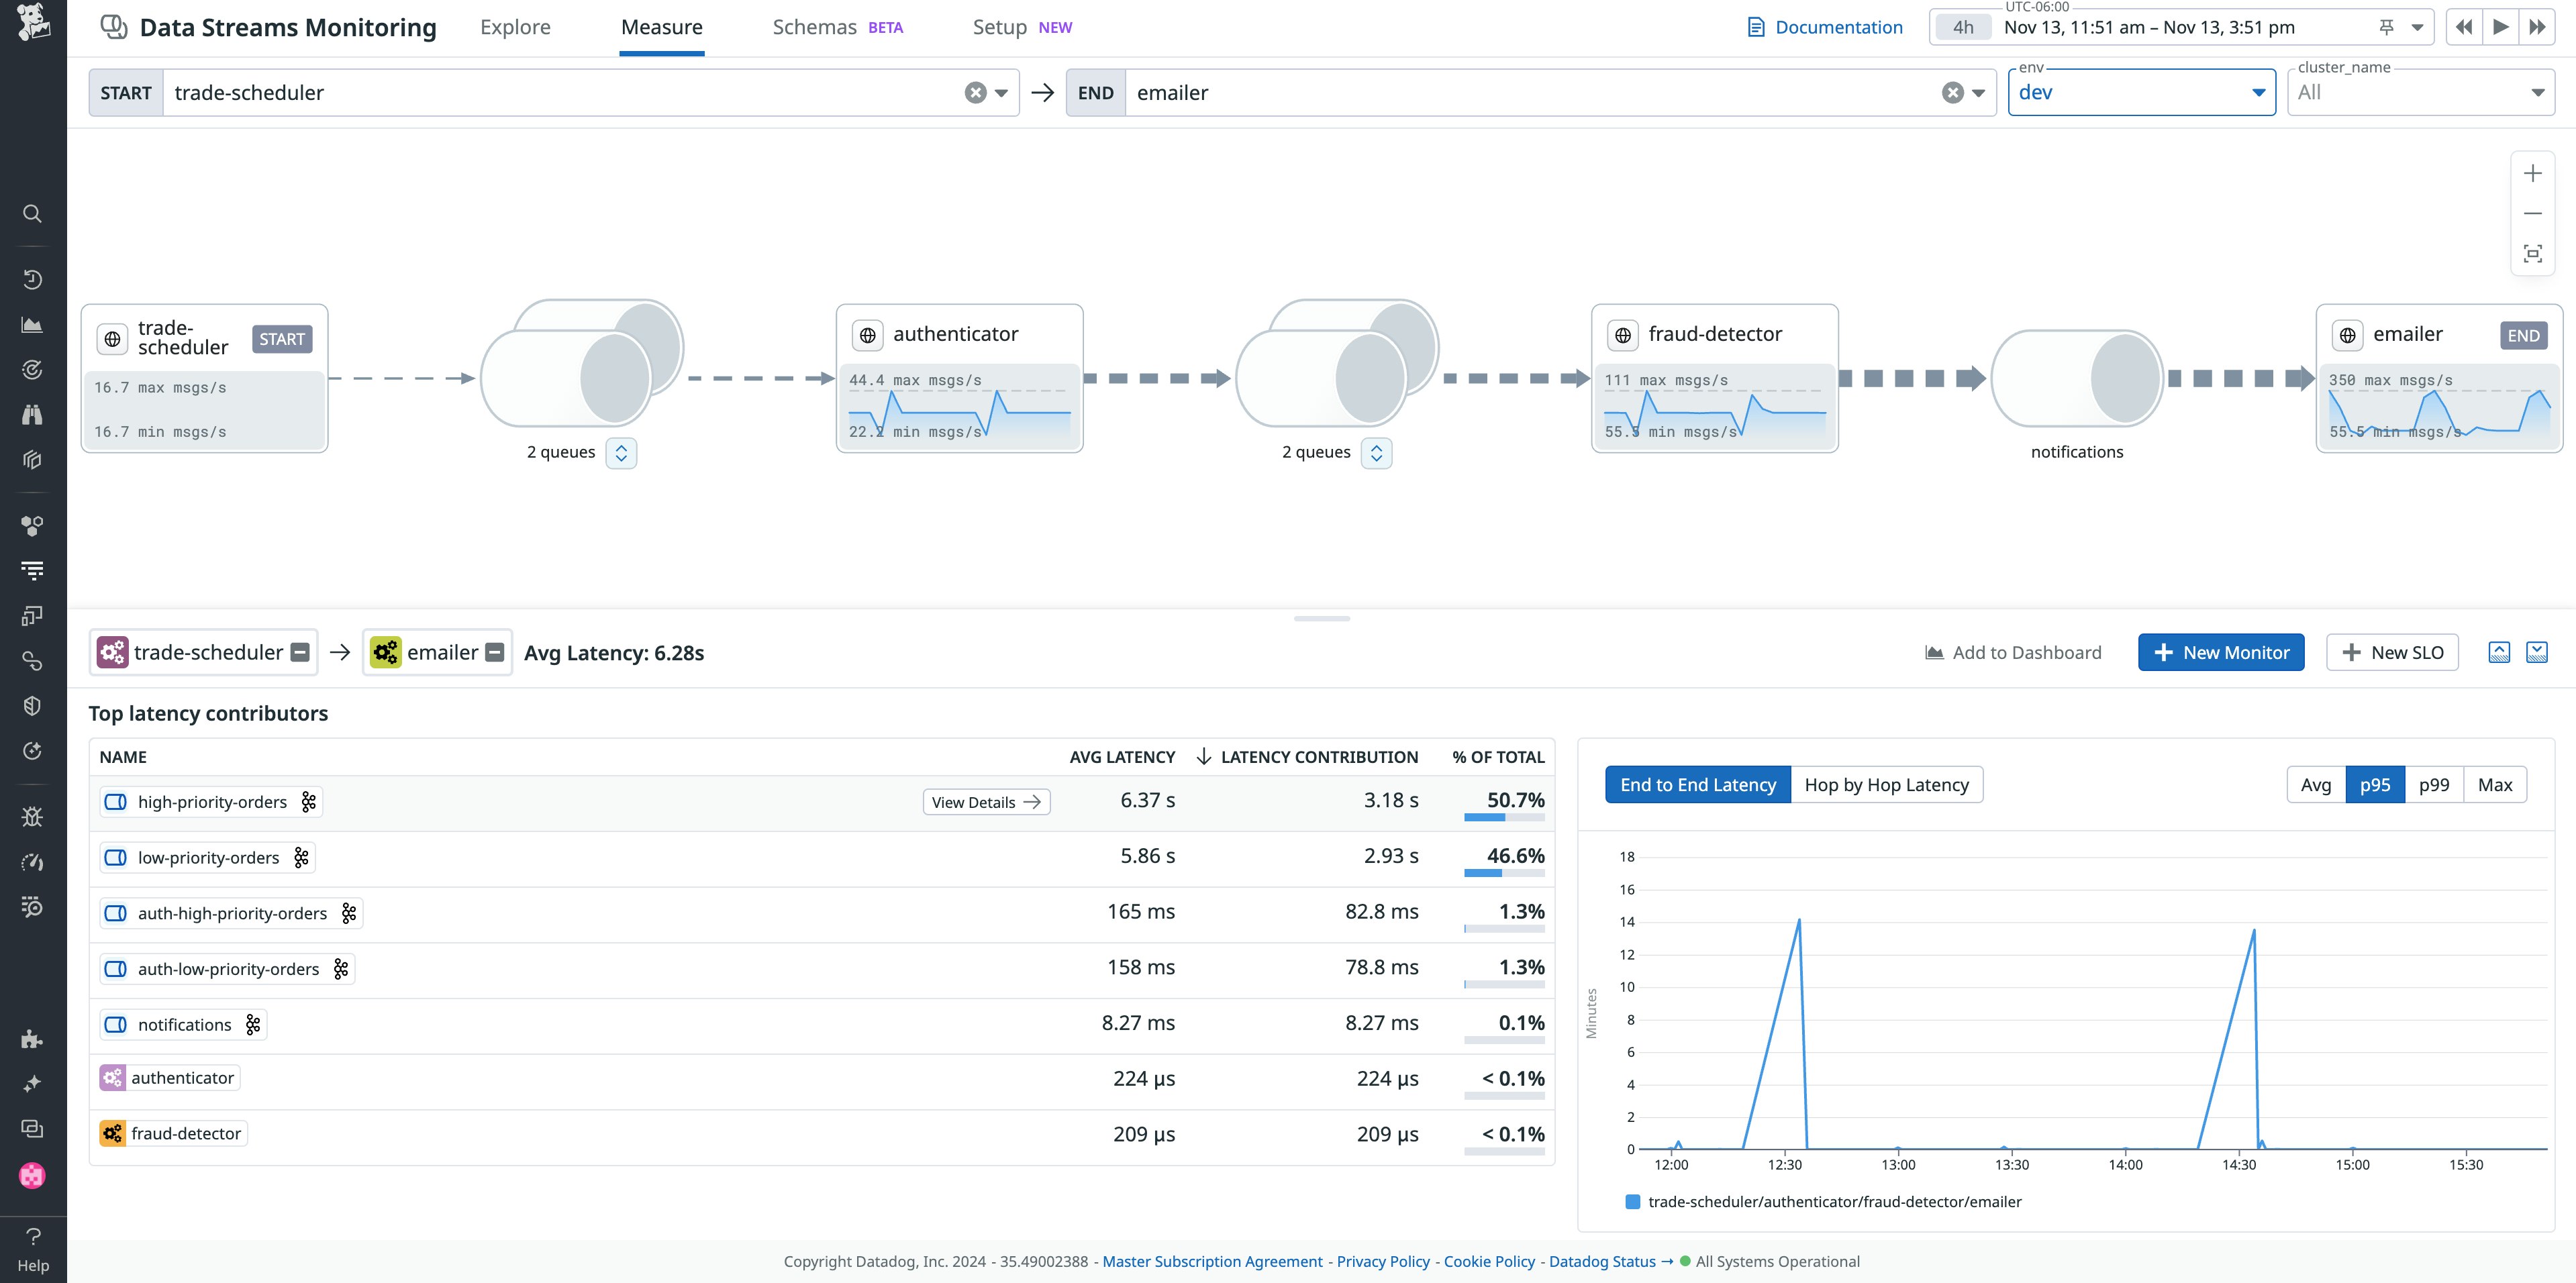
For example, measuring end-to-end latency with distributed tracing alone is difficult to accomplish in an EDA because of the asynchronous communication pattern. In a larger environment, an event can take multiple pathways to get to where it needs to go, making it difficult to obtain exact metrics on how long it should take to route from a producer to a consumer. Datadog addresses this challenge with DSM. From the moment a new event is generated until it arrives at its final destination, DSM enables you to track and measure end-to-end latency. Using Datadog DSM metrics, distributed traces, infrastructure metrics, and logs, you’ll gain full visibility into your EDA’s performance.
Detect errors immediately
Because EDAs use asynchronous communication, errors can go undetected without the proper monitoring in place. In a traditional request-response architecture, errors are detected immediately because services wait for a response before they perform their next task. As mentioned previously, services in an EDA move forward without waiting for a response, meaning you could be completely unaware that an error occurred. Configuring your monitoring system to identify errors quickly will simplify debugging in your EDA.
A dead-letter queue (DLQ) stores messages that the system is unable to process, enabling you to catch errors as they arise in your EDA. Unprocessed messages can occur due to an error in your event schema, suboptimal load balancing, or other issues. Implementing a DLQ enables you to review and debug problematic messages, helping you ensure that no events are permanently lost. Active monitoring of your DLQ allows you to detect errors immediately so they aren’t overlooked and you can address the root cause.
Organizations commonly use DLQs in tandem with services such as Amazon SQS, Apache ActiveMQ, or Microsoft Azure Service Bus. Datadog can track the performance of your DLQ with a variety of tooling, including DSM, providing metrics like message size and the number of messages sent, received, delayed, or deleted.
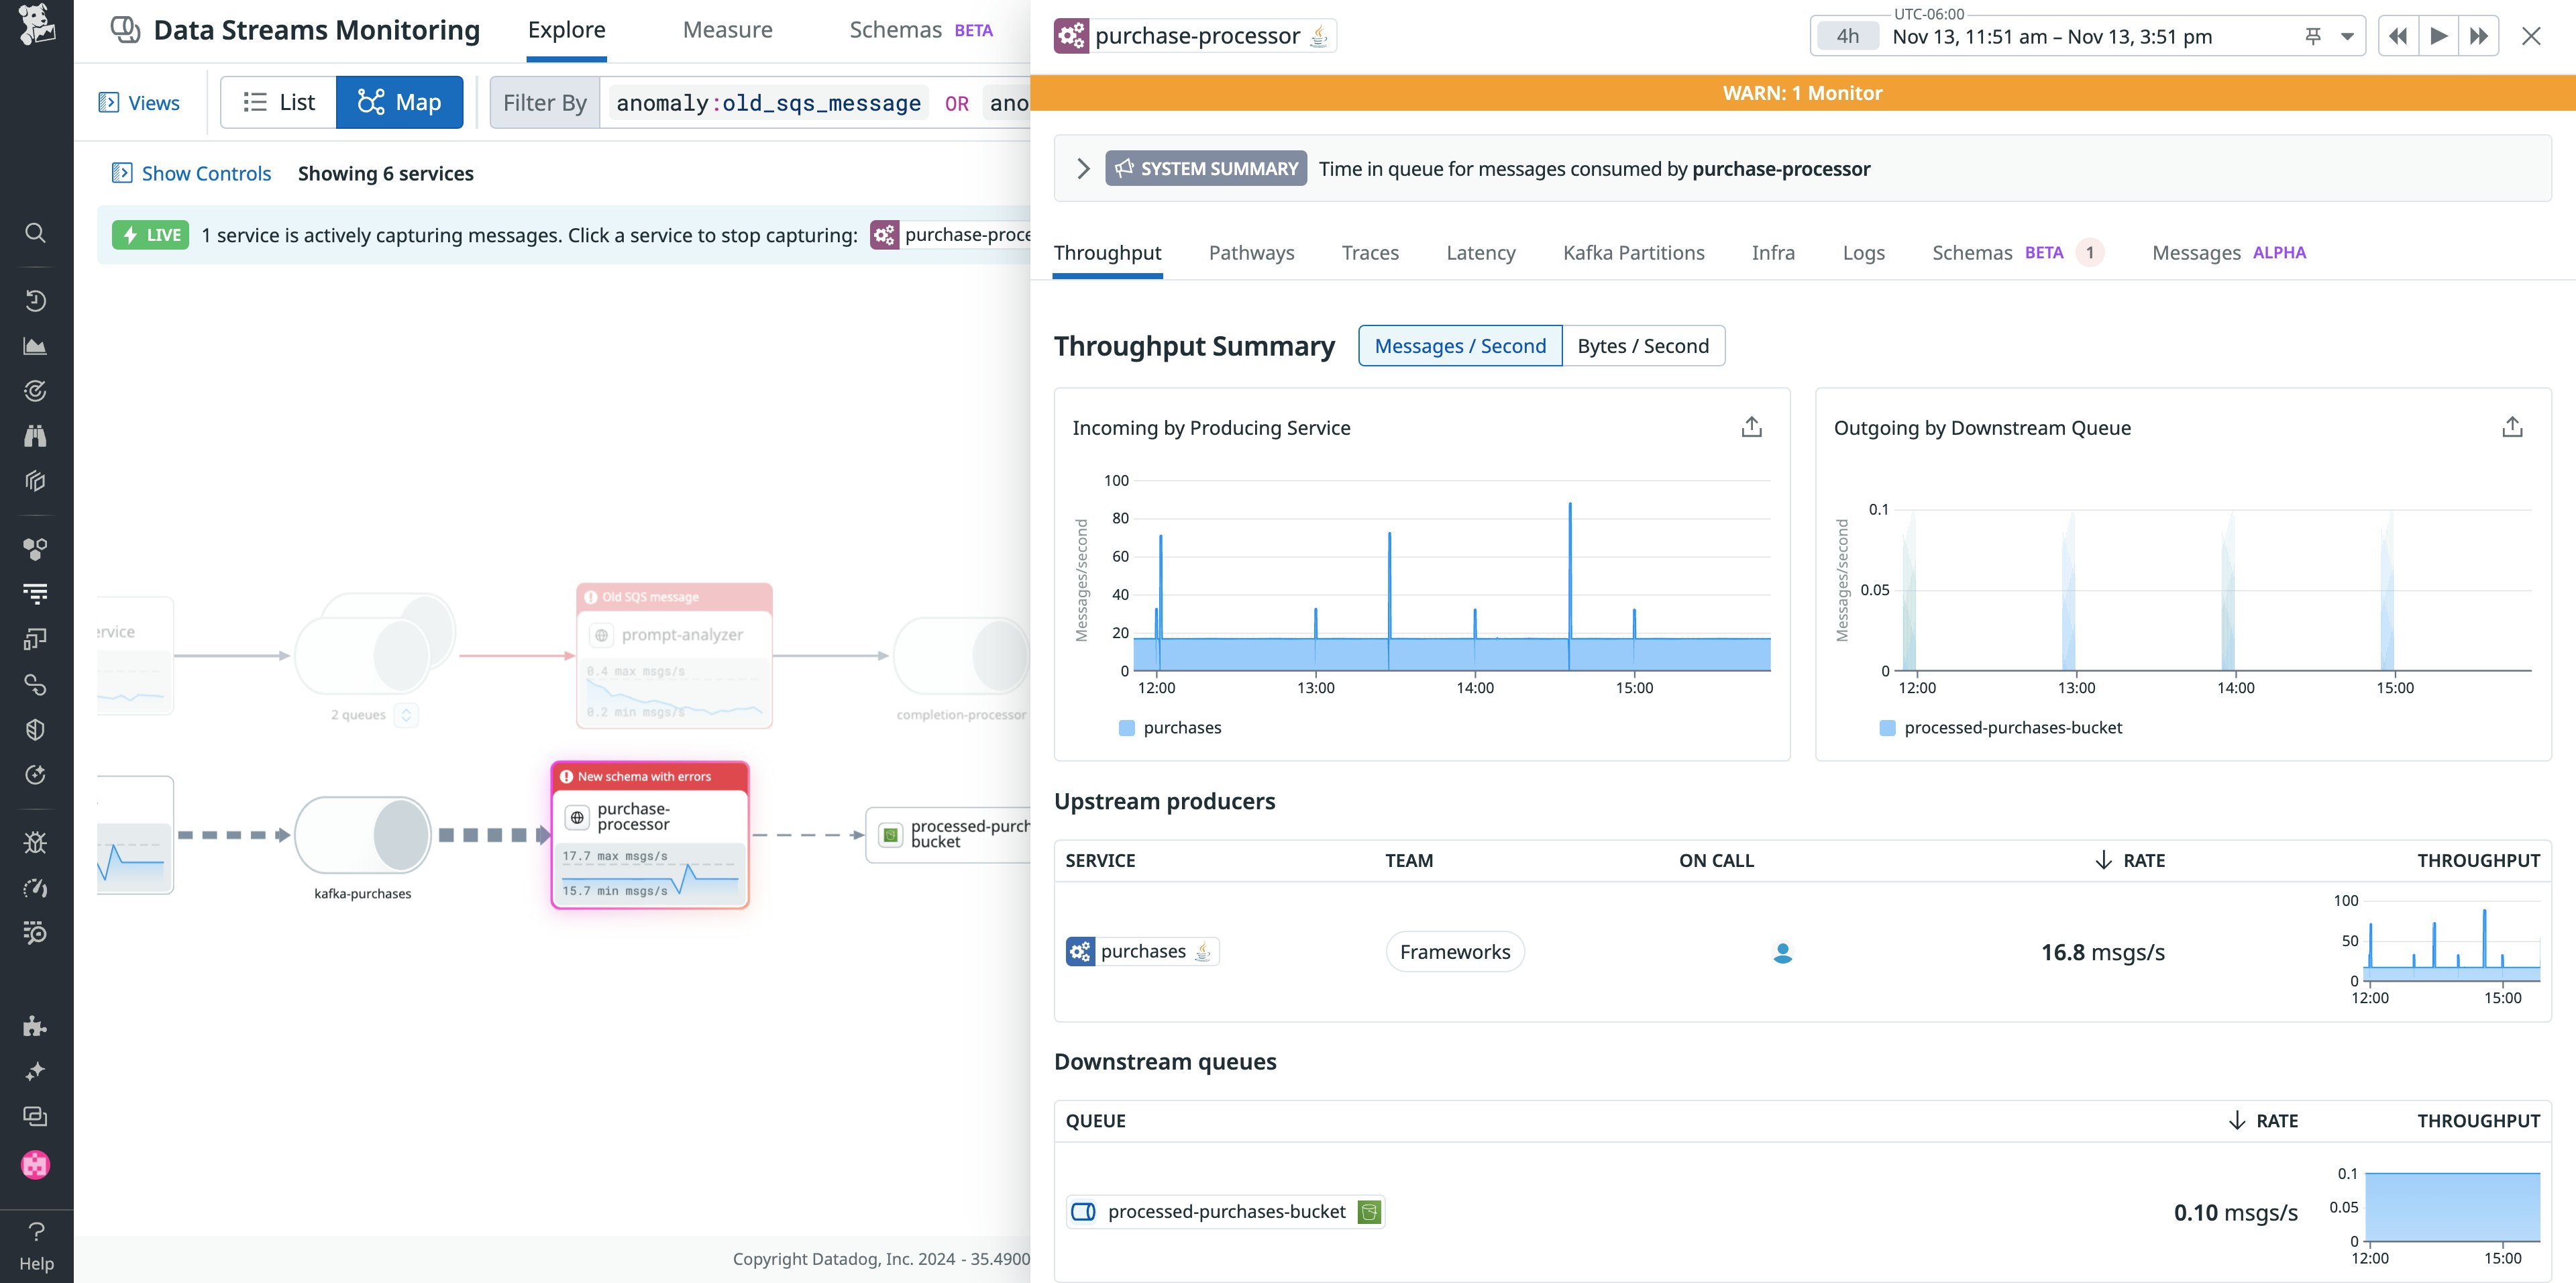
DSM conveniently shows you when service health is compromised, helps you remediate floods of backed-up messages, and differentiates which team has service ownership so you can seamlessly collaborate if an error occurs.
If the error is due to event schema, DSM’s schema tracking feature will help you identify the root cause and provide you with metrics that measure impact, like consumer and producer processing rates, error rates, and consumer lag. When a producer’s event schema is changed without a corresponding change to the consumers, data flow can be disrupted as consumers struggle to process the events. Pinpointing the root cause of the issue can prove difficult with the amount of services and components running in your EDA. Using the schema tracking feature, DSM provides visibility into any issues arising from an error in an event’s schema, newly created schemas, schema migrations, and more. DSM also allows you to set custom alerts for throughput metrics and correlate information with related logs and infrastructure metrics if you require additional context during an investigation.
Monitor your EDA holistically with Datadog
In this post, we examined the challenges of monitoring event-driven architectures compared to request-response architectures and outlined best practices for implementing effective monitoring. Comprehensive monitoring of your EDA will ensure that you have visibility into your system end-to-end, maintain optimal performance, and detect errors immediately.
To learn more, visit our DSM documentation or read our proposed reference architecture showing how to consolidate observability for your EDA. If you’re new to Datadog and want us to be a part of your monitoring strategy, you can get started now with a free trial.


