Jean-Mathieu Saponaro
We published more recently a complete series of posts about the top ElastiCache and native cache performance metrics, how to collect them, and how Coursera monitors them.
Application caches can greatly improve throughput and reduce latency of read-intensive workloads. They are commonly used to boost the performance of media transfers, games, or social networking applications.
AWS ElastiCache is a fully managed in-memory caching service, which allows you to choose between Redis and Memcached as its backend caching engine. ElastiCache is intended to serve as a drop-in replacement for running these data stores yourself. Since a cache can have critical impact on your application’s performance, it needs to be continuously monitored.
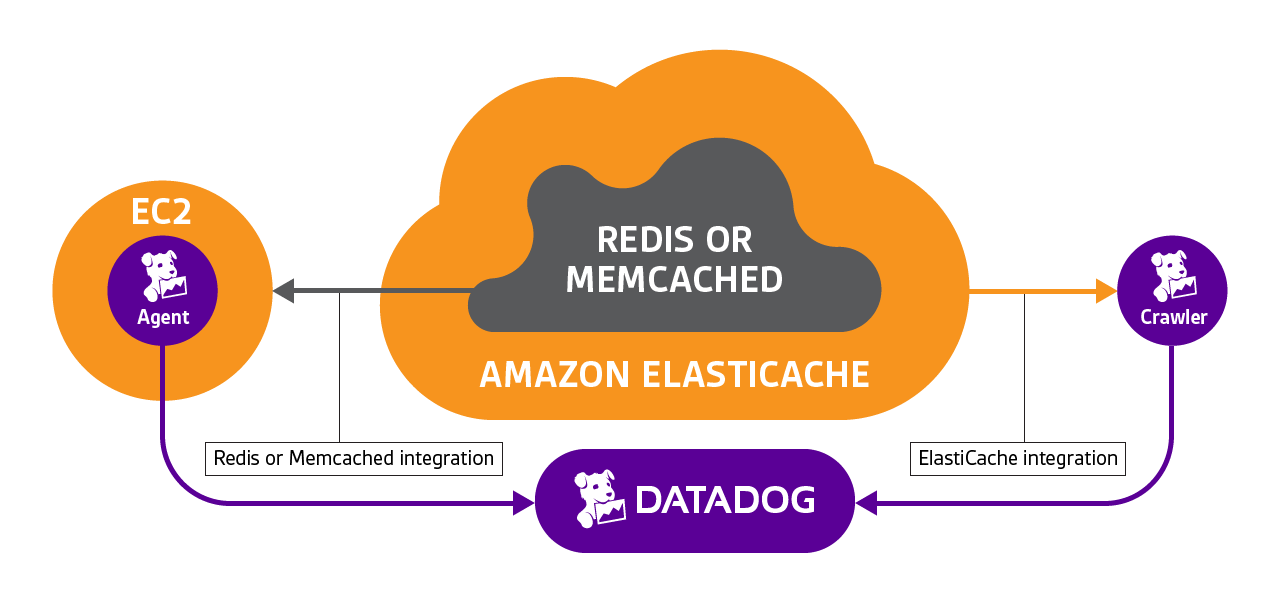
With our new ElastiCache integration, you can monitor ElastiCache metrics along with the native metrics from the backing software: Redis or Memcache. With this complete set of metrics you will have a full view of your cache.

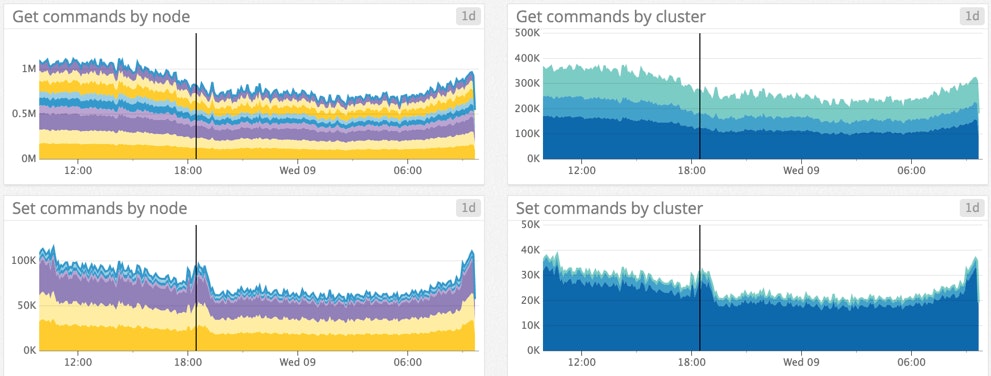
Default Elasticache integration dashboard
ElastiCache key metrics
Our integration allows you to access the entire rich set of ElastiCache metrics provided by AWS CloudWatch, enhanced by all the Datadog functionality you expect: correlation with metrics from other parts of your infrastructure, long-term retention to understand evolution history, custom alerts, and more.
Here are the key ElastiCache metrics you should consider monitoring:
- Number of commands processed: although AWS Cloudwatch reports this metric as a cumulative count only, you can also display it as a per-second value on Datadog. This throughput measurement can help identify latency issues, especially in Redis, which is single-threaded, and for which command requests are processed sequentially. Native Redis metrics don’t distinguish between Set or Get commands, but ElastiCache provides both. Metric name: aws.elasticache.set_type_cmds and aws.elasticache.get_type_cmds

- Cache Hits and Cache Misses measure the number of successful and failed lookups. With these two metrics you can calculate the hit rate, which reflects your cache efficiency. If it is too low, this may be because the cache size is too small for the working data set and the cache has to evict data too often. In this case you should add more nodes which will increase the total available memory in your cluster so that more data can fit in the cache. A high hit rate help to reduce your application response time. Metric calculation: aws.elasticache.get_hits / aws.elasticache.cmd_get
- Evictions happen when the memory usage limit is reached and the cache engine has to remove items to make space. The evictions follow the method defined in your cache configuration, such as LRU for Redis. If your eviction rate is steady, and your cache hit rate is acceptable, then your cache probably has enough memory. Metric name: aws.elasticache.evictions
- SwapUsage increases when the process runs out of memory and the operating system starts “swapping”—using disk to hold data that should be in memory. Swapping allows a process to continue running, but severely degrades the performance of your cache and any applications relying on its data. According to AWS, swap shouldn’t exceed 50MB with Memcached. Though AWS makes no similar recommendation for Redis (they might have configured Redis to evict rather than swap), we recommend that you set an alert to go off if Redis swap usage were to exceed 50MB, too. Metric name: aws.elasticache.swap_usage
- Current connections measures the number of connections between clients and your cache. If this metric goes too high, you may run out of connections. Metric name: aws.elasticache.curr_connections
- Number of nodes per cluster and the changes to that number can now be tracked and correlated with other metrics such as latency. In this case you should review your configuration, and also make sure that you have a sufficient number of cache nodes to support good application performance even when nodes are offline. Metric calculation: aws.elasticache.node_count grouped by cluster
- **(Redis only) Replication Lag **is also a key metric to monitor in order to prevent serving stale data. By automatically streaming data into a secondary cluster, replication increases read scalability and prevents data loss. Replicas contain the same data as the primary node so it can serve reads as well. The replication lag measures the time needed to apply changes from the primary cache node to the replicas. Metric name: aws.elasticache.replication_lag
- **CPU utilization **at high levels can indirectly indicate high latency. If you are observing a low number of commands processed per second, or high latency as described below, check CPU usage to ensure that it does not exceed a certain percentage. Metric name: aws.elasticache.cpuutilization
Native metrics for greater resolution
As mentioned above, ElastiCache supports both Redis or Memcached as caching engines. Datadog can also access metrics directly from these two backing technologies to give an even more granular picture of your ElastiCache service. Step-by-step instructions here show you how to enable native metric collection in addition to CloudWatch metric collection.

Since native metrics are directly pulled by the Datadog agent from your cache engine, they are collected in real-time and at high resolution. You can use native metric equivalents for:
- Cache hits and misses: redis.stats.keyspace_hits / misses, memcache.get_hits / misses instead of aws.elasticache.cache_hits / misses
- Current connections: redis.net.clients, memcache.curr_connections instead of aws.elasticache.curr_connections
- Evictions: redis.keys.evicted, memcache.evictions instead of aws.elasticache.evictions
- Replication Lag (Redis only): redis.replication.delay instead of aws.elasticache.replication_lag
Native metrics for additional information
Some metrics are only available via native Redis or Memcached integrations. Some of the most important include:
- Memory usage reports the total number of bytes allocated by your cache engine. If it exceeds available memory, it can cause swapping and impact your cache performance. Metric name: redis.mem.used (accurate) and memcache.bytes (approximate)
- **(Redis only) Memory fragmentation ratio **represents the ratio of memory used as seen by the operating system to memory allocated by Redis. If it is high (above 1.5) then you have significant memory allocation inefficiency. The easiest way to recapture the memory may be to restart the instance. If it is low (below 1) then your system is swapping, see above. Metric name: redis.mem.fragmentation_ratio
- **(Redis only) Latency **is one of the best ways to directly observe your cache performance in Redis, which is single-threaded. If latency exceeds a certain threshold, you may want to be alerted, and then investigate. Common causes for high latency include high CPU usage and swapping, as described above. Unfortunately, Memcached doesn’t provide a direct measurement of latency, so you will need to rely on throughput measurement via number of commands processed, described above. Metric name: redis.info.latency_ms alongside aws.elasticache.swap_usage
Custom Tags
AWS recently launched custom tags for ElastiCache clusters. You can use these tags within Datadog to split, aggregate, or filter your metrics—just as you can with your EC2 instance metrics.
Correlate metrics with cluster-level events
In addition to the metrics described above, all the events related to ElastiCache and your caching engine are recorded in Datadog’s event stream. Example events include: cluster creation, cluster deletion, node addition, and node removal. With these events, you can correlate changes in your ElastiCache infrastructure with changes in performance throughout your infrastructure.
If you are already a Datadog customer, get started with the ElastiCache integration here. Otherwise, to try it out in your own environment, you can sign up for a free trial of Datadog.


