
Duncan Harvey
Software Engineer

Kathie Huang
Software Engineer

Piyali Banerjee
Product Manager
Microsoft’s Azure Functions serverless compute service abstracts away infrastructure management to simplify how teams deploy and operate applications. However, the managed environment can make it harder to understand what happens inside those applications after deployment. Traditional approaches that rely on agents, extensions, and sidecars for direct collection of telemetry data aren’t available across every Azure Functions hosting plan, which can leave gaps in end-to-end visibility. Developers often must piece together logs, metrics, and traces from different sources to troubleshoot issues.
Datadog has expanded Azure Functions observability with enhancements to Serverless Monitoring that broaden support across hosting plans and provide deeper insight into application performance. In this post, we’ll explore how you can:
Track requests through Azure Functions with distributed tracing
Find performance bottlenecks with Datadog Continuous Profiler
Collect telemetry data across Azure Functions hosting plans
With the Datadog extension for Azure App Service, Datadog already provides direct telemetry data collection for Windows-based .NET function apps on Dedicated or Premium hosting plans. Azure Functions on Linux, however, does not offer the same extension-based installation path.
Datadog’s Serverless Compatibility Layer expands direct telemetry data collection to function apps running on either Linux or Windows, regardless of hosting plan. The Serverless Compatibility Layer is a lightweight package for .NET, Python, Node.js, and Java that runs alongside your function code. It detects the Azure Functions environment at startup and acts as a local aggregation point, batching application telemetry data before sending it to Datadog.
Track requests through Azure Functions with distributed tracing
Serverless applications rarely consist of a single function. User requests often move through HTTP endpoints, messaging services, databases, and additional functions before returning a response. Distributed tracing from Datadog Application Performance Monitoring (APM) connects related activity across that request path, helping you understand where latency occurs and where failures begin.
Distributed tracing for Azure Functions is generally available for supported runtimes, including .NET, Python, Node.js, and Java. After you initialize the tracer, Datadog automatically instruments supported frameworks, propagates trace context into and out of functions, and builds an end-to-end view of every request.
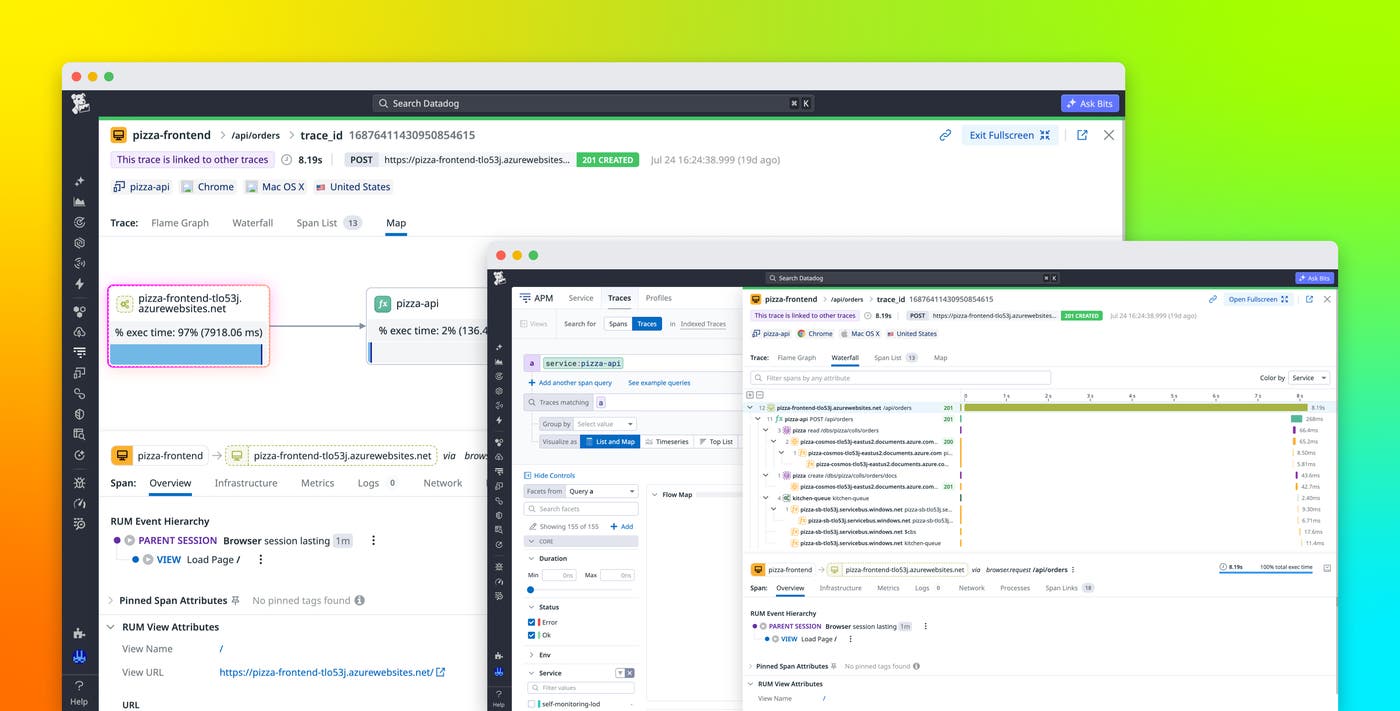
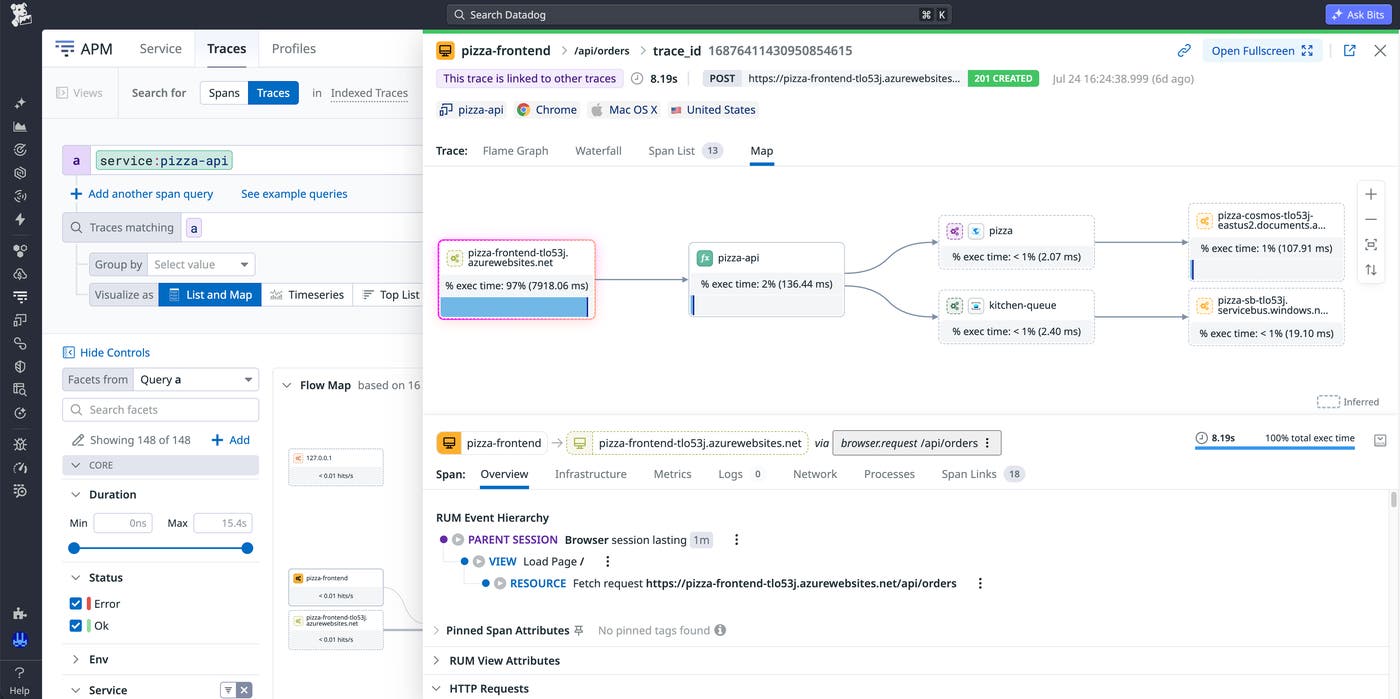
The Service Map, shown in the following screenshot, discovers relationships between functions and downstream dependencies. It displays latency and error rates on every connection to help you identify unhealthy services more quickly.
Connect frontend activity with backend traces
Frontend and backend telemetry data often live in separate tools, making it difficult to determine why a user experienced a slow page or failed transaction. Datadog bridges that gap by connecting Real User Monitoring (RUM) sessions with Azure Functions traces.
When a user action triggers a backend function, the Datadog Browser SDK injects trace headers into the request. Datadog associates the resulting backend trace with the originating RUM session and adds relevant context, including the session ID, current view, and user details. You can then move directly from the RUM event to the backend spans that show how the request was processed.
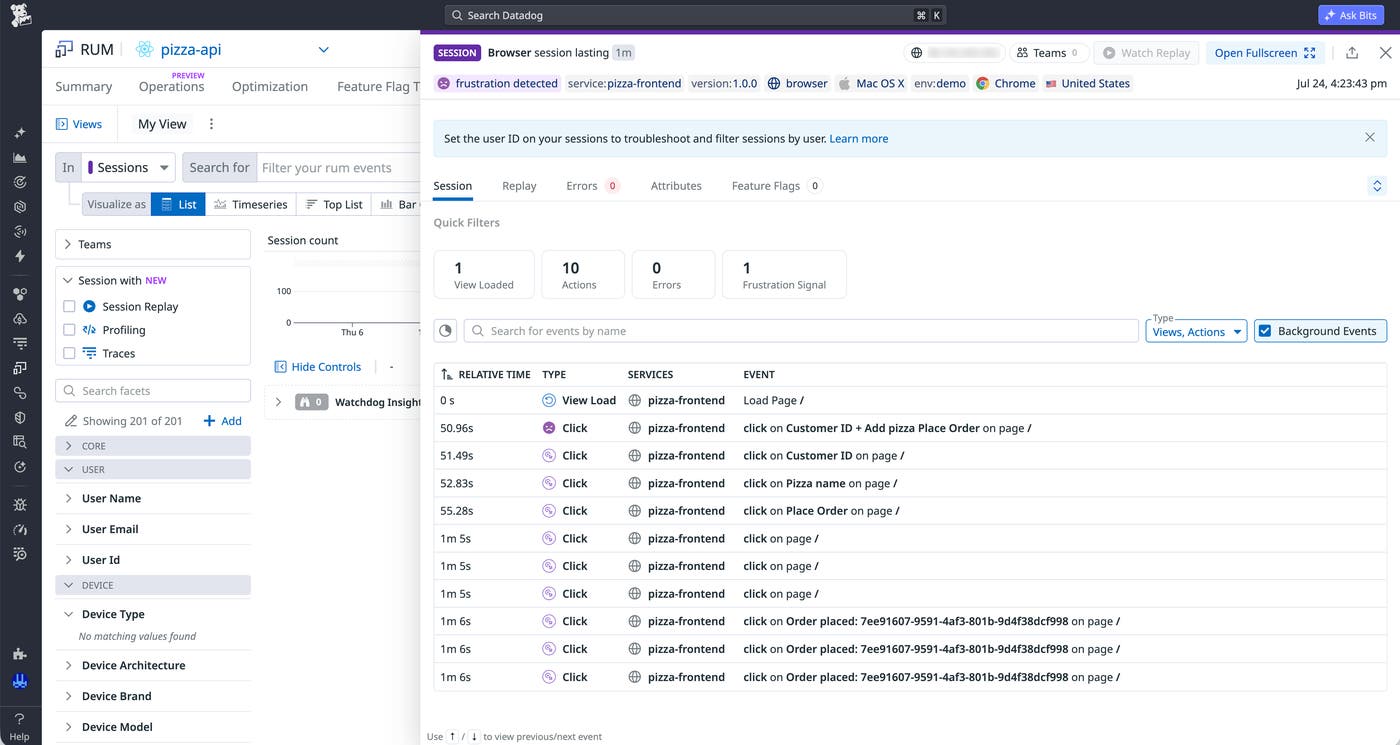
Session Replay provides another starting point for the same investigation. After you watch a user complete an action in the UI, you can open the corresponding distributed trace to see every downstream span related to the request.
Preserve trace context across Azure managed services
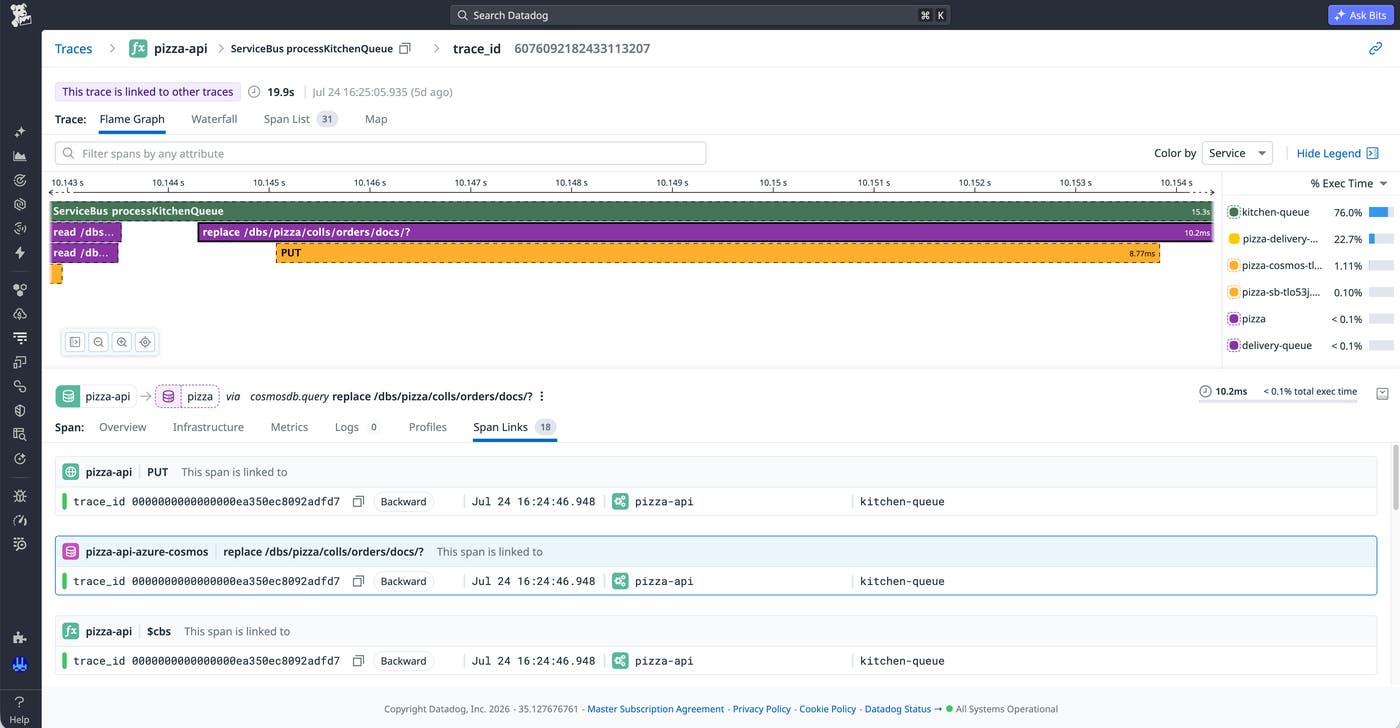
Asynchronous messaging can interrupt trace continuity because request context might not follow a message into a queue or event stream. Datadog preserves trace continuity for Azure Service Bus and Azure Event Hubs by injecting trace context into message metadata when a function publishes a message. Datadog then extracts that context when another function consumes the message. When the producer and consumer operations belong to separate traces, Datadog connects them with span links. The publishing and consuming functions run independently, but the span links preserve the relationship between their invocations.
Datadog also represents Azure Cosmos DB create, read, update, and delete (CRUD) operations in distributed traces as inferred spans. These operations appear alongside function spans with automatic instrumentation. Cosmos DB spans show how much latency each database operation contributes. By comparing the duration and placement of Cosmos DB spans with messaging and function spans across the related traces, you can see where latency accumulates. You can then determine whether a delay comes from a database query, message processing, or application code.
Analyze Azure Functions CPU usage with enhanced metrics
Azure provides CPU metrics for Azure Functions, and Datadog surfaces those metrics through the crawler-based Azure integration. Azure updates those metrics at intervals of 1 minute or longer, which can make short CPU spikes difficult to identify.
Serverless Monitoring samples CPU usage from the function app every second and publishes distribution metrics every 10 seconds. The enhanced CPU metrics help you distinguish brief bursts of CPU activity from sustained utilization and understand how CPU usage varies across function invocations.
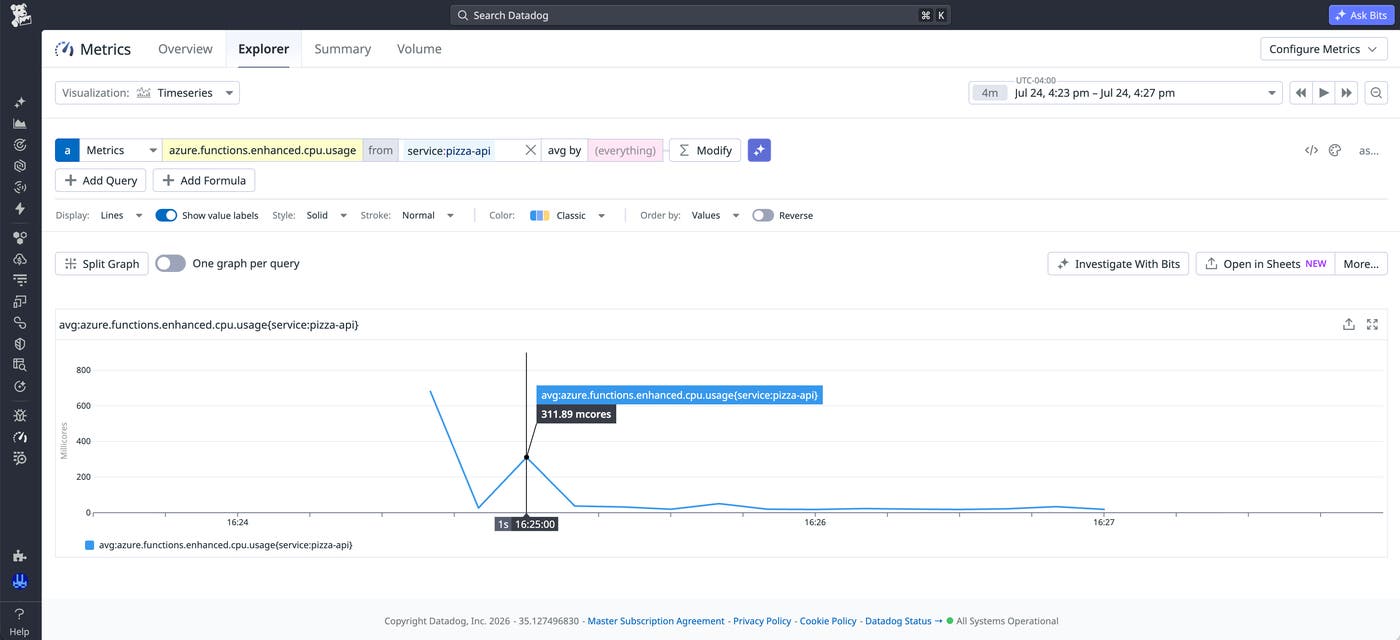
Enhanced metrics also support proactive alerting. You can create monitors that notify your team as CPU utilization approaches saturation, helping you investigate potential performance issues before they affect users.
All enhanced metrics use the azure.functions.enhanced.* metric prefix. You can enable enhanced metrics by updating to the latest version of the Serverless Compatibility Layer.
Find performance bottlenecks with Datadog Continuous Profiler
While enhanced metrics tell you when CPU utilization increases, Datadog Continuous Profiler helps you determine which code paths consume that CPU time. Continuous Profiler periodically captures call stacks from running functions and aggregates them into flame graphs that you can explore. By examining the profile from the affected time window, you can compare call paths and prioritize the code changes that are most likely to reduce CPU or I/O overhead.

Continuous Profiler for Azure Functions is available in Preview for Python and Node.js. After you enable profiling by setting DD_PROFILING_ENABLED=true, Datadog begins collecting profiles without requiring code changes.
Start monitoring your Azure Functions applications with Datadog
Azure Functions applications often depend on multiple services that run across different runtimes and hosting plans. Datadog’s expanded Azure Functions support provides broader deployment coverage through the Serverless Compatibility Layer, in addition to distributed tracing, higher-resolution CPU metrics, and code-level profiling. Together, these capabilities help you follow requests across services, identify resource constraints, and trace performance bottlenecks back to the relevant application code.
To learn more and get started, read our Serverless Monitoring for Azure Functions documentation and our Azure database and messaging services documentation.
If you’re new to Datadog, you can sign up for a 14-day free trial to start monitoring your Azure Functions applications.
