John Matson
AWS Fargate allows you to run applications in Amazon Elastic Container Service without having to manage the underlying infrastructure. With Fargate, you can define containerized tasks, specify the CPU and memory requirements, and launch your applications without spinning up EC2 instances or manually managing a cluster.
Datadog has proudly supported Fargate since its launch, and we have continued to collaborate with AWS on best practices for managing serverless container tasks. Datadog’s integration with AWS Fargate enables you to collect real-time, high-resolution metrics from all your containerized tasks. It also enables Autodiscovery to detect containerized services running on Fargate and automatically configures Datadog Agent checks for those services.
The integration provides more than a dozen system metrics from Fargate that track the resource utilization (CPU, memory, I/O, etc.) of your tasks. And beginning with Fargate 1.4.0, Datadog increases your visibility by leveraging new Fargate network performance metrics. You can now see the rate of traffic to and from your containers, as well as network errors and dropped packets. You can also view code-level performance data with Datadog’s Continuous Profiler, to analyze the resource usage of your AWS Fargate services’ code. The Datadog integration brings all of this together so you can analyze and alert on the performance of your Fargate tasks and services alongside the rest of your infrastructure.
In this post, we’ll show a simple example of how you can deploy and monitor tasks on AWS Fargate with the Datadog Agent. Note that you will need version 6.1.1 or higher of the Datadog Agent to take full advantage of the Fargate integration.
Set up real-time monitoring for Amazon Fargate tasks in minutes with Datadog.
Deploy the Datadog Agent on AWS Fargate
To start monitoring AWS Fargate tasks and services, you can deploy the containerized Datadog Agent on Fargate. In addition to passing the usual DD_API_KEY environment variable, you must set the ECS_FARGATE environment variable to true.
The example task definition below deploys the Datadog Agent to Fargate, along with a Redis container in the same task.
{ "family": "redis-datadog", "networkMode": "awsvpc", "containerDefinitions": [ { "name": "redis", "image": "redis:latest", "essential": true, "dockerLabels": { "com.datadoghq.ad.instances": "[{\"host\": \"%%host%%\", \"port\": 6379}]", "com.datadoghq.ad.check_names": "[\"redisdb\"]", "com.datadoghq.ad.init_configs": "[{}]" } }, { "name": "datadog-agent", "image": "datadog/agent:latest", "essential": true, "environment": [ { "name": "DD_API_KEY", "value": "$YOUR_API_KEY" }, { "name": "ECS_FARGATE", "value": "true" } ] } ], "requiresCompatibilities": [ "FARGATE" ], "cpu": "256", "memory": "512"}After saving that task definition locally as redis-datadog.json, you can register the task with ECS using the AWS CLI:
aws ecs register-task-definition --cli-input-json file://./redis-datadog.jsonOnce the task has been registered, you can run it in a Fargate cluster, making sure to provide one or more private subnets and security groups for your task. Note that Fargate version 1.4.0 or greater is required, so we specify the platform version in the command:
# create a cluster if you don’t already have oneaws ecs create-cluster --cluster-name "fargate-test"
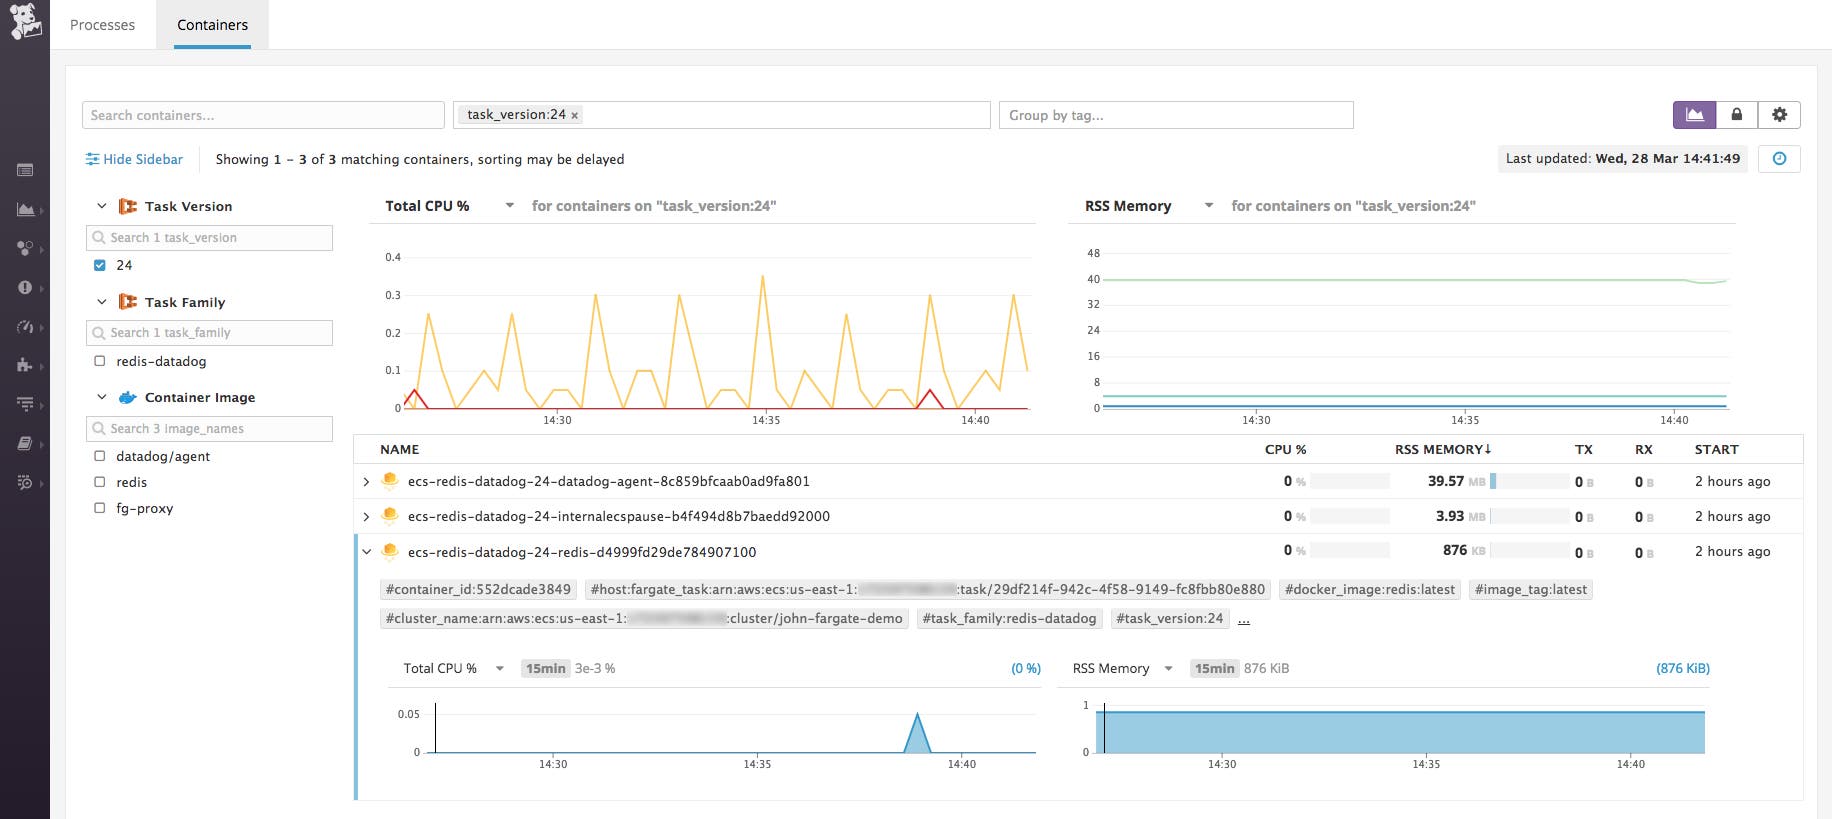
aws ecs run-task --cluster fargate-test \--network-configuration "awsvpcConfiguration={subnets=["$PRIVATE_SUBNET"],securityGroups=["$SECURITY_GROUP"]}" \--task-definition arn:aws:ecs:us-east-1:$AWS_ACCOUNT_NUMBER:task-definition/redis-datadog:1 \--region us-east-1 --launch-type FARGATE --platform-version 1.4.0You can check the status of your task in the ECS console. In just a few moments, your task should be up and running, and your Fargate containers will appear on Datadog’s Containers page, where you can search, filter, and view high-resolution system metrics from all the running containers in your infrastructure.
Monitoring AWS Fargate containers with Autodiscovery
In the dockerLabels section of the task definition above, we applied three labels to the Redis container: this is the metadata that the Datadog Agent needs to auto-detect Redis and start collecting metrics from it. The labels specify the name of the Datadog Agent check to apply (redisdb), an empty list of init_configs, and the host and port where Redis will run. Note that the %%host%% template variable will dynamically configure the Agent to collect metrics from the Redis container, wherever it is running, but the %%port%% template variable is not supported in ECS, so we manually provide the default Redis port, 6379.
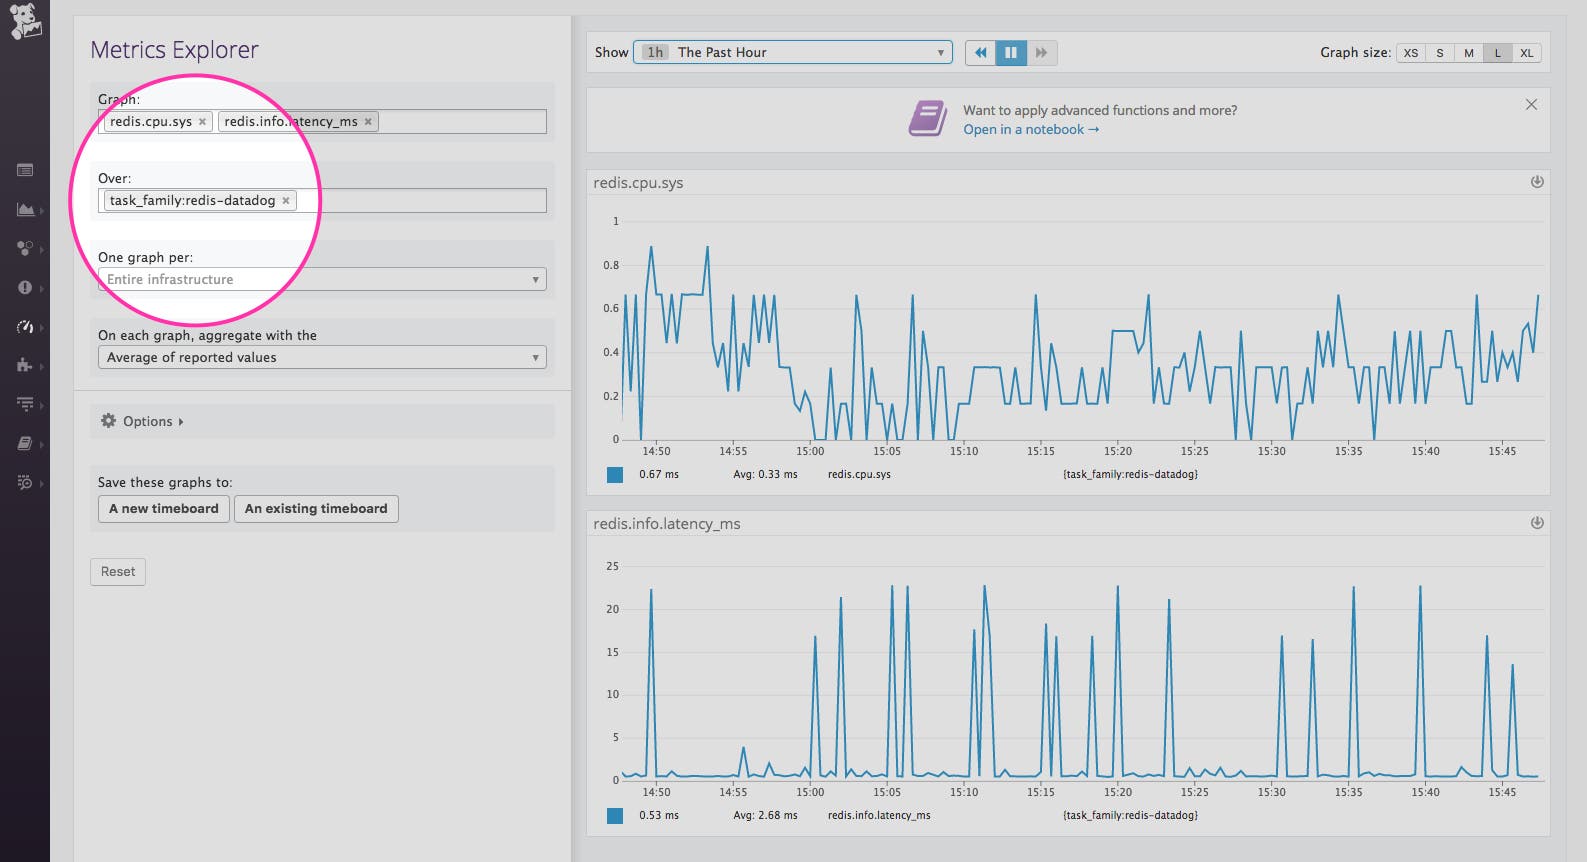
With Autodiscovery properly configured, our newly deployed Datadog Agent starts collecting metrics from the Redis container automatically.
Send logs natively to Datadog
To centralize logging from your entire stack, Datadog also provides native support for FireLens for Amazon ECS. You can now seamlessly route container logs from AWS Fargate to Datadog using built-in Fluent Bit support. Read our blog post about Fargate and FireLens for more information.
Container monitoring, minus the host
AWS Fargate supports both ECS and EKS workloads, so you can focus on services and applications rather than hosts and underlying infrastructure. Just as with AWS Lambda, Datadog provides full visibility into the health and performance of all your applications, wherever they run. Datadog’s Continuous Profiler also enables you to monitor the resource usage of application code running on AWS Fargate alongside the rest of your infrastructure. To learn more about how to set up profiling (available for Java, Python, and Go) see our documentation.
See our monitoring guide and documentation for more information about monitoring ECS on Fargate and EKS on Fargate with Datadog. And if you’re not yet using Datadog, you can sign up for a free trial here.

