
Jordan Obey
MongoDB Atlas is a fully managed NoSQL database that deploys onto the cloud platform of your choice: AWS, Azure, or GCP. Atlas provides built-in security features and automatically distributes clusters across availability zones to help ensure high availability and uptime. We’re excited to announce that with our new integration, you can now monitor MongoDB Atlas health and performance metrics alongside the rest of your cloud infrastructure and the applications that depend on your database.
Monitor MongoDB Atlas health and performance
After you’ve set up the integration, you’ll have access to an out-of-the-box dashboard of Atlas health and performance metrics. You can clone and customize this dashboard to display monitoring data from related services to add fuller context to your Atlas infrastructure and ease the process of diagnosing and troubleshooting any issues that arise.
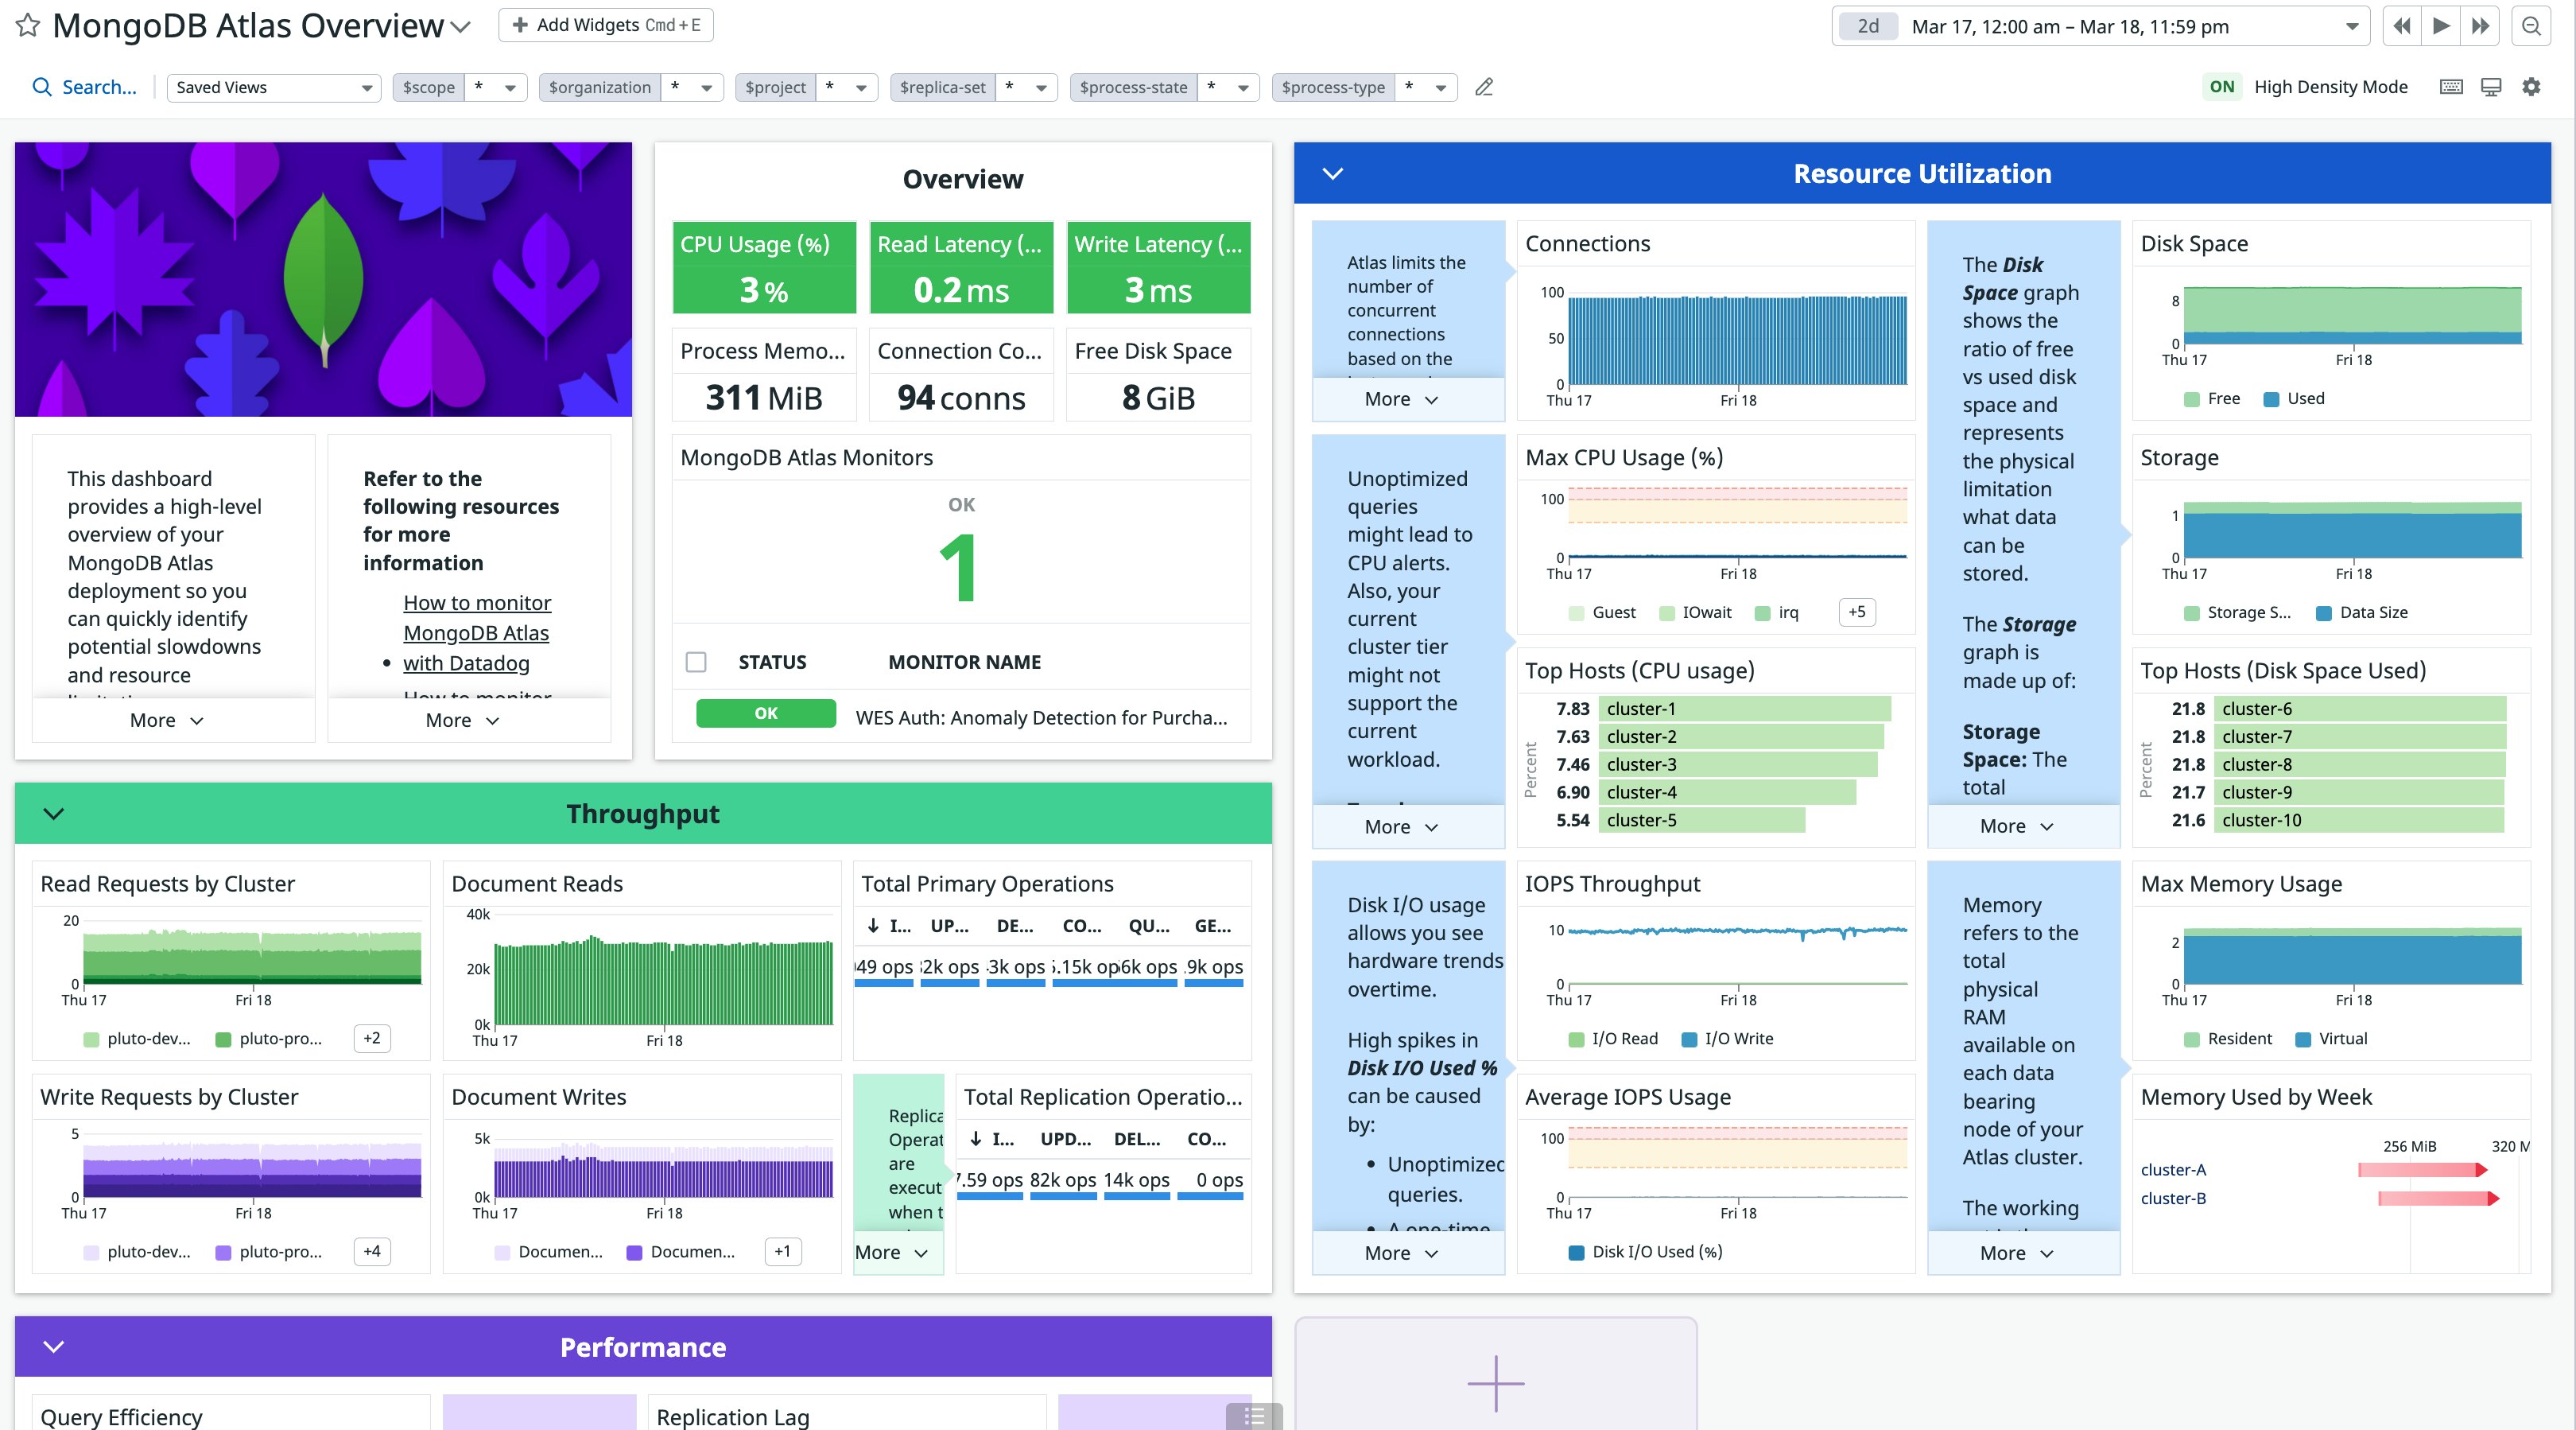
Catch sudden changes in database throughput
Monitoring throughput metrics is critical for spotting potential cluster performance issues and ensuring that your database is receiving and processing queries as expected. A drastic drop in throughput could indicate network issues or problems connecting to client applications, which would warrant further investigation to determine causes. Alternatively, if your database is overloaded with requests, you may need to scale up or out.
Our new MongoDB Atlas integration provides real-time throughput metrics, broken down by operation type. This means that you can get critical visibility into your database activity on a more granular level, across both read (query, getmore) and write (insert, update, delete) operations. You can also set up a Datadog alert to automatically get notified about unexpected changes in your database’s workloads.

Monitor read and write latency
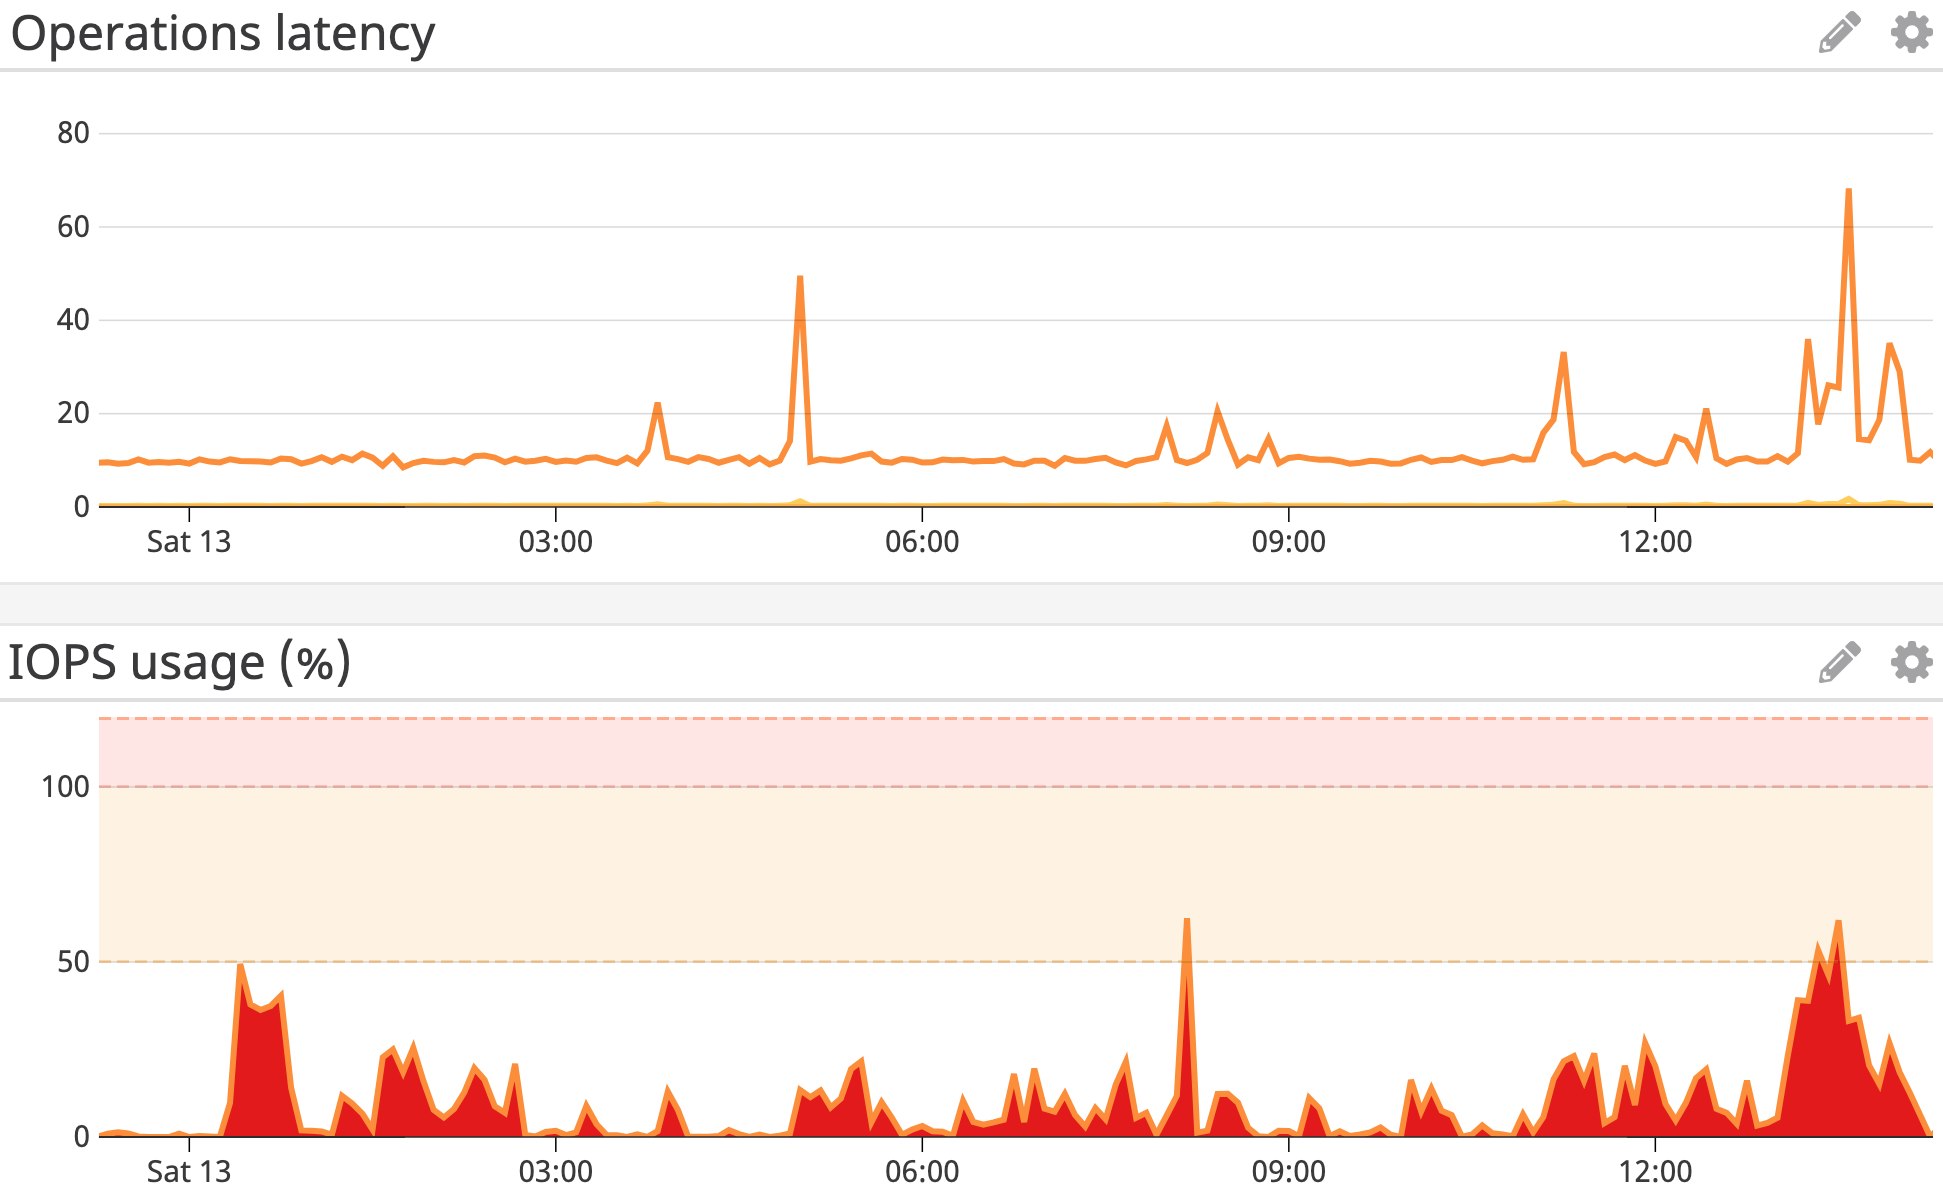
No matter your use case, you will want to make sure your MongoDB Atlas cluster receives and processes requests efficiently, so you can detect and diagnose any performance issues. With our integration, you can track the average latency of read and write operations over time and correlate them with other work metrics like throughput to determine if your database is able to keep up with its workload.
If you encounter an unexpected spike in database latency, check for resource constraints. Our integration includes resource utilization metrics like CPU and I/O utilization to help you investigate and diagnose performance issues. For example, if write latency is high and I/O utilization is approaching 100 percent, it could signal that you need to scale your cluster’s IOPS and/or optimize your queries, as detailed in the documentation.
Track current connection count
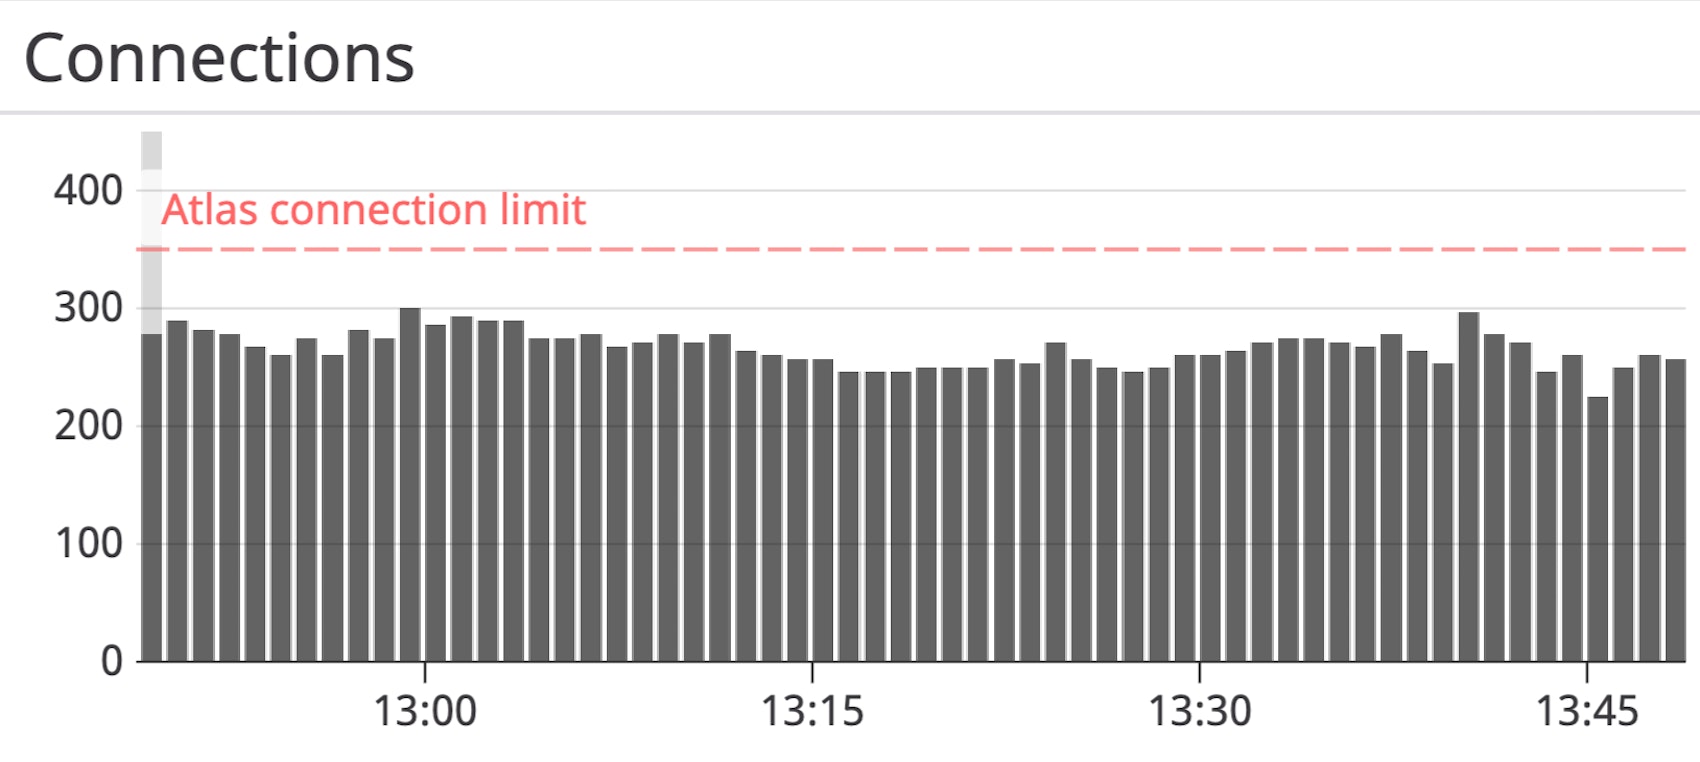
MongoDB Atlas keeps a pool of connections open so that it can reuse them in order to serve client requests more efficiently. Because each connection requires about 1 MB of memory, Atlas limits the number of concurrent connections based on the instance size of your cluster. If it reaches that limit, further connections will be refused. You can set up an alert in Datadog to automatically get notified when the number of current connections is approaching the limit, giving you enough time to close any connections that are not being used. If you anticipate that the number of client connections will remain high (due to an expected increase in traffic, for example), you can also consider scaling your cluster to an instance size that supports a larger number of connections.
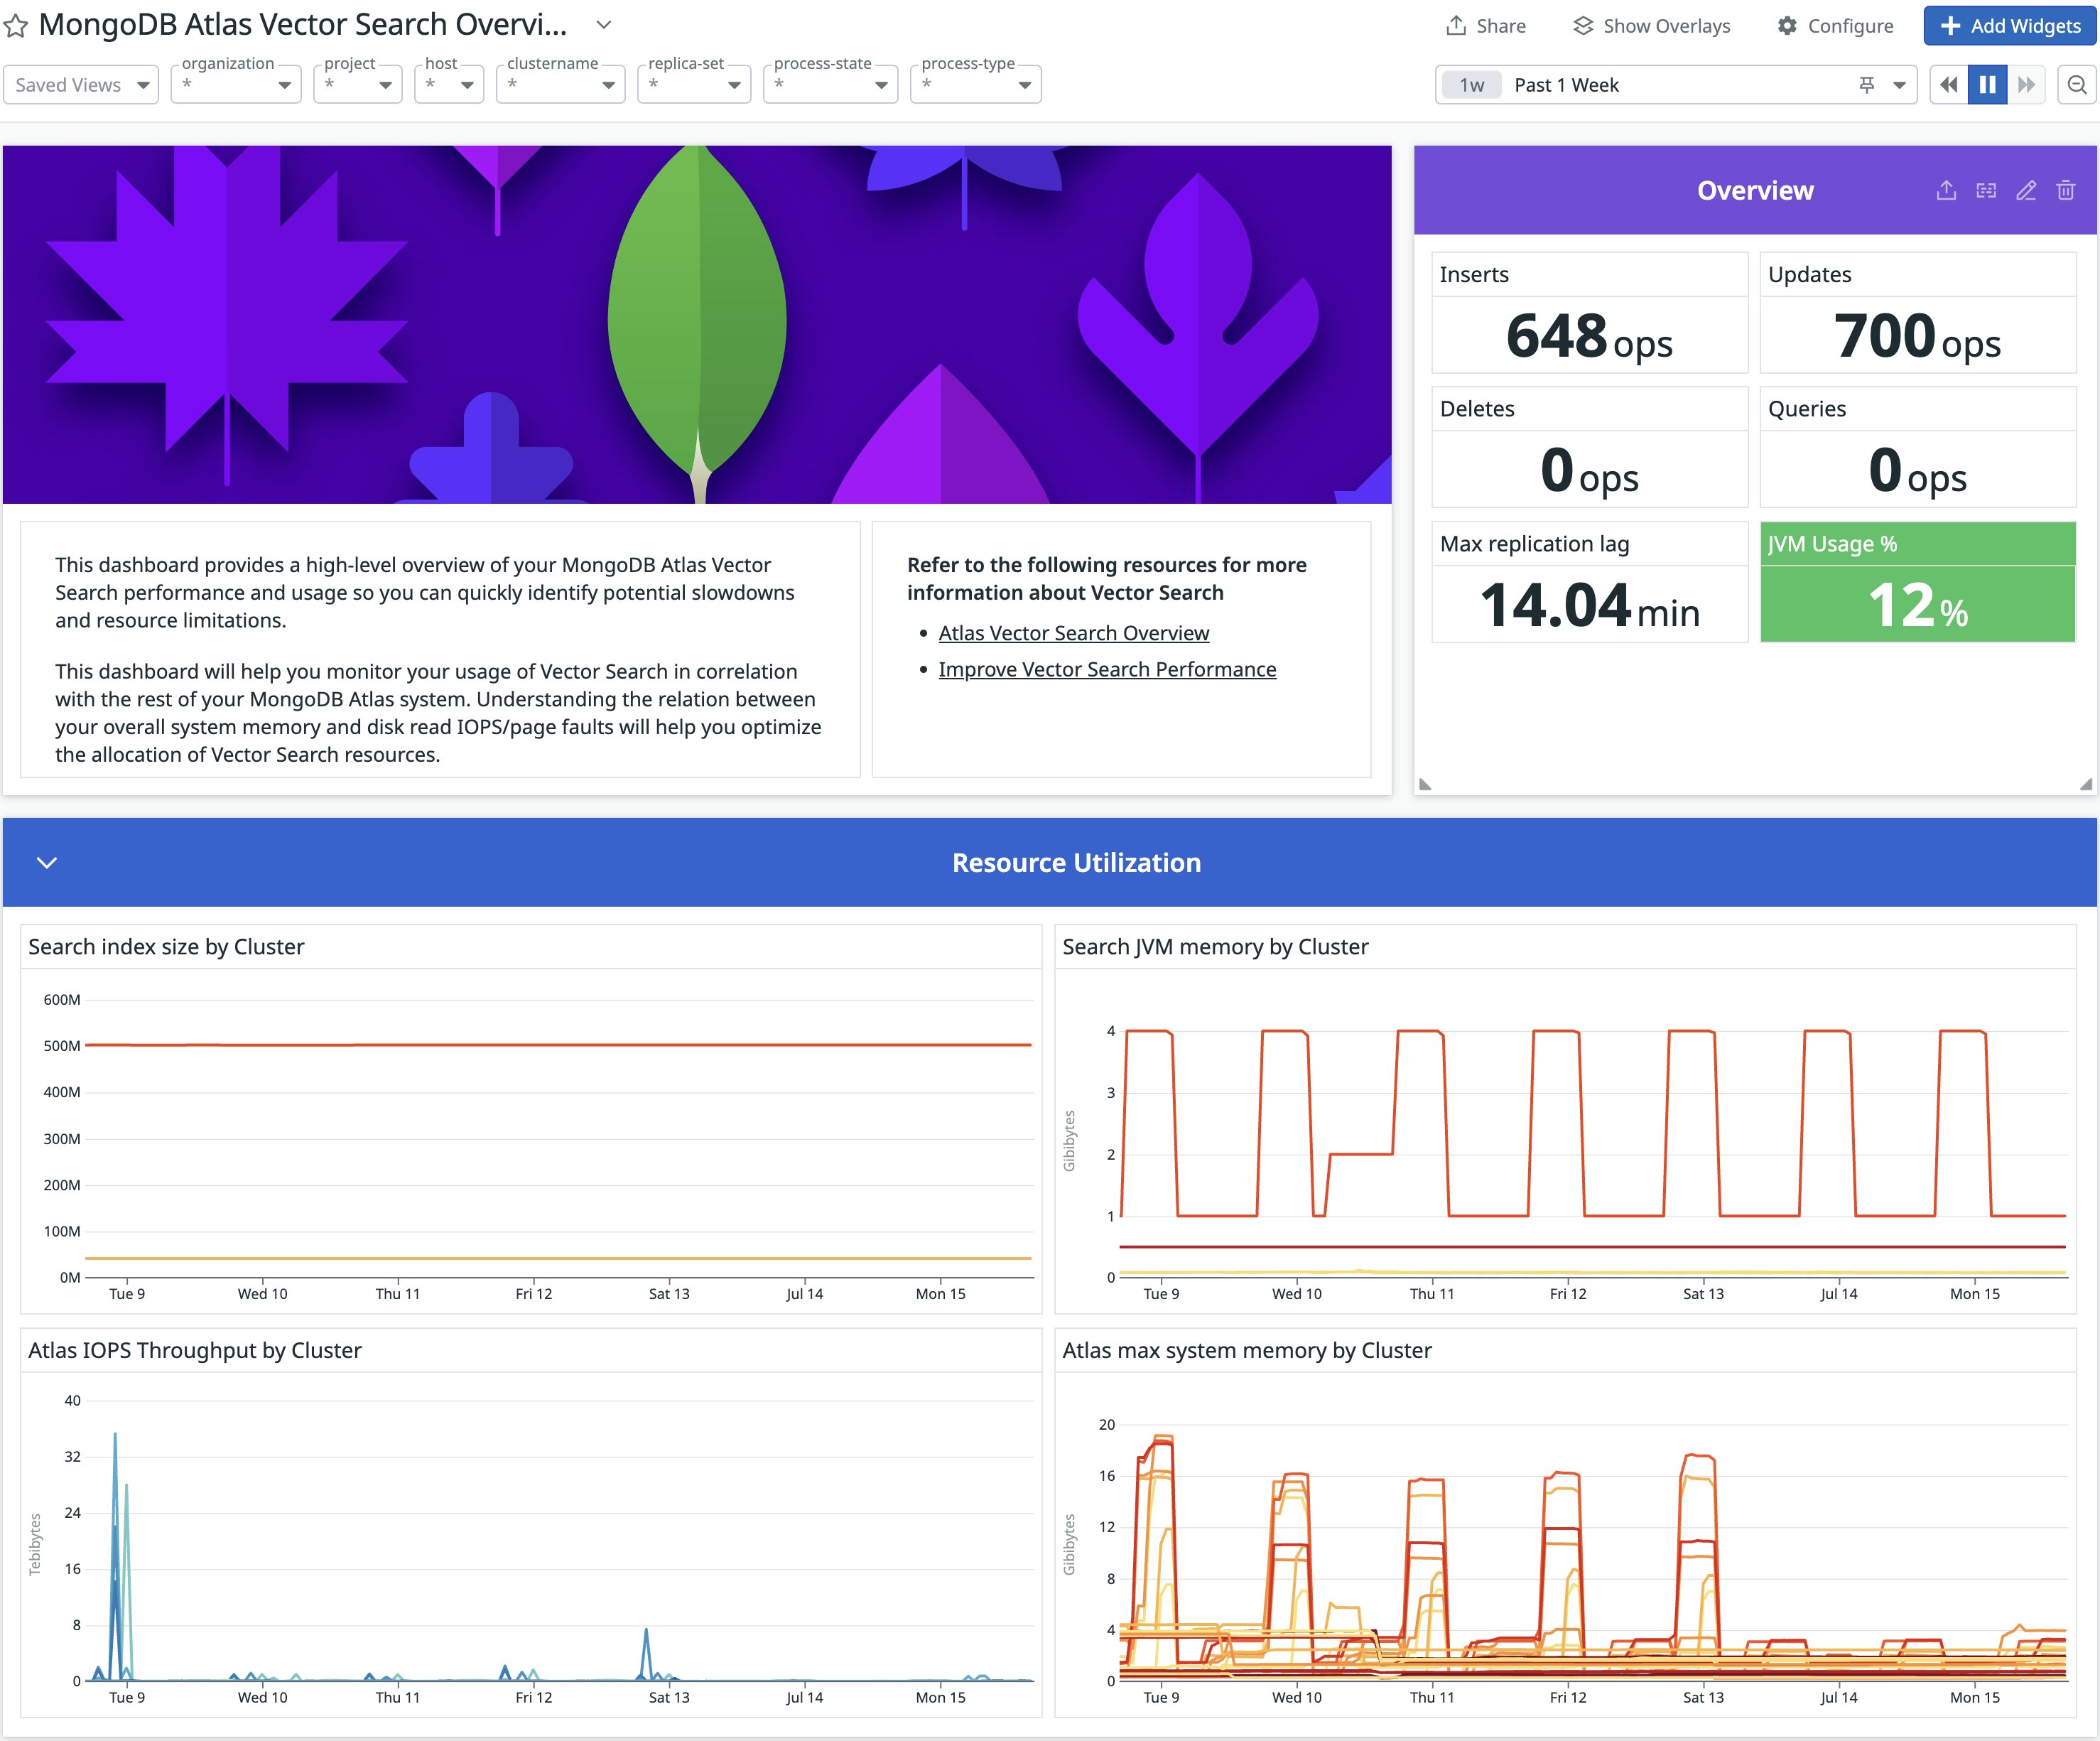
Monitor the Performance of Atlas Vector Search
Vector search is a method of information retrieval where queries are represented as vectors, allowing AI solutions to extract contextual data in a scalable way. Using Atlas as a vector database lets you build natural language processing (NLP), machine learning (ML), and GenAI applications. You can implement Retrieval-Augmented-Generation (RAG) by storing data in Atlas and using Atlas Vector Search as a method of retrieval. Our Atlas integration includes search metrics and out-of-the-box dashboards and monitors that allow you to optimize your system memory allocation and view important performance metrics, such as search index size and disk reads. You can confidently use Atlas Vector search with embedding models from AI providers such AWS, OpenAI, and Google while leveraging our integration for improving performance.
Learn more about how MongoDB Atlas fits into monitoring the larger AI tech stack in our AI integration round up blog.
Monitor Atlas with the rest of your stack
We’re pleased to include Atlas among the 1,000+ technologies we support. Datadog collects dozens of MongoDB Atlas metrics and includes full support for AWS, Azure, and GCP services. Whichever cloud platform you use, Datadog gives you an in-depth view of all the technologies in your stack, enabling you to correlate MongoDB Atlas metrics with performance data from the applications that depend on it.
If you aren’t already using Datadog, get started with a 14-day free trial.


