

Sydney McLaughlin
Software Engineer

Cody Murray-Bruce
PMM

Eddie Cai
Technical Content Writer
Apigee X is Google Cloud’s API management platform. Software and platform teams use it to secure, publish, and govern the APIs that internal services, partners, and external developers depend on. Apigee X sits in the request path for that traffic, so a latency spike or a rise in policy errors reaches API consumers before most other signals do. Watching proxy traffic, latency, and security posture usually means jumping between Apigee analytics and separate infrastructure tools. Even after teams spot a problem, moving from the first symptom to the root cause means stitching those tools together by hand.
Datadog’s Google Cloud Apigee X integration collects Apigee X metrics under the gcp.apigee.* namespace through Google Cloud Monitoring. The integration turns on automatically once you configure the Google Cloud integration, with no separate agent or setup required. Metrics cover proxy request and response counts, end-to-end (E2E) and backend latency, environment-level traffic and anomalies, and Advanced API Security scores. Because these metrics land alongside your GKE, Cloud Run, and Cloud SQL telemetry, you can track API health across your Google Cloud stack from one place.
In this post, we’ll show you how to:
Detect anomalies and security threats across your environments
Correlate Apigee X with logs, traces, and the rest of your Google Cloud stack
Track proxy traffic and latency across your APIs
Investigations into API health often start at the proxy. You need to know how much traffic each proxy handles, whether that traffic completes, and how long it takes to return a response.
Measure traffic volume and completion
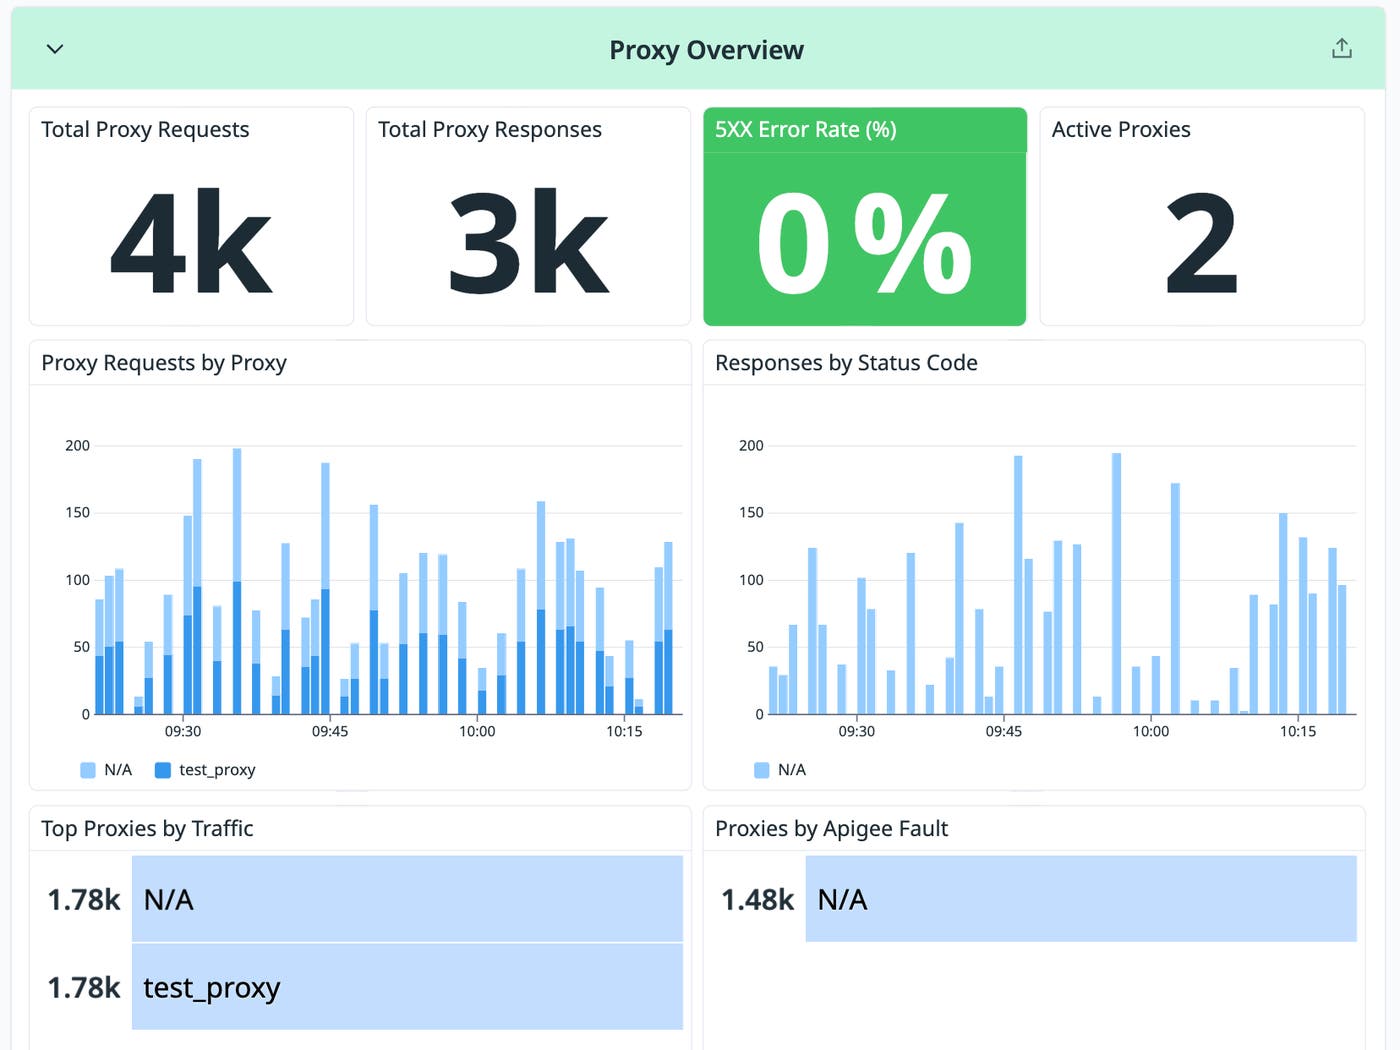
Completion can be an early sign that clients are hitting errors, often before a support ticket arrives. The gcp.apigee.proxy.request_count shows inbound volume per proxy, and gcp.apigee.proxy.response_count metric shows how many of those requests return a response. A widening gap between the two points can indicate dropped connections, timeouts, or errors inside a policy step. If response count falls while request count holds steady, it usually indicates an issue with the proxy rather than the client sending traffic.
Separate proxy overhead from backend latency
When an API slows down, the first question is whether Apigee X or the backend is responsible, because the answer can determine who should fix it. The gcp.apigee.proxy.latencies metric measures E2E latency from the moment Apigee X receives a request to the moment it sends the response, which makes it the right signal for tracking service level objectives. Pair it with gcp.apigee.target.latencies, which isolates the time spent in your backend service. If proxy latency climbs while target latency stays flat, the delay lives in the proxy policy layer, such as spike arrest or authentication. If both rise together, the backend service may be the culprit.
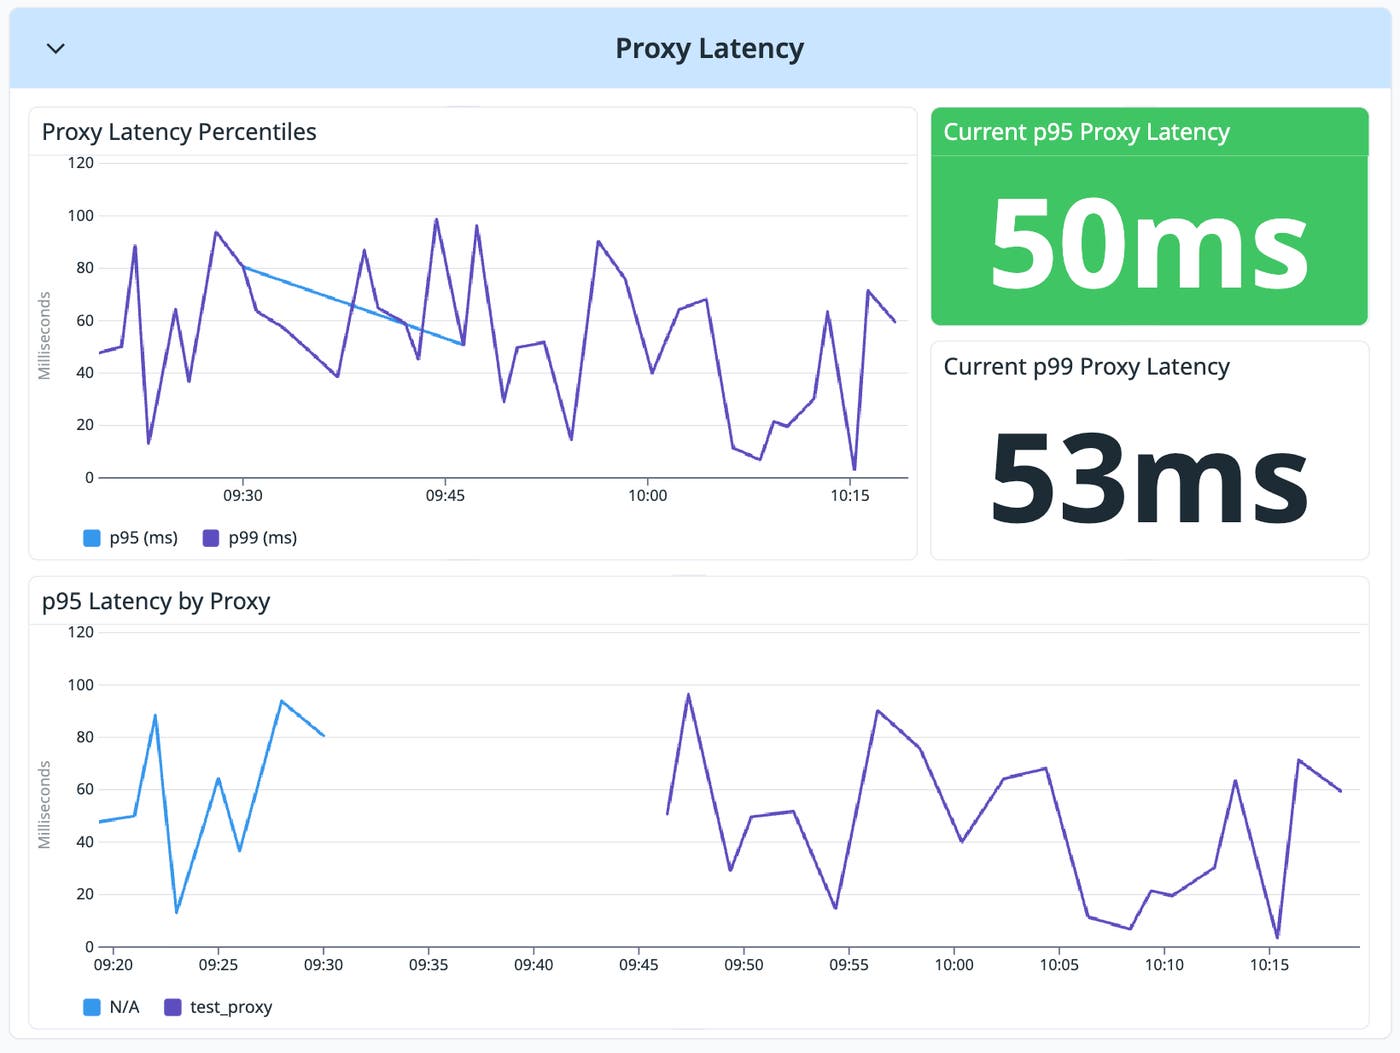
Let’s say your checkout-api proxy holds steady at 4,000 requests per minute, but response count drops to 3,600. The gap tells you that about 10% of requests are failing inside Apigee X.
You check the two latency metrics and see proxy latency climbing while target latency stays flat. A policy step such as authentication is the likely cause, not your backend.
Detect anomalies and security threats across your environments
Per-proxy metrics catch the problems you already watch for. Sudden shifts across an entire environment often show up first at a higher level, and some of those shifts are attacks.
Spot unusual traffic at the environment level
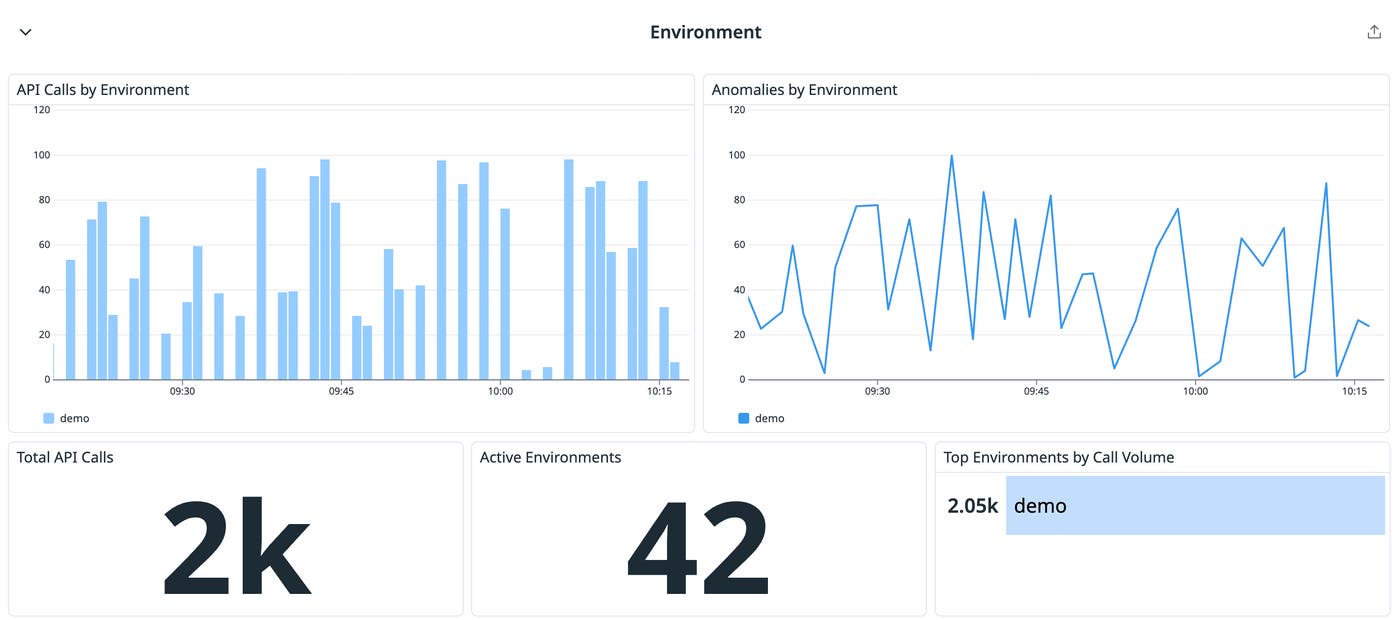
A single failing proxy is a localized fix. The same errors across a whole environment usually point to a shared cause such as a bad deploy or a failing dependency. The gcp.apigee.environment.api_call_count metric tracks total call volume for an environment such as prod or eval, giving you a single trend line for everything running in it. Paired with gcp.apigee.environment_anomaly_count, which surfaces Apigee’s own anomaly detection, it helps you spot spikes or behavior changes at the environment level. A jump in anomaly count while call volume stays steady is a signal to check per-proxy metrics for the one behaving unexpectedly, even though overall traffic looks normal. When call volume and anomaly count rise together, you are more likely seeing real traffic growth that your quotas and backend need to absorb.
Tell a benign spike apart from an attack
Misreading the difference between a benign spike and an attack is costly. Adding capacity for what is really an attack leaves you exposed while you scale. The gcp.apigee.security.score metric reports the Advanced API Security posture score for your APIs, and gcp.apigee.security.incident_request_count counts requests tied to detected security incidents. A latency regression paired with a rise in incident request count may point to a security event rather than a capacity problem. Tracking the security score over time also shows whether recent policy changes improve or weaken your API defenses.
Let’s say anomaly count spikes for your partner-api environment while total call volume looks normal. You open the security metrics and find the incident request count rising at the same time. The pattern may point to a credential-stuffing attempt against one proxy rather than a real traffic surge. You investigate further and route the alert to your security team instead of scaling capacity.
Build dashboards and monitors on Apigee X metrics
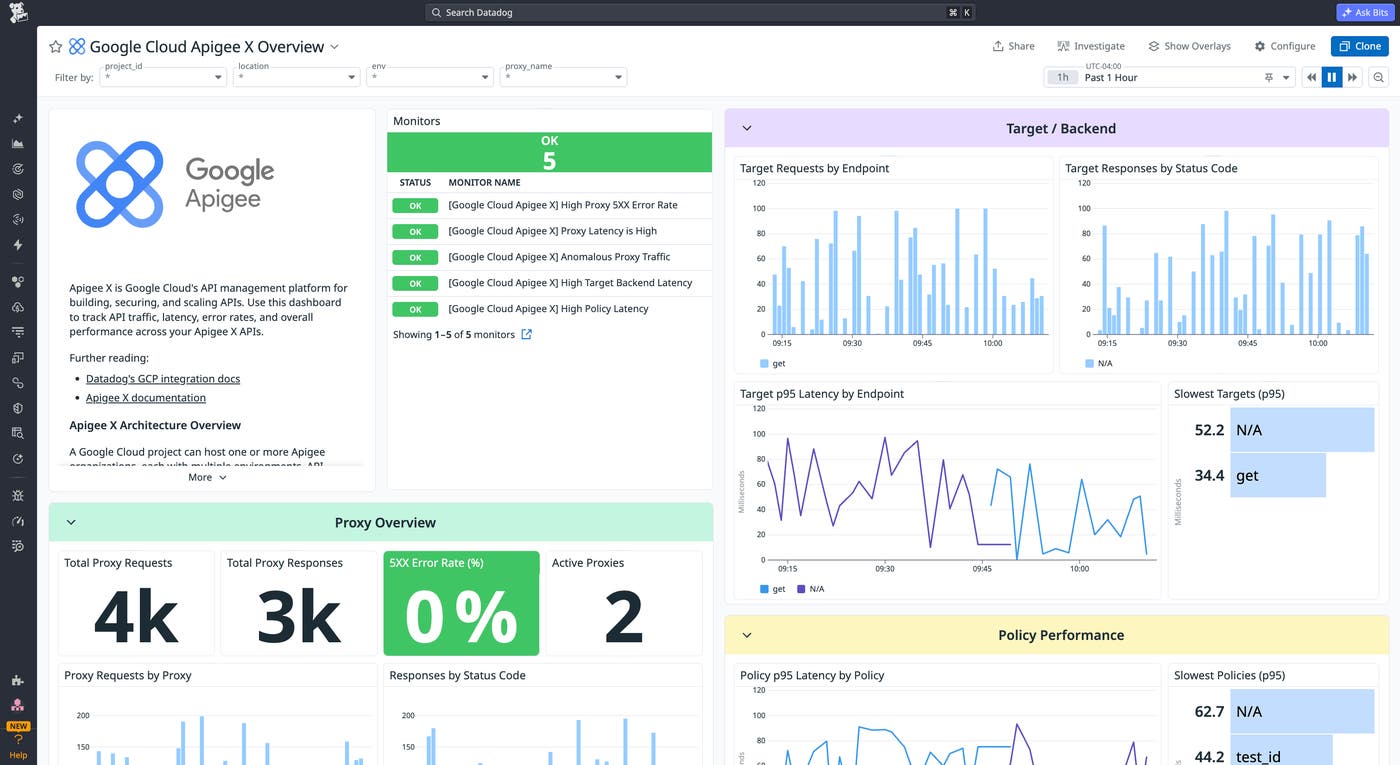
A dashboard brings these metrics into a single view, and a monitor alerts you to a regression before a client reports it. Create a dashboard that shows request and response counts, proxy and target latency, and security score side by side for each environment.
Set metric monitors on the signals that map to your service level objectives, such as a threshold on proxy latency or a change alert on the request-to-response gap. Route each monitor to the team that owns the affected proxy so the right responder sees the alert first. As you add proxies and environments, the same dashboards and monitors extend to cover them without new instrumentation.
Let’s say you set a monitor that fires when proxy latency for payments-api crosses 800 ms over five minutes. The monitor routes to the payments team, who open the environment dashboard and see the latency rise line up with a request-count spike on a single proxy. They scale the backend before clients start reporting errors.
Correlate Apigee X with logs, traces, and the rest of your Google Cloud stack
Metrics tell you that latency rose. Logs and traces can tell you why. Traces are not included in the metrics integration, so you instrument the client yourself with the OpenTelemetry SDK. Apigee X supports B3 trace context propagation, so you can configure the B3 propagator and an OpenTelemetry Protocol (OTLP) export in the client. You can configure the exporter to send spans to the Datadog Agent, which ships them to Datadog Application Performance Monitoring. From there, you can follow a single request from the caller through the proxy to the backend.
Proxy logs also sit outside the metrics integration and need their own setup. You can also forward Apigee proxy logs to Datadog Log Management with the Apigee logging guide, using either a JavaScript policy or the MessageLogging policy. Let’s say a latency monitor fires for your orders-api proxy. You open the environment dashboard, pivot to the traces for that proxy, and find that one backend call to Cloud SQL accounts for most of the delay. You then read the proxy logs for the failing requests and confirm they share a single malformed query parameter.
Get started with Apigee X monitoring
Monitoring Apigee X with Datadog turns a scattered investigation into a single workflow, from a symptom in proxy traffic to a root cause in logs and traces. Because the metrics arrive automatically through the Google Cloud integration and sit alongside your wider Google Cloud telemetry data, you can detect degradations and investigate potential security threats sooner. As your API program grows, the same dashboards and monitors scale with new proxies and environments without extra instrumentation.
For setup details, see the Google Cloud Apigee X integration documentation. If you’re not already a Datadog customer, sign up for a free 14-day trial.
