As your application grows in size and complexity, it becomes increasingly difficult to manage the number of logs it generates and the cost of ingesting, processing, and analyzing them. Organizations often have little control over fluctuations in the volume of logs generated—and the resulting costs of collecting them—so they are forced to limit the number of logs generated by their applications, or to pre-filter logs before sending them to their log management platform. Teams create gaps in log coverage when they have to choose which logs to keep or throw away, making it impossible to react quickly to changes in their logs.
Stream all of your logs, keep only what you need
Datadog’s approach to log management, which we call Logging without Limits™, enables you to send all your logs to Datadog simply and cost-effectively. You can observe a real-time stream of all of your processed logs, and decide on the fly which logs are valuable enough to retain in Datadog for further analysis. All your logs, whether you retain them in Datadog or not, can be archived in your own cloud storage to maintain a complete history of your operations for any technical, security, or business audit.
We are excited to announce two additions to Datadog’s Logging without Limits™ feature set, which provide even more flexibility in how you monitor and analyze your log data:
- Metrics from Logs: generate metrics from all of your logs
- Log Rehydration™: easily reload logs from your archives for analysis
Generate metrics from logs
Data sources such as servers, containers, and cloud services all generate a high volume of logs. Those raw logs often don’t provide a lot of value individually. For example, a typical web access log usually won’t give you any insight into the health of your web server. But, in aggregate, access logs are high-value because they show trends in key indicators like request latency and server status.
With Datadog, you can now build aggregated views of your log data by creating metrics from any of your ingested logs, regardless of the source platform, language, or tool. Instead of retaining and sifting through a large number of logs, you can create a single metric to track the trends those logs reflect. Datadog retains that metric at full granularity for 15 months.
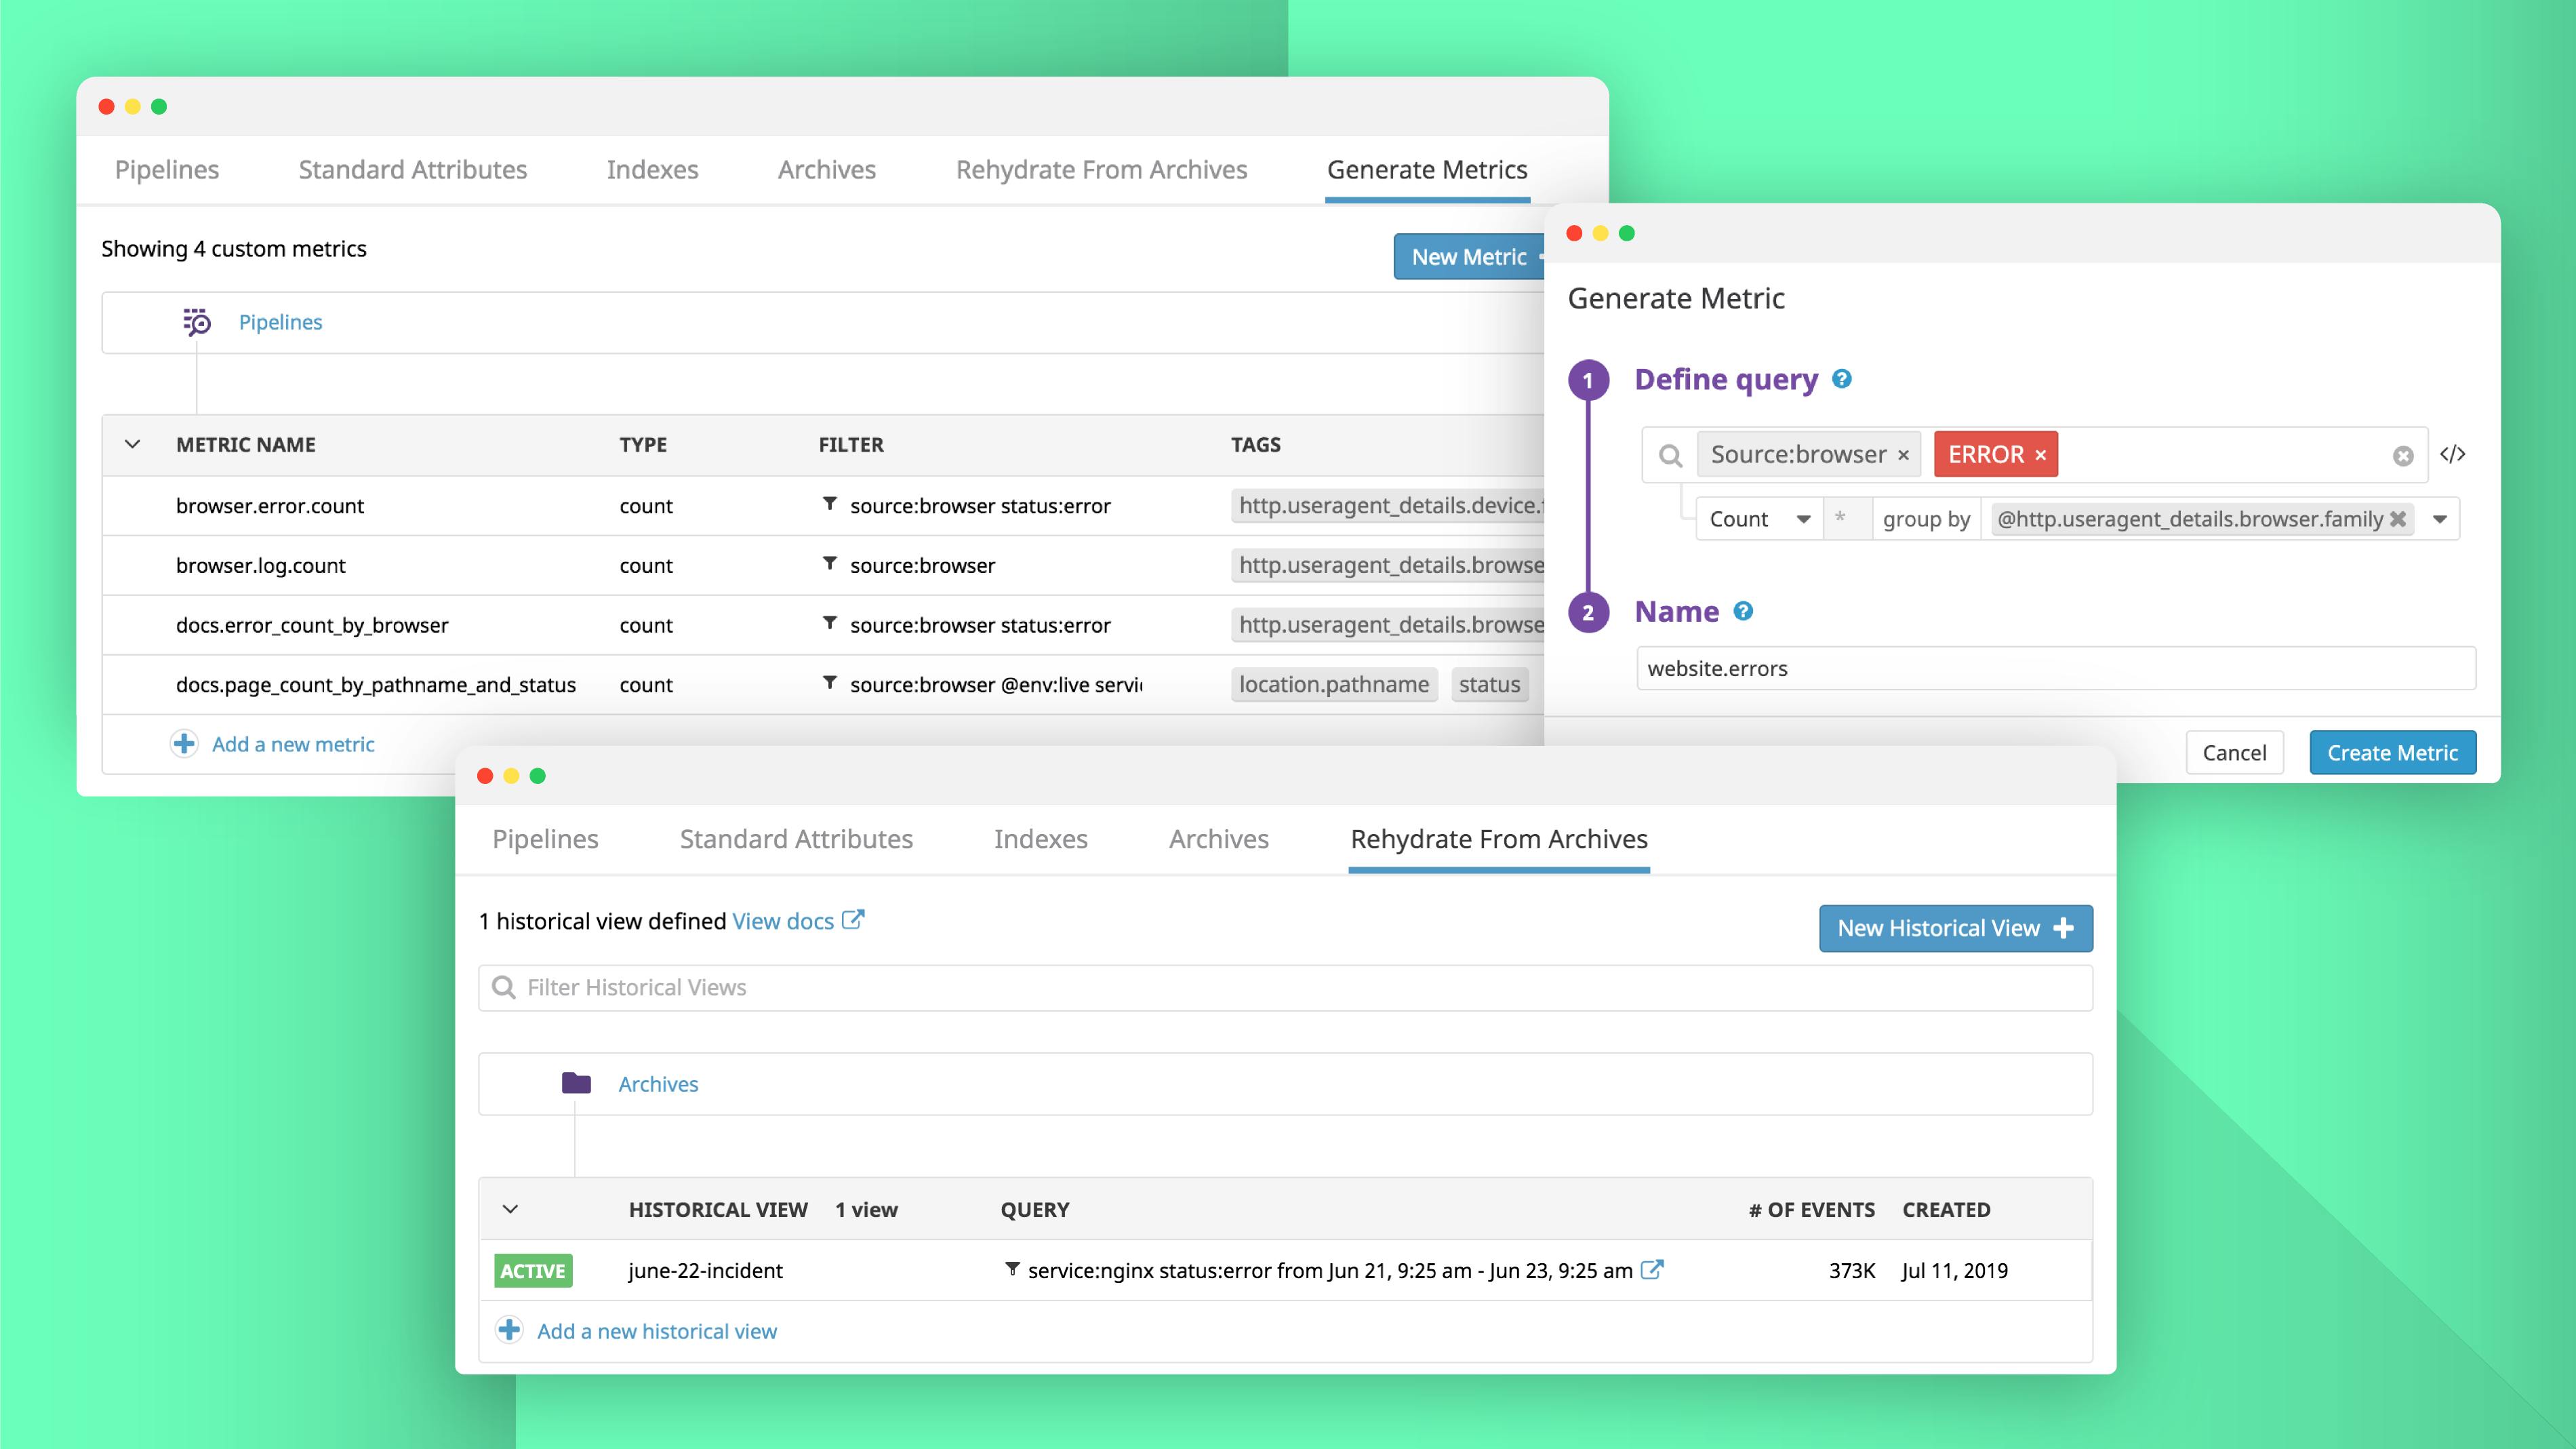
To create a new metric, navigate to the “Generate Metrics” tab on the Log Configuration page of your account. Filter the log data using any attribute or tag group that exists in your processed logs, then group by any dimension such as host, availability zone, or service.
Once you name and save your metric, you will quickly be able to view it in Datadog dashboards and graphs, and set up sophisticated alerts to detect abnormal trends. For example, you can use the user agent data in your web access logs to create a metric that captures browser usage trends for your application. You can also apply analytics such as forecasts and anomaly detection to your generated metrics.
Creating metrics from logs reduces the costs of indexing and retaining your logs, so you can automatically archive the underlying logs in cloud storage such as Amazon S3 or Azure blobs. And, if you notice abnormal activity in a metric, you can seamlessly reload related logs from an archive for further troubleshooting.
Reload logs from your archives
Datadog’s Log Rehydration™ enables you to not only archive all of your logs in your cloud storage solution of choice, but also retrieve a subset of logs from an archive on demand. You can quickly access archived data at any time for investigating incidents or conducting technical, security, or business audits.
To reload logs from an archive, navigate to the Logs Configuration page in your account and click on the “Reload from Archives” tab. Click on the “New Historical View” button, select the archive and time period for the logs you need to access, and query the logs using free-text search or attributes such as service, source, or status.
Datadog will automatically retrieve your logs based on the criteria you set for the historical view and display them in the Log Explorer so you can quickly view log details or pivot from a log to related traces, just as you would with new logs.
The ability to rehydrate your logs supports better retention practices, further reducing costs. For example, you can reduce the number of logs you index and retain, or decrease retention periods for your indexed logs, because you can always seamlessly retrieve all the logs you need from an archive.
No limits to logging
Log Rehydration™ and Metrics from Logs are now generally available. Together with the rest of the Logging without Limits™ feature set, these new features provide you a cost-effective way for capturing all of your log data and dynamically retaining the logs that you deem most important. If you are already using Datadog, you can learn more about Logging without Limits™ in our documentation. Or you can sign up for a free 14-day trial to start monitoring your logs, metrics, and traces today.


