
Renaud Boutet
Sifting through all your logs to find what you need can be challenging—especially during an outage, when time is critical and you're flooded with WARN and ERROR messages. To help you immediately surface useful information from large volumes of logs, we developed Log Patterns. This new view automatically analyzes your logs in real time and groups them into clusters based on common patterns, so that you can easily interpret your logs, identify unusual occurrences, and use those findings to steer and accelerate your investigation.
Understand the scope of the issue
Investigating an issue can feel like looking for a needle in a haystack—and you may not even know what the needle looks like until you see it. The Log Patterns view helps surface everything that's in the haystack, so you can quickly recognize the most interesting patterns without crafting the perfect search query. In the Log Explorer, simply filter for the logs you are interested in (based on service name, status, or other attribute), and click the Patterns button to instantly collapse the full list of logs into groups based on the logs' origin and contents.
For each log grouping, you can immediately see which snippets of a log message are common to all members of the group (displayed in plain text), as well as which snippets vary across the members of the group (highlighted). The clustering algorithm also recognizes common types of log fields, such a timestamps and IP addresses, and replaces them with highlighted characters (such as 192.168.0.XXX to represent a range of IP addresses).

In the example above, thousands of Kafka error logs have been grouped into a single cluster, because they share a common format. The shared pattern reveals the scope of the issue right away: although we can see that the error logs involve multiple Kafka consumers and partitions, they all pertain to a single Kafka topic (topic_cell2). Meanwhile, the affected partitions and their offsets are highlighted, and are represented as a numerical range to make it easier to interpret the range of values included in these logs. Now that we know that this error affects a specific topic in the Kafka cluster, we can use that information to steer our investigation in the right direction.
Unify your logs, metrics, and distributed traces with Datadog log management.
Drilling down into Log Patterns
The Log Patterns view can help you quickly see the big picture when you're flooded with verbose application logs, but it also allows you to swiftly drill down to get more details. You can click on any cluster to see individual log entries that exhibit that pattern.
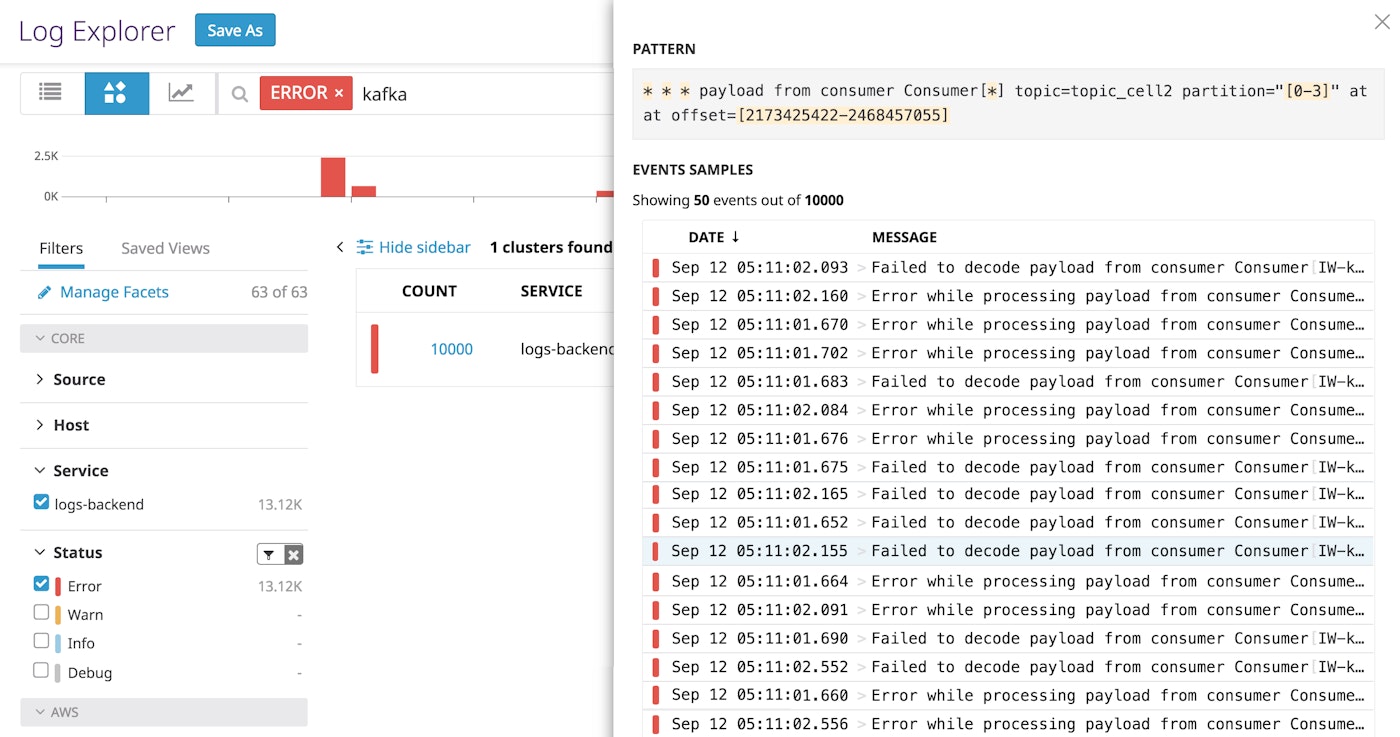
The Log Patterns view can serve as a jumping-off point for an investigation or open-ended exploration. Upon inspecting the log group above, you can click on any log entry to see more details about that specific error message and the host or service that generated it. You can then gather more information from correlated logs by clicking "View in Context."
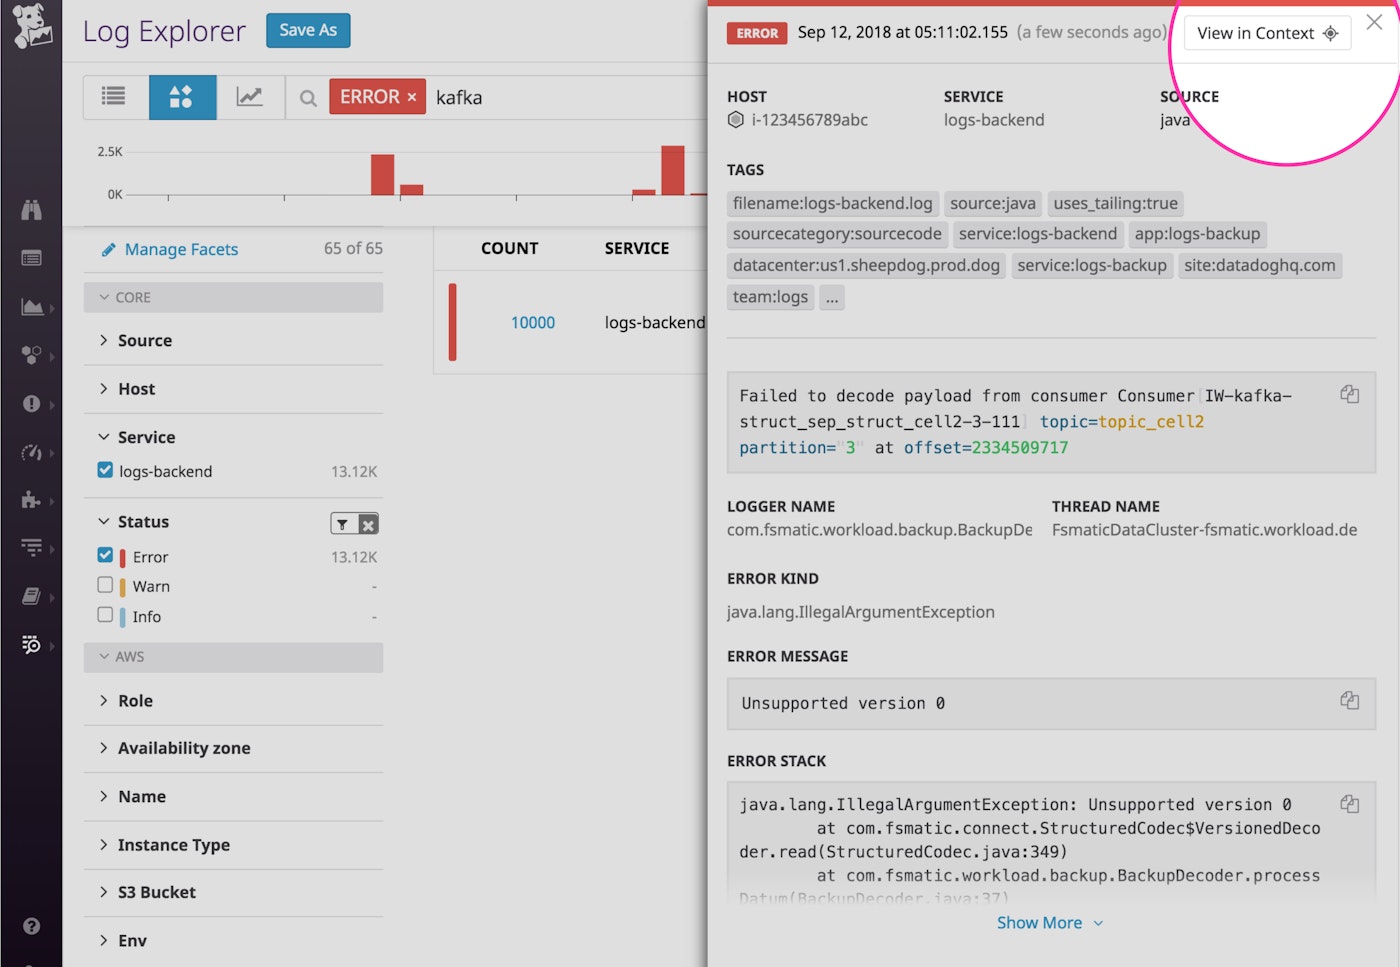
Clicking on this button brings you to a Log Explorer view that displays all of the logs collected from the same host and service around that time frame. You will also see the original log highlighted for easy reference.
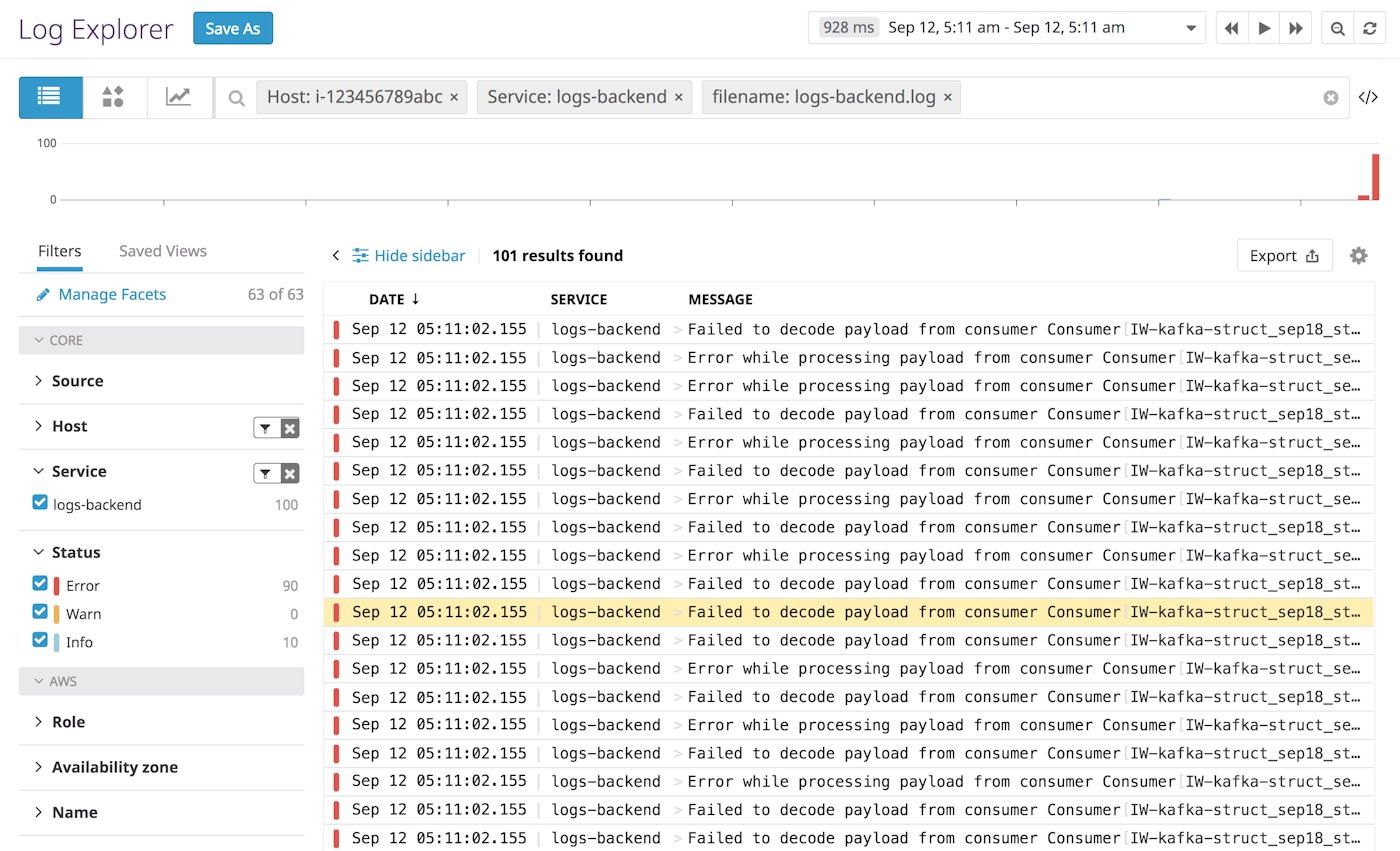
For even more context around an issue, you can pivot directly from your logs to other related sources of data, like APM and host-level metrics.
Analyze normal and abnormal patterns to get the full picture
The Log Patterns view helps you summarize the current state of your environment, whether your systems are operating normally or are failing. When your Kafka cluster is healthy, this view provides a window into normal operations (e.g., rolling out new log segments and deleting old ones).
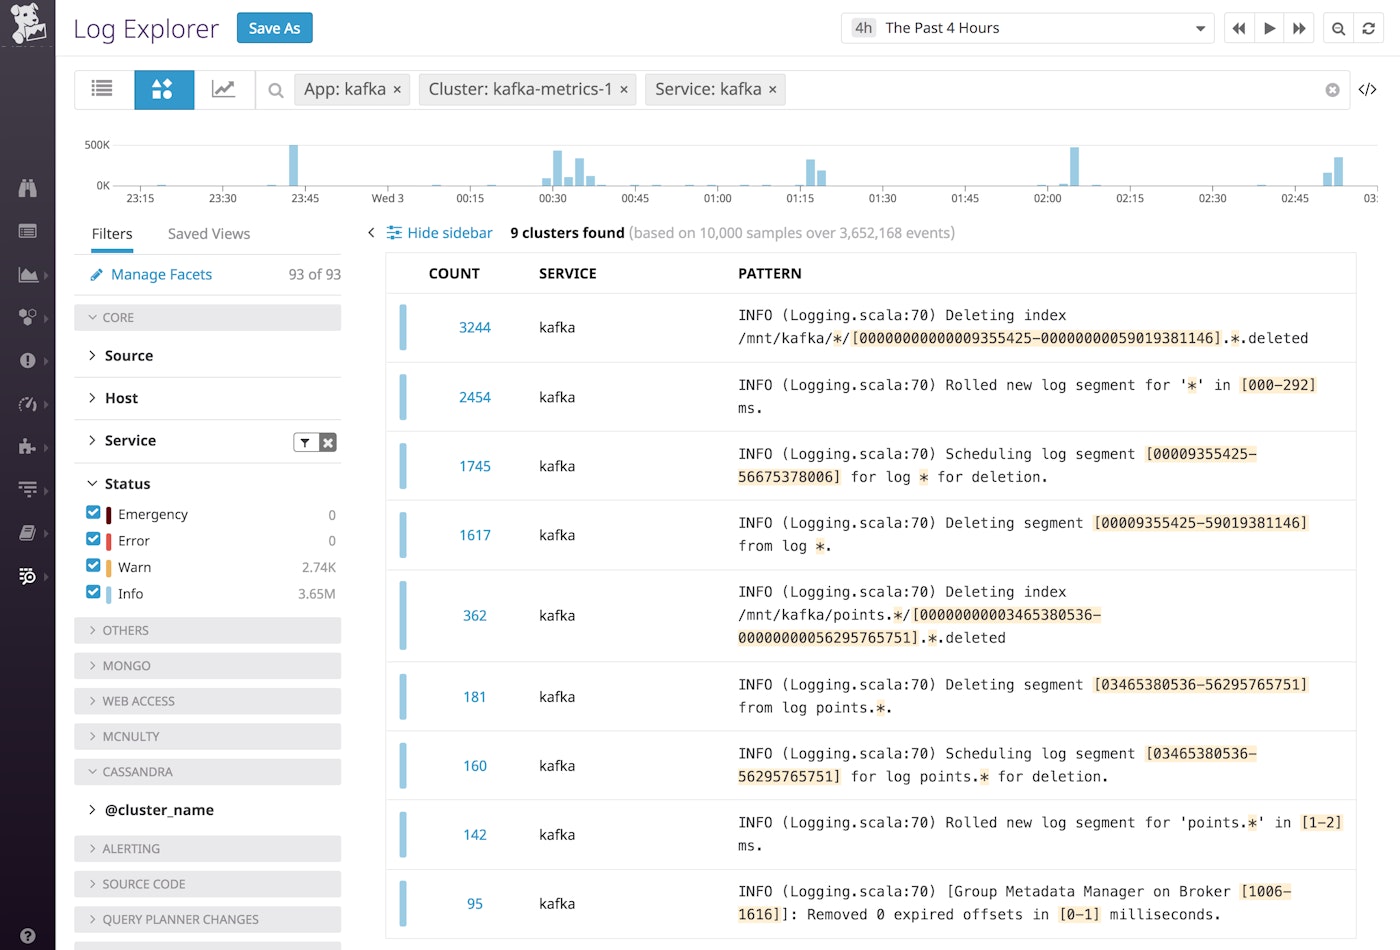
During a cluster-wide issue, as error logs start to pour in, you can use Log Patterns to quickly build an understanding of what has changed. In the example below, we filtered out the INFO logs, and then computed patterns for that subset of logs to reconstruct the causes and effects of the incident.
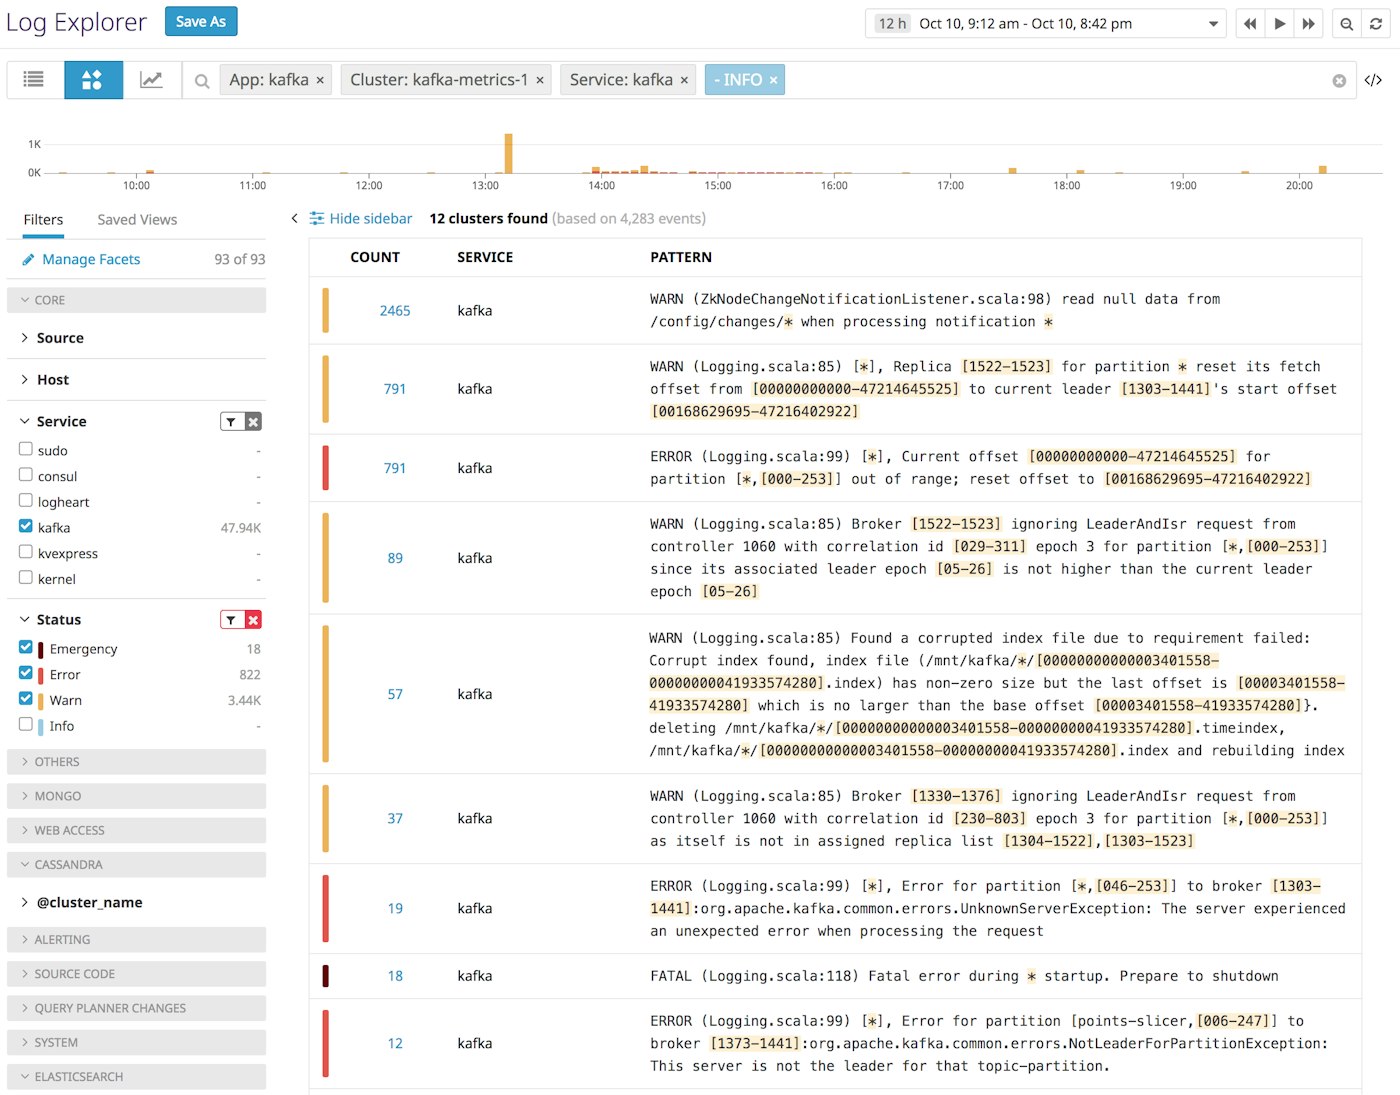
From these patterns, we can see several issues recorded in the logs, and can even form a hypothesis as to which event triggered the cascade. It looks like the Kafka broker experienced a fatal error and restarted multiple times, which triggered a new leader election in the cluster and led to warnings about a corrupted index (another sign that the broker restarted after an unclean or forced shutdown). The producers then ran into errors as they tried to publish messages to the old leader, before the change in leadership was successfully communicated to those producers.
In one screen, the Log Patterns view distills a complex sequence of events across a distributed system and gives us a logical place to start investigating: we'll need to check the state of the broker that experienced the fatal error, and possibly replace it.
Refine your log management setup
Although the Log Patterns view is very useful for surfacing important information in large volumes of logs, you can also use it to identify low-value logs and reduce the number of logs you're indexing and monitoring with Datadog, while still ensuring that you have access to all of the data you need.
Because the clusters are sorted by frequency of occurrence, you can see which services generate the greatest volume of logs. If you determine that any of these high-frequency log patterns are not providing useful insights, you can stop indexing those logs by adding an exclusion filter.
The Log Patterns view also helps you see the structure of commonly generated logs, so you can ensure that your pipelines are properly configured to capture the data you would like to monitor. In the example below, we are inspecting one of the Tornado access log patterns. The highlighted fields (URL path and request processing time) represent data that varies across logs that exhibit this pattern. In order to use these variations to visualize trends over time (e.g., to see if the processing time for requests to any specific URL path has increased or decreased), we would need to parse and process these two fields as attributes.

If you inspect one of these logs in this cluster, you might discover that you are not yet parsing these attributes.

To start capturing information from these logs, you can update your log processing pipeline by adding or modifying parsers. Once these fields are properly parsed and processed into attributes, you will be able use them in dashboards and alerts.
Put Log Patterns to work
If you're already using Datadog to collect, process, and archive all your logs, you can get quicker insights into your systems by exploring the Log Patterns view. Haven't tried Datadog log management? Learn how to get started by navigating to the Logs tab of your account. Or, if you're not using Datadog yet, sign up for a 14-day free trial to see how the Log Patterns view can help you quickly understand your log data and effectively investigate issues.


