Evgeni Wachnowezki

Kassen Qian

David M. Lentz
Bugs that affect your application in production demand immediate attention. Often, that can interrupt your flow and require you to shift to an alternate set of tools and processes to investigate. You might need to explore logs, review dashboards full of performance metrics, and dig into source code to try to pinpoint the root cause. But without seeing the full context of what triggered a bug—such as the lines of code executed and the relevant local variable data—you can only guess at what went wrong. Once you’ve identified the cause of the bug, you need to code a fix and then write an integration test to prevent a regression. Only then can you turn back to your development work to regain momentum on shipping your next feature.
Datadog Live Debugging streamlines the process of fixing production bugs by providing crucial context that helps you quickly home in on the root cause. You can visualize the affected service, its dependencies, and the flow of data between them to identify which interactions contributed to the error. Live Debugging lets you reproduce the bug locally, view the error’s stack trace enriched with relevant local variables, and generate an integration test to prevent a regression—all within your IDE.
In this post, we’ll show you how Live Debugging enables you to:
- See the production context of errors within your IDE
- Jump-start your remediation with an AI-generated summary and root-cause hypothesis
- Reproduce bugs locally and prevent regressions with one-click integration test generation
Use Error Tracking and Exception Replay in your IDE
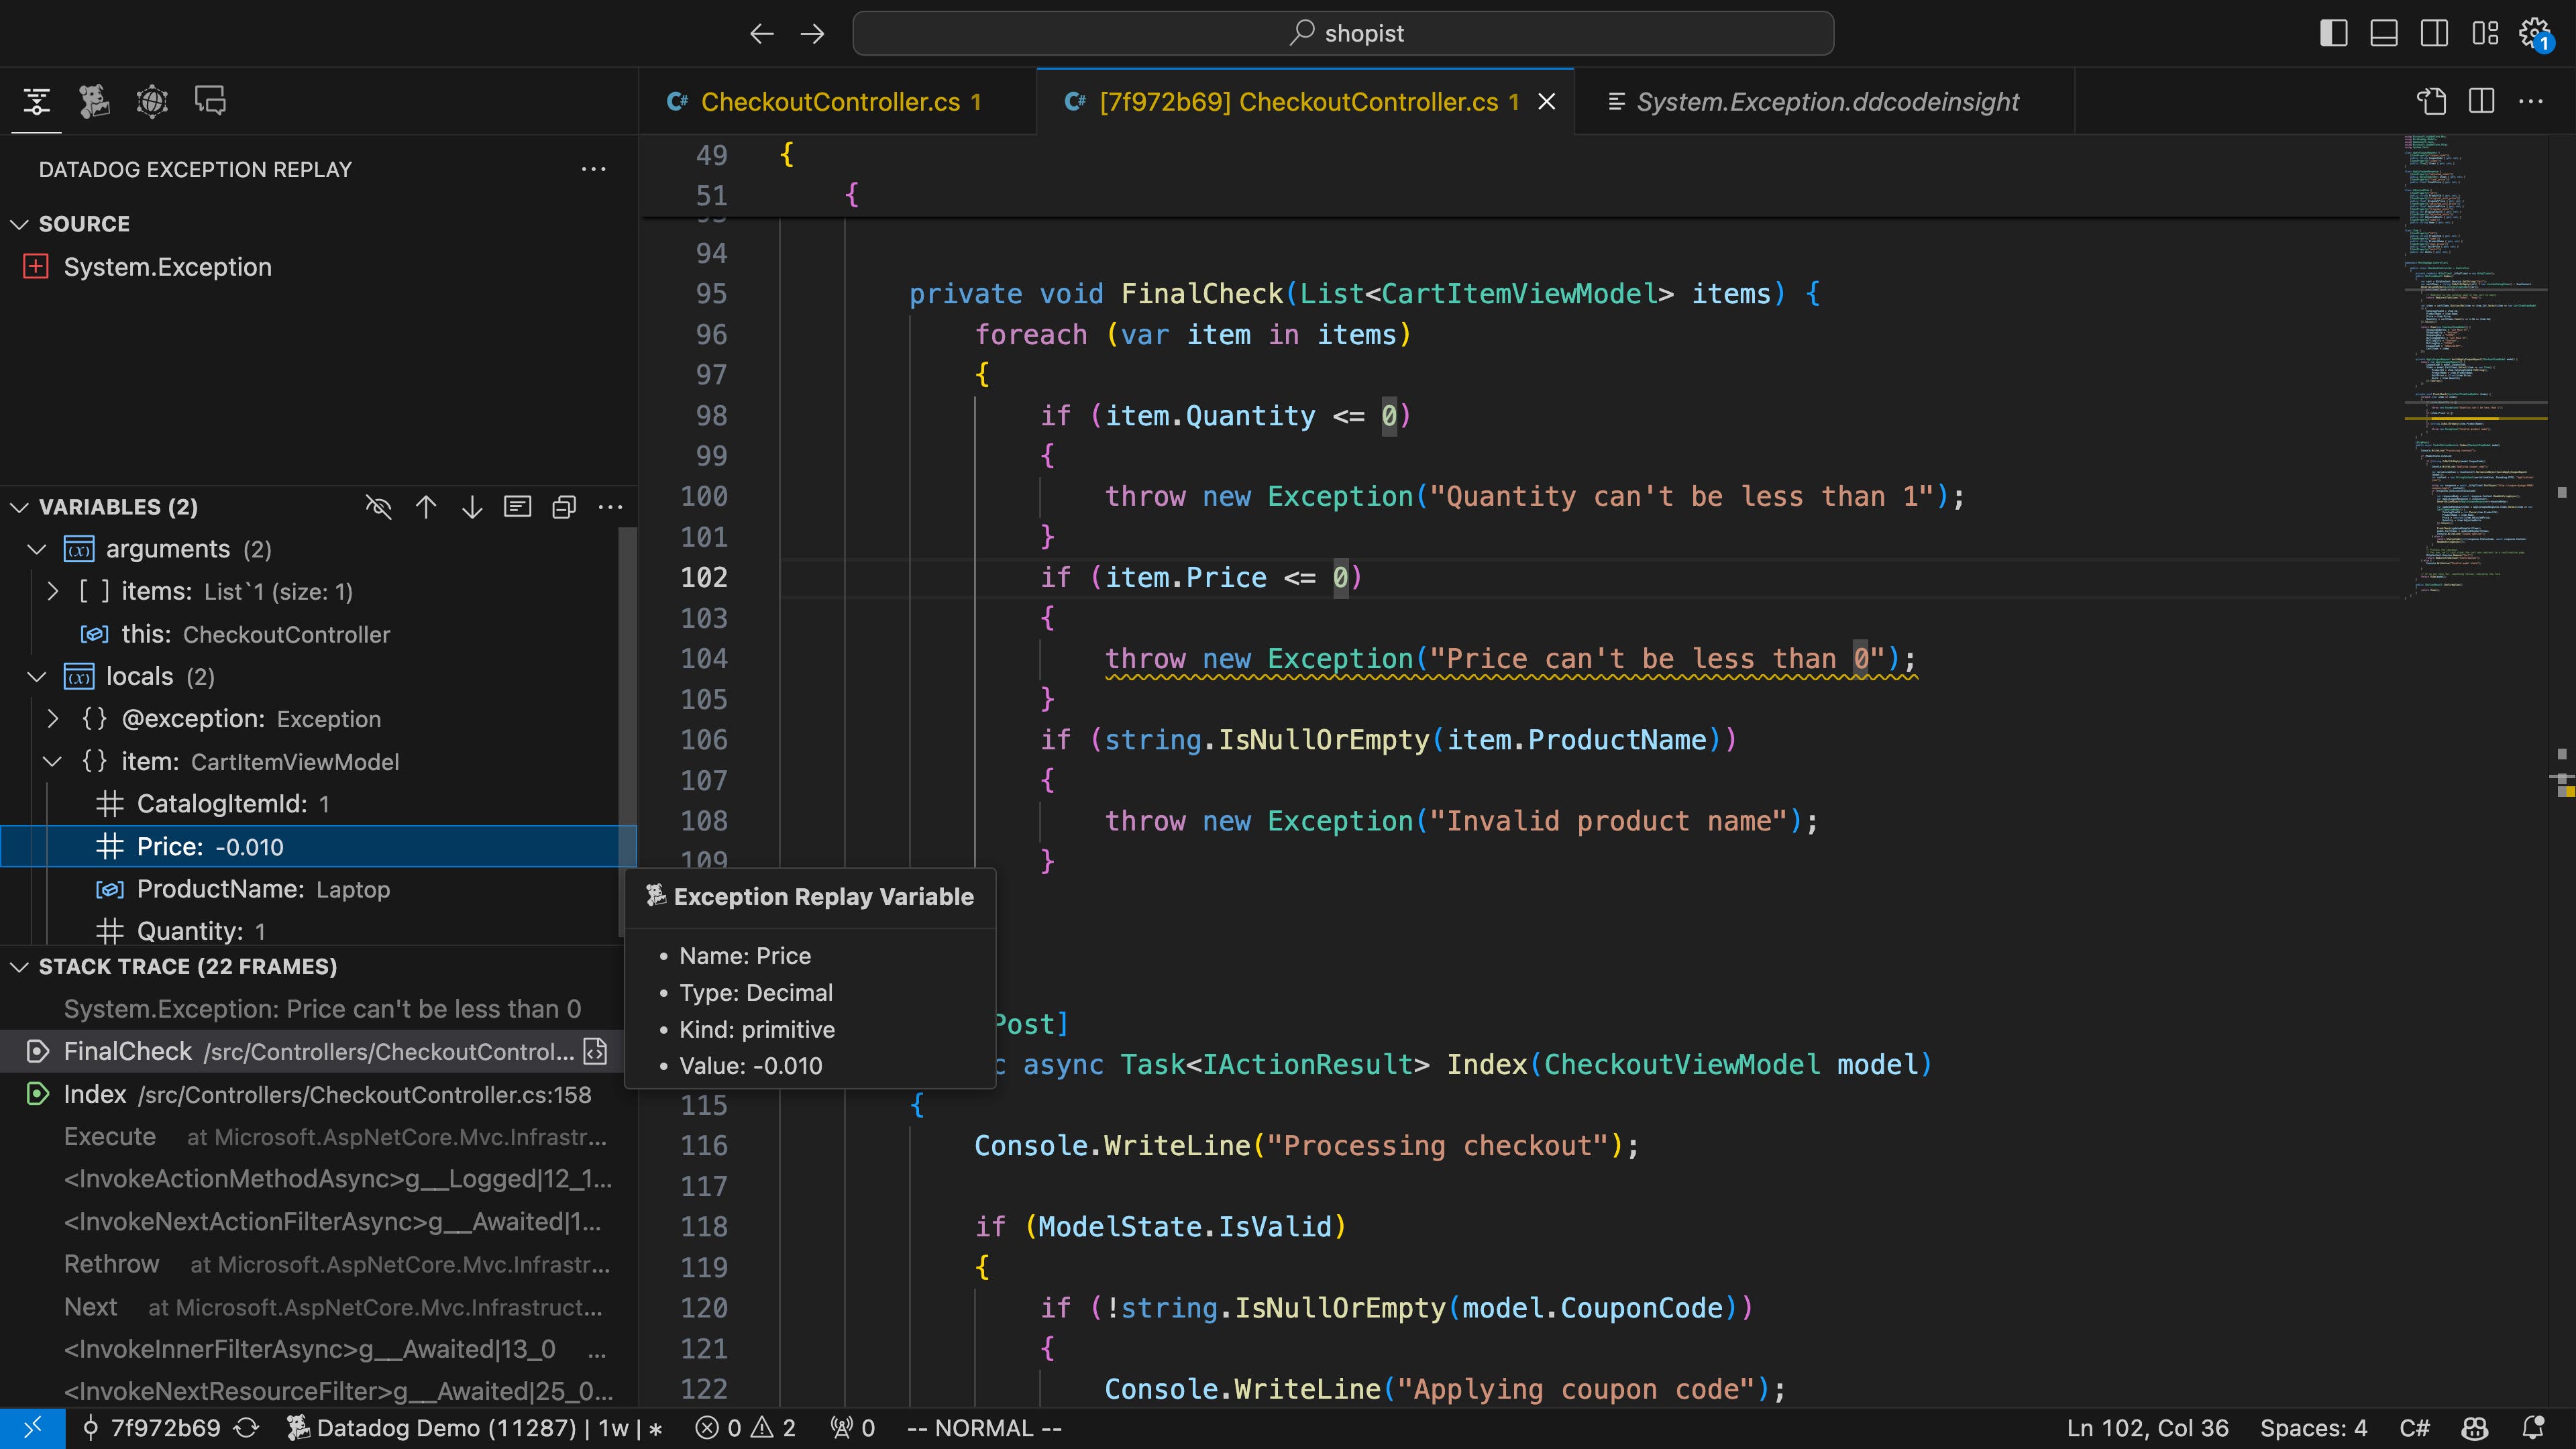
Datadog Error Tracking for APM aggregates related backend errors into issues to minimize noise, increase visibility, and help you understand the impact of the errors. Exception Replay enhances Error Tracking and brings actionable context into your IDE, including the values of local variables for all stack frames at the time an exception was thrown. With Exception Replay in your IDE, you can efficiently troubleshoot production bugs without leaving your usual workflow. You don’t need to attach a debugger to the running process, dig through logs and performance metrics, parse error messages, or search across your codebase to find offending lines of code.
The screenshot below shows Datadog’s VS Code extension displaying a production error’s stack trace enhanced with runtime variable data. The value of the Price variable is less than zero, and the source code shows the corresponding exception the application will throw in this case.
Checking your application’s variables can help you understand its state at the time of an exception, but it may not uncover the source of the problem. To gain a complete understanding of the issue, you need to know which services were involved, how they interacted with the service that threw the exception, and what lines of code were executed leading up to the error.
Explore errors from context to code with the Datadog Debugger
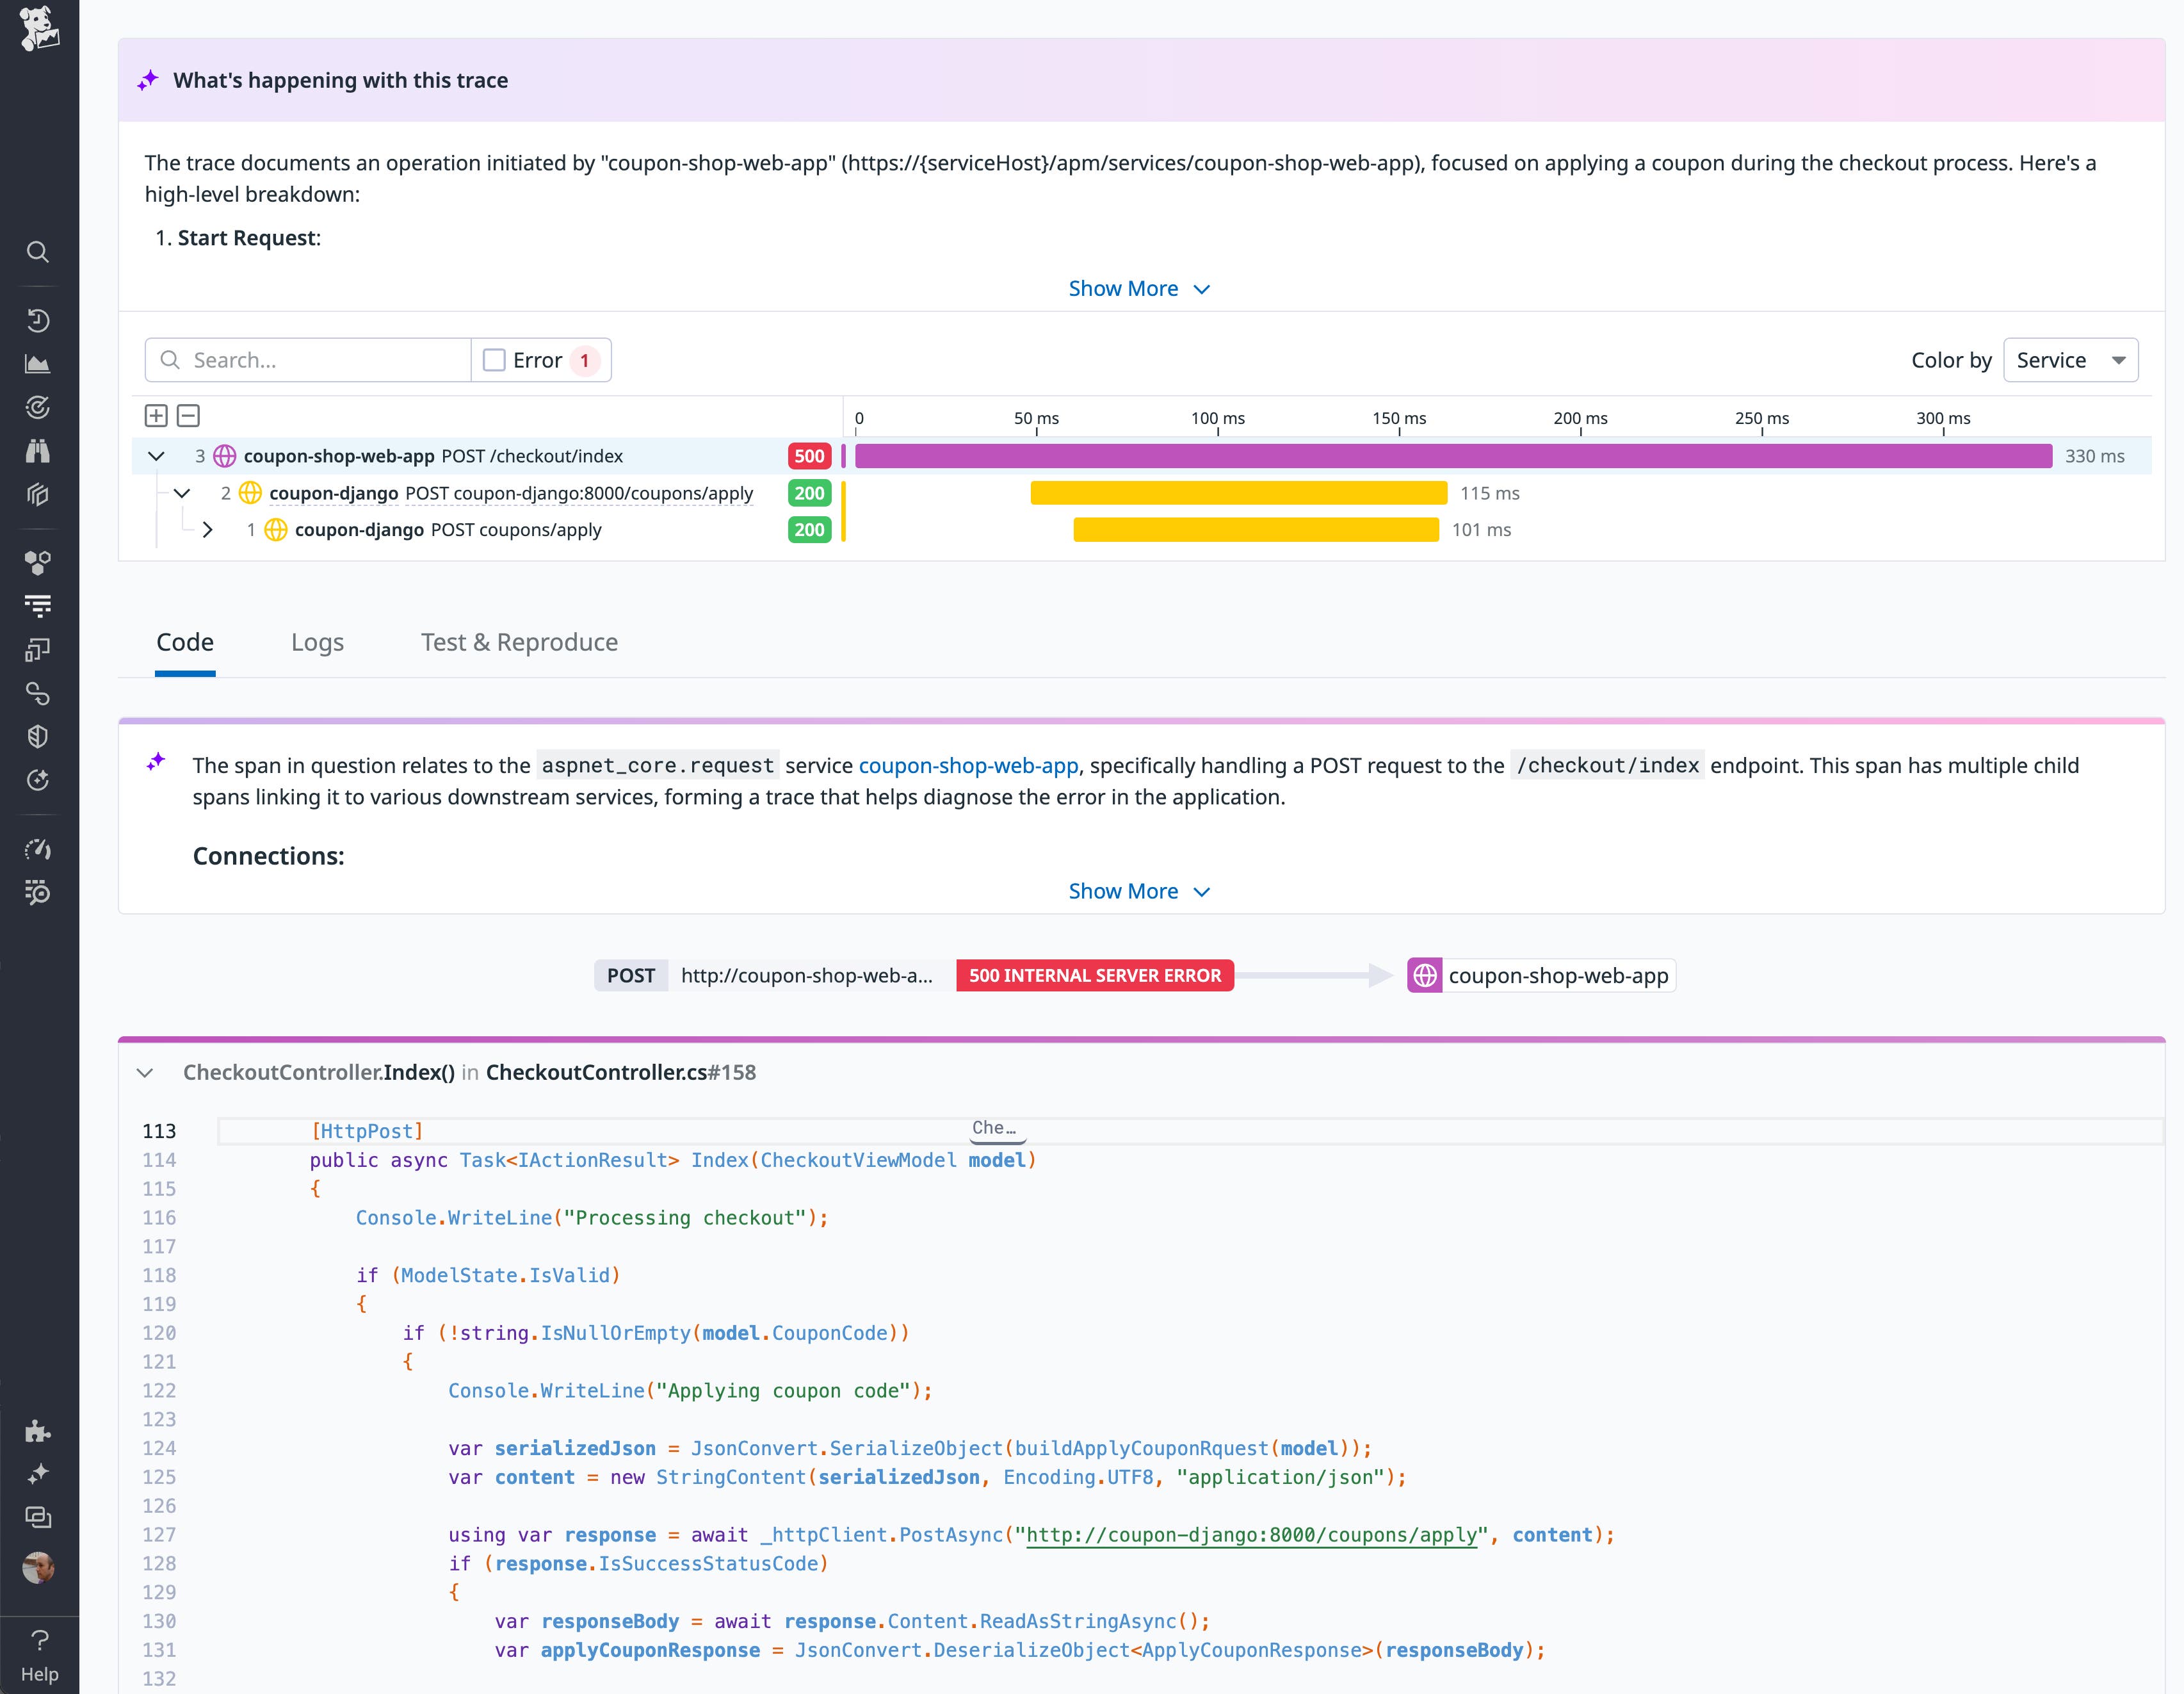
To investigate the bug further, you can pivot to the Datadog Debugger, which builds on the context provided by Exception Replay. The Debugger uses APM data to visualize the flow of requests between the services in your app at the time the bug was triggered, illustrating the performance of each service and surfacing any errors that may have contributed to the problem.
In the screenshot below, the Debugger presents an AI-generated summary of a call to the coupon-shop-web-app service’s /checkout/index endpoint, which returned an error. The Debugger also shows the lines of code that were executed to process the request.
With this complete understanding of the bug—including the services involved, the values passed between them, and the lines of code executed—you can move from investigating the bug to remediating it. But you can’t fix the bug until you can reliably reproduce it in your local environment, and your fix won’t be complete until you’ve written an integration test to prevent regressions.
Easily reproduce errors and generate integration tests
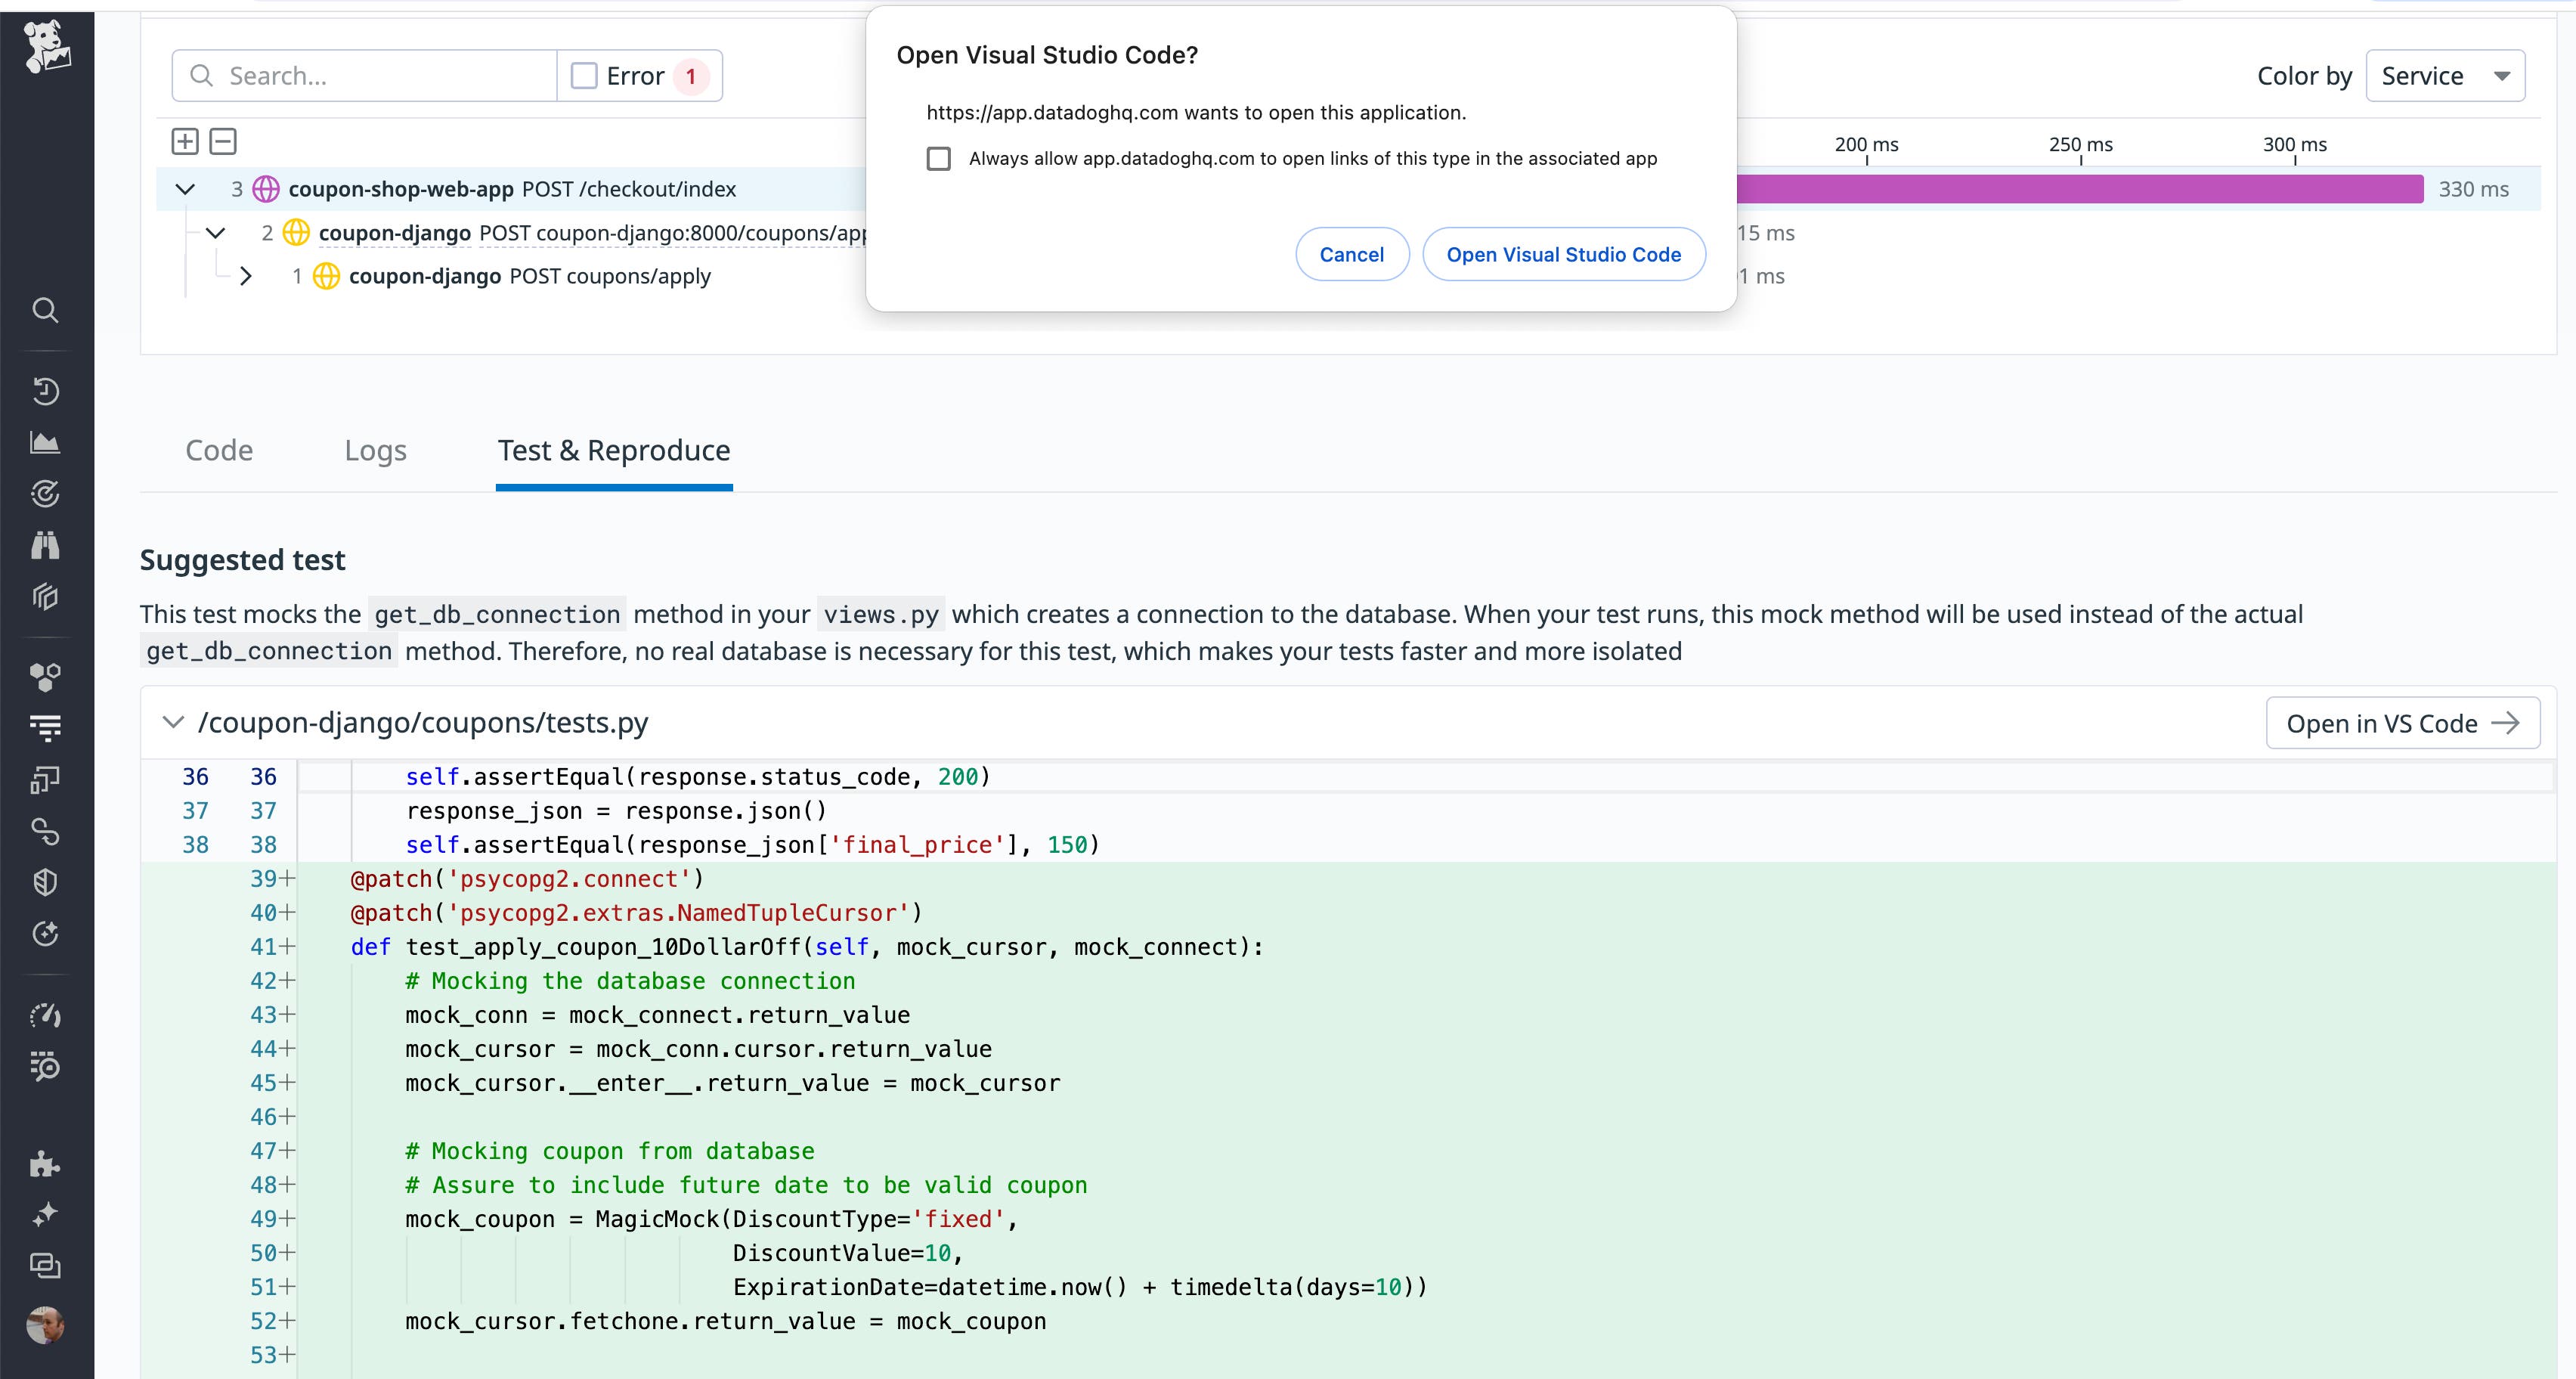
Reproducing bugs locally has historically been a difficult task because it requires you to understand the conditions of the error, including the values of the application’s runtime variables at the time the exception was triggered. But by providing context around production bugs, the Debugger enables you to create an integration test with a single click to reproduce the bug locally and ensure that it doesn’t recur. Based on the production context collected by the Debugger, Datadog uses AI to mock all of the relevant upstream and downstream services and create an integration test. You can run the test in your IDE and step through your code to get a closer look at what you need to fix, then add the test to your CI/CD pipeline to ensure that this particular bug doesn’t occur in the future.
The screenshot below shows a test generated automatically by the Debugger, ready to be added to a project in Visual Studio Code.
Debug production errors with AI insights and runtime context
When errors arise in production, Live Debugging enables you to investigate and fix them efficiently—without disrupting your flow state. You can see crucial context inside your IDE plus AI-generated issue summaries and integration tests to help you quickly root-cause, reproduce, and resolve production errors.
To try out Live Debugging, enable the source code integration and the Datadog IDE Plugins, and sign up for the preview. See the documentation to learn more about Error Tracking and Exception Replay. If you’re not already using Datadog, you can get started with a free 14-day trial.
