Nicholas Thomson

Danny Driscoll

Kennon Kwok

Vignesh Palaniappan
Custom resources are critical components in Kubernetes production environments. They enable users to tailor Kubernetes resources to their specific applications or infrastructure needs, automate processes through operators, simplify the management of complex applications, and integrate with non-native applications such as Kafka and Elasticsearch. Users create custom resources with custom resource definitions (CRDs), which are files that define the schema, name, versioning, and validation for a custom resource.
Datadog encourages the use of CRDs via the Datadog Operator, which enables users to deploy the node-based Agent in Kubernetes environments. Additionally, the Datadog Operator also includes CRDs that help you deploy and manage other Datadog resources, such as monitors, dashboards, metrics, SLOs, and more. Using these CRDs to manage Datadog resources has many benefits, including ease of use, clarity of ownership (as application teams can deploy and manage Datadog components like dashboards and monitors themselves), and more seamless workflows.
CRDs can impact both the stability and performance of the entire Kubernetes cluster and any applications using them, so it’s important to monitor your CRDs for resource management, availability, autoscaling configuration, and state validation. Users can now monitor their CRDs by using Datadog Container Monitoring to ensure that configuration, automated updates, and other features remain issue-free.
In this post, we’ll explain:
- What custom resource definitions are
- The CRDs we provide for Datadog users, and their benefits
- How to monitor your CRDs with Datadog Container Monitoring
What are custom resource definitions?
Kubernetes resources are Kubernetes API endpoints that store information describing objects such as pods, deployments, services, and more. Custom resources are extensions of the Kubernetes API that allow users to define their own objects and manage configurations or operations that aren’t included by default in Kubernetes. Custom resources provide a way to extend the functionality of Kubernetes beyond its core objects, enabling users to configure their infrastructure to handle more specialized tasks or domain-specific logic (e.g., database management, network policy automation, machine learning workflows, CI/CD, and GitOps).
CRDs enable you to extend Kubernetes by defining complex, modular custom resources that can be deployed in Kubernetes without separate tooling, that can automatically scale based on demand, and that can be managed like application code in Git. Once a CRD is created, Kubernetes will handle and manage these custom resources just like built-in objects. For example, if you wanted to manage a specific resource type for your application (e.g., a database object or a backup schedule), you could create a CRD that describes the structure and behavior of these objects.
Custom controllers watch the state of your custom resources and take actions to reconcile the desired state with the actual state. For instance, a controller might automatically create, scale, or delete resources based on the custom resource’s definition and the evolving needs of your application.
An operator is a specialized type of controller that extends the Kubernetes API to manage complex, domain-specific applications (e.g., databases, message queues, etc.) by linking CRDs to custom controllers.
The CRDs we provide for Datadog users, and their benefits
The primary way we use CRDs at Datadog is through the Datadog Operator, which enables customers to streamline installation and Agent management workflows. The Datadog Operator also helps users manage some of our open source tools, including our Datadog External Metrics Provider.
The Datadog Operator can also be used to manage and standardize a host of other Datadog components. There are certain Datadog components that it often makes more sense to manage with CRDs, such as dashboards, monitors, metrics, agent profiles, pod autoscalers, and SLOs.
These CRDs provide a great way for teams to take ownership over certain Datadog features and simplify their deployment and management, as they offer a faster, easier, and more modular option to manage resources than alternatives such as Terraform. Additionally, CRDs can help align resources like dashboards and monitors with the applications they depend on.
For example, if an application developer wants to package dashboards, SLOs, and monitors alongside their application, it makes sense for them to do so using the CRDs in the Datadog Operator. This is more efficient than, for example, reaching out to the platform team who owns the Terraform code that manages these Datadog components, submitting a PR, and running a Terraform apply that covers the state of a number of infrastructure components like instances and EKS clusters—before it even gets to applying your dashboard creation.
Monitor your CRDs with Datadog Container Monitoring
Because CRDs represent key components of applications running on Kubernetes, your applications’ health, performance, availability, and resource consumption often depends on these CRDs. As such, it’s important to monitor your CRDs to stay ahead of issues like resource mismanagement, which can lead to elevated operating costs; permissions or configuration errors, which can cause your application to become unavailable; outdated configurations, which can cause your application to fall out of sync with its desired state; and more.
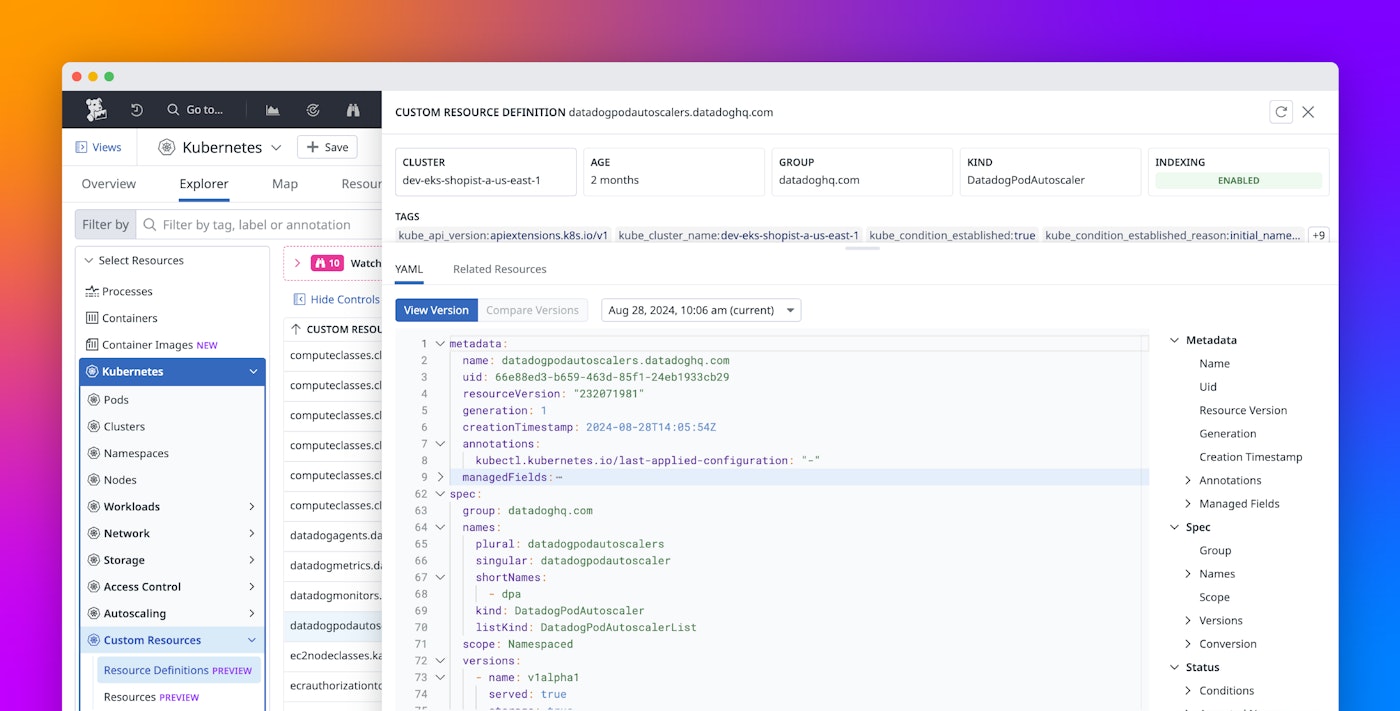
With Datadog Container Monitoring, you can collect and access your CRDs from the Datadog Kubernetes Explorer. This visibility enables you to assess the health and status of the critical CRDs across the board. If you notice any issues—such as a CRD stuck in an unready or error state, a CRD consuming excessive CPU, incorrect configurations that cause your CRD to behave unexpectedly or fail to deploy, or inefficient scaling policies—you can drill down into that CRD to inspect it and then take action to address any configuration issues.
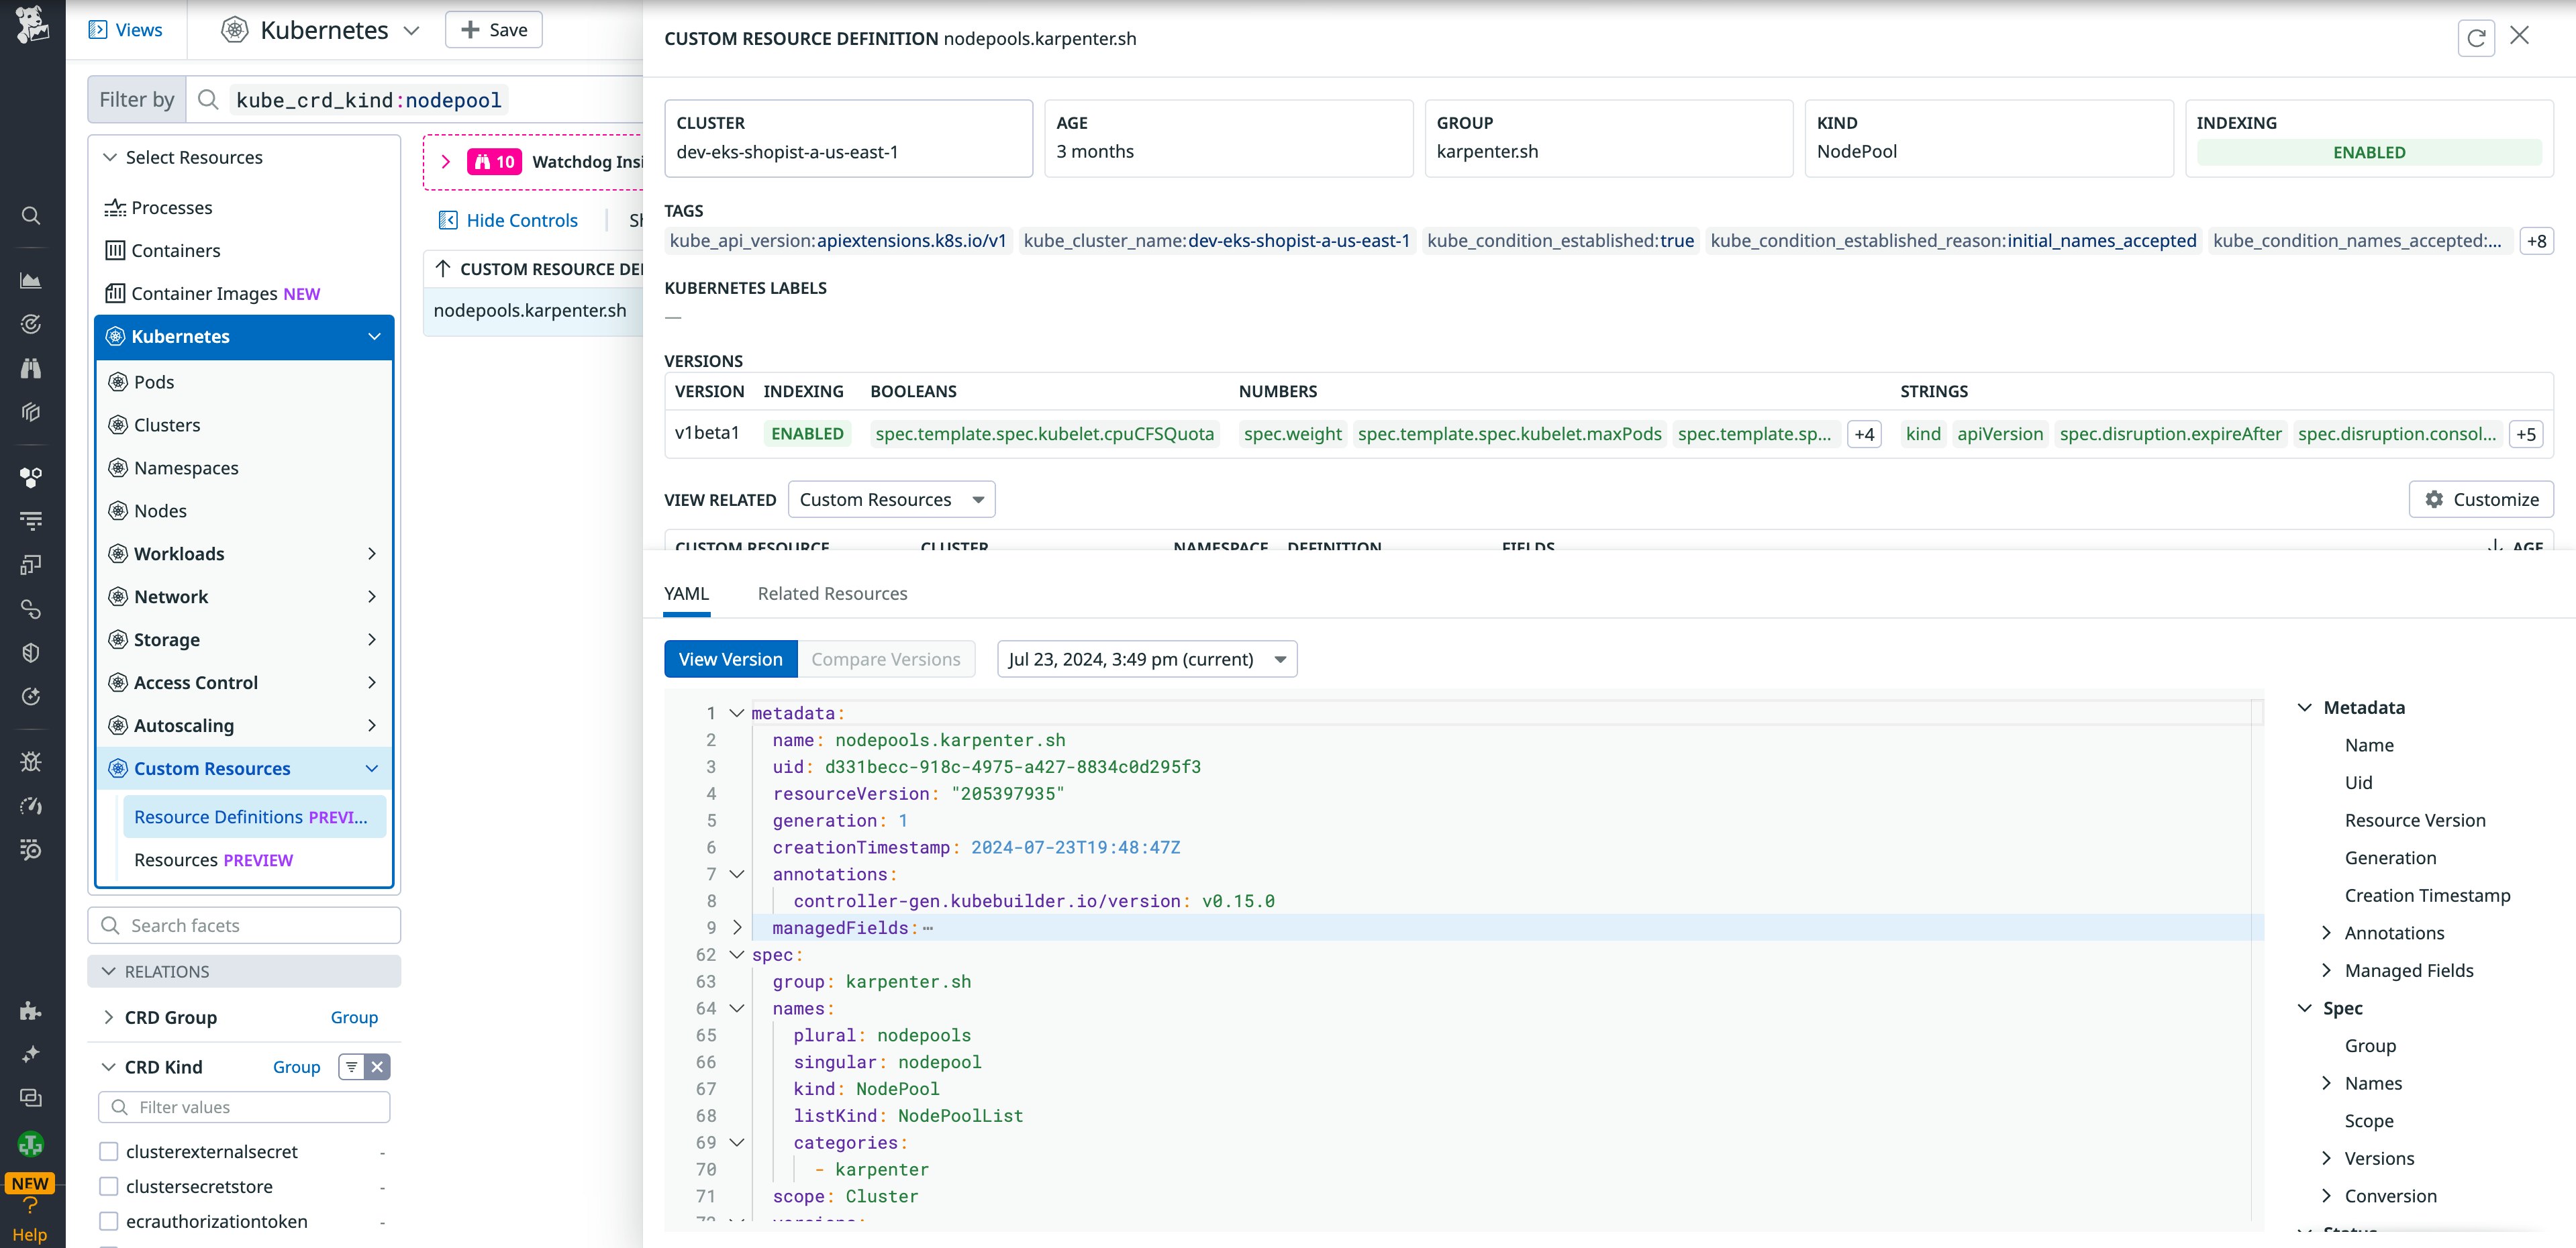
If you are using Karpenter, you can easily access and confirm the current configuration of your active NodePools to ensure the rules are configured as intended.

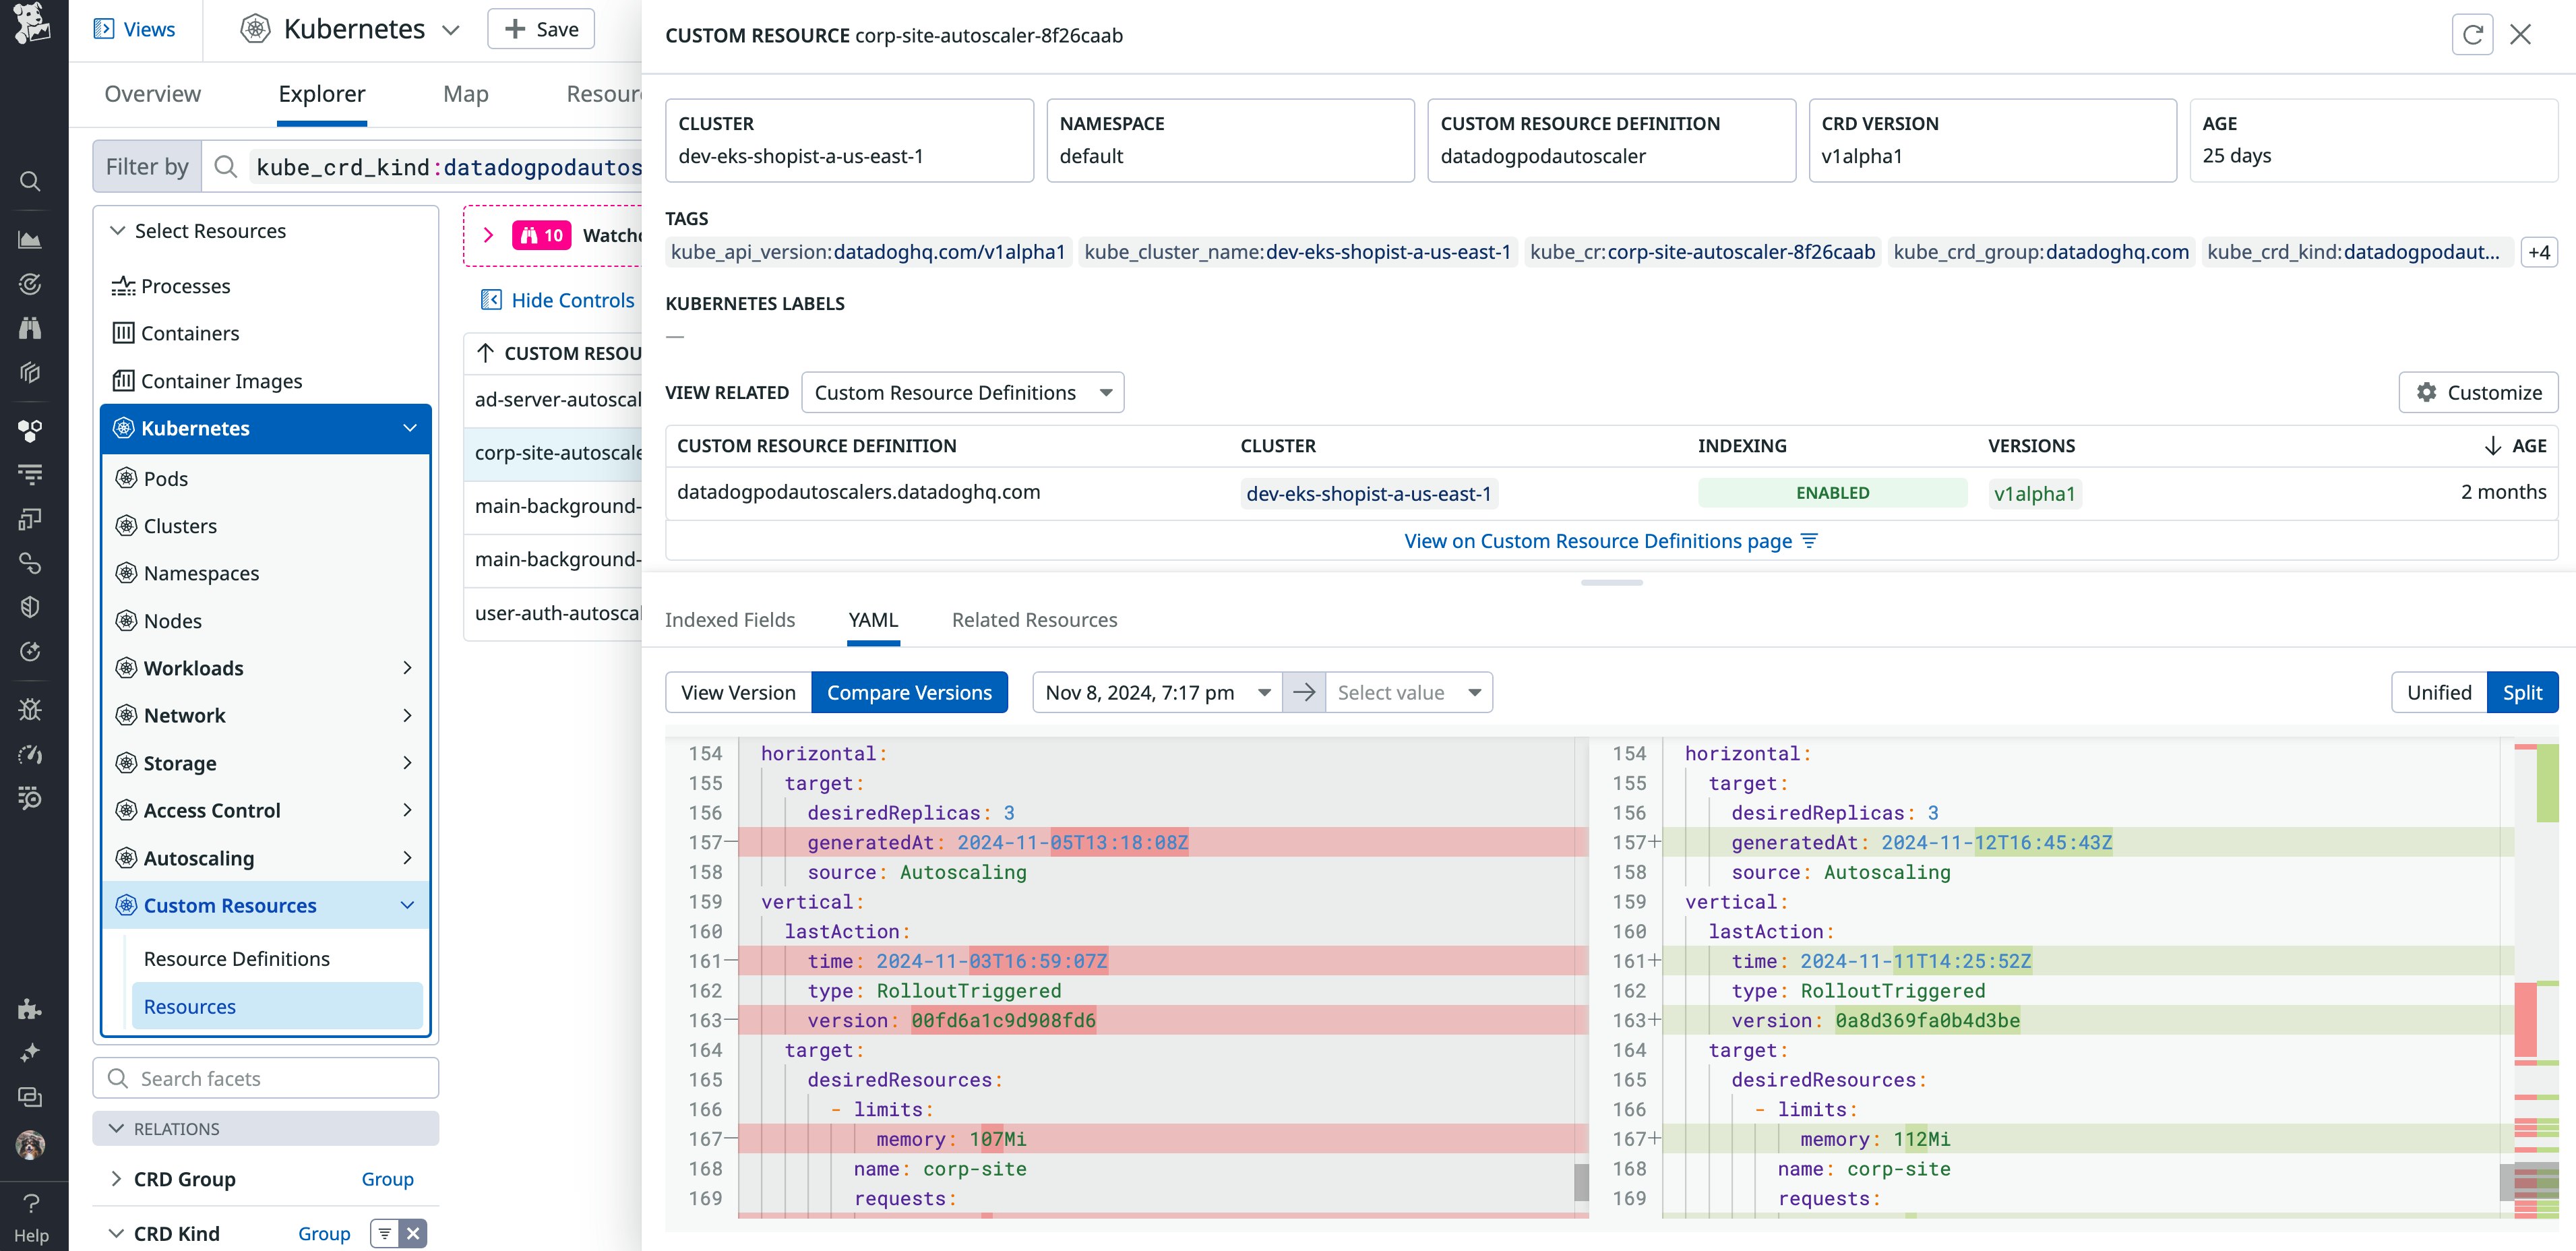
Additionally, you can use Datadog Kubernetes Autoscaling to observe the change history and recommendations that your DatadogPodAutoscaler has applied to your CRDs.

Datadog Container Monitoring offers you deep visibility into your CRDs’ configuration and version history in the same platform as the rest of your monitoring data, enabling you to pivot from an issue in your application to the CRD causing it. This visibility enables you to quickly and seamlessly fix configuration errors introduced in new versions, adjust scaling policies to match demand, troubleshoot failing or unavailable components of your application, and more.
Monitor your CRDs with Datadog
CRDs offer a streamlined, modular way to deploy and manage applications in Kubernetes. Adopting CRDs for your Kubernetes deployments can help application teams own certain resources and improve deployment velocity. Datadog offers a number of CRDs as part of the Datadog Operator, which can help teams deploy Datadog components with ease and maintain ownership of updates and configuration changes. Datadog Container Monitoring enables you to gain deep visibility into CRDs so that you can ensure the health and availability of your applications running on Kubernetes.
Upgrade the Datadog Agent to version 7.51 and above to begin collecting CRDs, and get complete observability of your Kubernetes environment. If you’re new to Datadog, sign up for a 14-day free trial.


