Logging your Java applications is essential to getting visibility into application performance and troubleshooting problems. But, with a variety of available libraries and configuration options, getting started logging in Java can be challenging.
In this post, we will cover:
- The main Java logging frameworks and facades
- How to create, configure, and format your Loggers
- How to augment your logs so they include more useful information
- How to use a centralized logging solution to analyze, filter, and alert on your logs
We will also go over some best practices that can help you get the most out of your Java logs, including why you should write your logs to a file in JSON format and how to enrich your logs with extra context and metadata. We’ll also go over how using a third-party logging service or platform can be particularly useful in getting the most out of your Java logs.
Java logging frameworks
Java’s native logging package, java.util.logging (JUL), may be sufficient for many developers, but there are several widely used third-party libraries that provide additional features and improved performance. For more complex applications, it’s likely you will want to use a third-party logging library. The most popular of these are:
Note that, while it remains widely used, Apache deemed Log4J end-of-life in 2015, with development continuing on Log4J2.
On top of the framework, it can be beneficial to use a logging facade. A logging facade decouples your application’s logging code from any specific logging backend by providing an abstraction layer or interface for various logging frameworks. This lets developers change which framework they use at deployment time without needing to alter their code. The most popular logging facade is SLF4J, or Simple Logging Facade for Java. SLF4J supports Log4J, Logback, JUL, and Log4J2 backends.
For example, you can use the SLF4J API to construct a Logger, but include the dependency and configuration file for the logging framework of your choice. The instantiated Logger would use that framework. Changing logging frameworks is simply a matter of changing your application’s logging dependencies.
Regardless of which framework or facade you use, most share similar methods for configuration and use a common set of mechanisms to create and process log messages.
Configuring your Java Loggers
Most Java logging frameworks support programmatic configuration, but using separate configuration files placed in your project’s classpath lets you create robust logging environments. This approach also lets you easily change logging configurations by editing a single file. These files might be Java .properties files or XML files. The way you include these files in your classpath will depend your Java development environment. For example, in a Maven project, you could place them in your src/main/resources directory.
A configuration file will provide specifications for:
- Logger objects
- Logging endpoints called Appenders
- Log message format
Loggers
A Logger is an instantiated object that logs messages for a defined scope of an application, application component, or service. You can create multiple Loggers, and in fact you should have a Logger for each class you want to log within your application or service, with the Logger named after that class.
In your configuration files you can create individual specifications for Loggers based on their namespace. So, for example, the following is part of a Log4j2.xml configuration file that defines a Logger for the package namespace com.example.app:
<?xml version="1.0" encoding="UTF-8"?>
<Configuration status="WARN">
[...]
  <Loggers>
    <logger name="com.example.app" level="INFO">
      <AppenderRef ref="java-logger"/>
    </logger>
  </Loggers>
[...]
</Configuration>
This configuration would apply to any Logger instantiated within the com.example.app namespace, even if it is named specifically after a class within that package. The following example creates a class, ClassOne, within that package. The class instantiates a static Logger, names it after the class using the class.getName() method, and defines a method that logs an Info-level message:
package com.example.app;

import org.apache.logging.log4j.Logger;
import org.apache.logging.log4j.LogManager;

public class ClassOne {

  static final Logger logger = LogManager.getLogger(ClassOne.class.getName());

  public void exampleMethod() {

    logger.info("This is a logging message.");

  }

}
If we set this Logger to write, for example, to console, the method would log the following message:
This is a logging message.
So far, we have not configured any log message formatting. This means that no additional information—such as the class that wrote the log or its severity—is included in the message, making it less helpful for troubleshooting. We’ll talk further about enriching our log messages with formats and additional metadata.
While it’s possible to manually provide a name when you instantiate a Logger, you should use the getName() method. This automatically includes the full Java package namespace. (It also prevents breaking the Logger in case the class name is changed.) Java Loggers have hierarchical relationships based on namespaces. In this case, our Logger named com.example.app.ClassOne is a child to a Logger named com.example.app.
A child Logger inherits any configured properties that may exist for the parent Logger. For example, if a Logger is assigned a log level, it and any child Loggers will log events at that same severity or greater. This simplifies Logger configuration, especially when using a Logger per class; any subclasses can use the same Logger as their parent class without any additional configuration.
Note that in the Log4J2 configuration example above, the line <Configuration status="WARN"> refers to the level of internal Log4J2 events that will be logged to the console, and is distinct from the logging level specified for other Loggers.
Log levels
Log levels let you filter what events a Logger will capture depending on their severity. When you configure a minimum log level, any Logger constructed from that configuration will ignore any logs below that level. This helps filter your logs and quickly surface the ones you are most interested in. If you use a logging or monitoring service, visualizing your logs by level can also provide a high-level look at overall performance for your application or service.
Note that available log levels can vary depending on the framework. For example, Log4J2 uses the following levels, from least to most severe:
TraceDebugInfoWarnErrorFatal
However, java.util.logging uses the following, again from least to greatest severity:
FinestFinerFineConfigInfoWarningSevere
In most cases you can also use Off or All to disable logging or ensure you log all events. If you use a facade, such as SLF4J, it has a built-in set of log levels and will automatically map levels of the backend framework to its own API.
Some frameworks, such as Log4J and Log4J2, let you create custom log levels so you can add more granularity to your logging. Each level corresponds to a numeric value.
So for example, in Log4J2 you might include the following in your configuration file:
<Configuration status="WARN">
  [...]
  <CustomLevels>
    <CustomLevel name="NOTICE" intLevel="450" />
  </CustomLevels>
  [...]
</Configuration>
You may then use the Notice log level as you would any other built-in level.
Appenders
Appenders—or Handlers in some frameworks—define the endpoints for Loggers. Different logging frameworks will provide out-of-the-box support for varying endpoint types, but most support similar basic Appender types. We will cover the following:
Different Appenders are useful in different situations, but, as we’ll cover in more detail, writing logs to a file provides several benefits over other methods.
Log to console
Logging to a console is one of the most basic forms of logging and is the default behavior for some frameworks. It entails writing log messages to either System.out or System.err. The following is an example of a consoleAppender configuration in Log4J2:
<Configuration>
  <Appenders>
    <Console name="consoleLogs" target="SYSTEM_OUT">
      [...]
    </Console>
  </Appenders>
  [...]
</Configuration
Logging to the console can be good for basic debugging and troubleshooting of simple applications, but as your application becomes more complex, it becomes unwieldy. It also doesn’t provide many options for filtering or sorting your logs, and it is slower and more resource intensive than other logging options.
Log to a file
File Appenders let you write log messages to one or more external files. This offers several substantial benefits over other endpoints. The most immediate are retention and security, as you can store, back up, and secure log files. You can also create rules to log to different files, whether it’s to separate log levels, logs from different classes or parts of your application, etc.
Logging to files also avoids network issues that might affect streaming logs to a remote endpoint. Having your application shoulder the load of forwarding logs may affect its performance if there are any kind of connectivity problems. Instead, logging to files and then using a log shipper or monitoring service, such as Datadog, to tail those files and send the messages to an endpoint means you won’t have to worry about a negative hit to application performance.
Below is an example of a configuration for a FileAppender in Logback:
<configuration>
  <appender name="fileAppender" class="ch.qos.logback.core.rolling.FileAppender">
    <file>javaApp.log</file>
    <encoder>
      <pattern>%d{yyyy-MM-dd HH:mm:ss.SSS} [%thread] %-5level %logger{36} - %msg%n</pattern>
    </encoder>
  </appender>
  [...]
</configuration>
This configuration tells Loggers to write to a file javaApp.log. Each entry will use the specified pattern with the timestamp, thread name, log level, Logger name and the log message.
See more about using FileAppenders with Logback in their documentation.
Stream logs to an endpoint
Streaming logs to a remote endpoint can be useful if you do not have access to the infrastructure where your application is running and so can’t log to a file. A SocketAppender, or SocketHandler, can send log messages to a network endpoint, specified by host and port. Frameworks provide support for various features such as SSL encryption or the ability to send messages via UDP or HTTP instead of TCP.
A related Appender that some frameworks support is a SyslogAppender. This is a SocketAppender that specifically forwards messages to a syslog server using the syslog format.
Other log destinations
Java logging frameworks—in particular Log4J2 and Logback—provide out-of-the-box support for a variety of other Appenders. For example, Log4J2 has a CassandraAppender that sends logs to an Apache Cassandra database. Both Log4J2 and Logback include an SMTPAppender that will send log messages as an email. It is also possible to create custom Appenders.
The ability to configure multiple Appenders means that you can process logs in complex ways. For example, you might want to log to separate files or endpoints depending on the type or severity of the log. You can view documentation for more information on endpoints for Log4J2, Logback, and JUL.
Layouts
Standardizing your log messages makes it easier to filter, sort, and search for specific logs. Most frameworks provide Layouts, also called Formatters, which specify how an Appender should format log messages and what information is included. This may be a specific pattern and order of elements that a log entry string should include. Or, better yet, it might encode your log messages to a format like JSON for easier processing by a logging service.
Pattern Layouts
A PatternLayout provides an Appender with a layout template with special characters to define a specific order of log message elements and some formatting options. Below is an example of a console logger with a pattern Layout using Log4J2:
<Configuration>
  <Appenders>
    <Console name="consoleLogs" target="SYSTEM_OUT">
      <PatternLayout pattern="%d{yyy-MM-dd HH:mm:ss.SSS} [%t] %-5level %logger{36} - %msg%n"/>
    </Console>
  </Appenders>
  [...]
</Configuration>
This would generate log messages like the following:
15:55:13.301 [http-nio-8080-exec-1] ERROR com.example.app.WebDict.APICall - No definition found.
Pattern layouts can help make logs more readable, particularly if you’re logging to the console. However, configuring your Appenders to log to JSON gives you more options in terms of how to view and process your logs.
Log to JSON
Logging to JSON has many advantages over using message patterns, particularly if you use a monitoring service or logging platform. A service can easily parse the JSON, generate attributes from log fields, and present the information in a human-readable format that you can use to visualize, filter, and sort your logs. Logging to JSON lets you add custom information to logs in the form of new key-value pairs. JSON also solves a common issue with Java logs: multiline stack traces. In JSON, log lines wrap into a field to make up a single log event that you can later parse for the full stack trace.
Note that logging to JSON can make your log files much larger, making proper storage or log rotation more important.
Java does not have a native JSON library, so logging backends require a separate dependency to format or encode messages in JSON. The Logstash Logback JSON encoder and Jackson are two commonly used libraries.
Once you have a JSON library added to your project’s classpath, you can attach a JSON Layout to your Appenders. For example, below is part of a Log4J2 configuration that creates a fileAppender that uses a JSON layout. In this case we’re also adding a custom attribute through the key-value pair, service:java-app. The Layout will include this pair in all log entries written by that Appender, enriching your logs with additional information. (We will discuss adding and using metadata to your logs further below.)
<Configuration>
  <Appenders>
    <File name="javaLogs" filename="logs/javaApp.log">
      <JsonLayout compact="true" eventEol="true" >
        <KeyValuePair key="service" value="java-app" />
      </JsonLayout>
    </File>
  </Appenders>
  [...]
</Configuration>
We’ve added some additional formatting options: compact="true" and eventEol="true". Compact log messages will format each entry as a single line, while eventEol places each new entry on a new line. With this setup, the same log message from above looks like this:
{"timeMillis":1551821295560,"thread":"http-nio-8080-exec-1","level":"ERROR","loggerName":"org.example.app.WebDict.APICall","message":"No definition found.","endOfBatch":false,"loggerFqcn":"org.apache.logging.slf4j.Log4jLogger","threadId":20,"threadPriority":5,"service":"java-app"}
While this log may be slightly less human readable, it provides a great deal of information by default and in a standardized format. A monitoring service ingesting these logs could let you slice and dice your logs by any of these attributes.
Enrich your Java logs
There are several ways to add additional or custom information to your logs. For example, we’ve seen how logging to JSON lets you add additional key-value pairs to your log messages. One of the most useful ways to add custom information to your log messages for sorting and analysis is through Mapped Diagnostic Context (MDC).
Mapped Diagnostic Context
A typical distributed system is multithreaded, with different threads serving different requests from different clients. Each thread has its own specific context. Contextual metadata in your logs—such as user ID, client host, session information, query data, etc.—can be invaluable to getting more insight into how your application is performing and which users are experiencing problems.
Log4J, Log4J2, and Logback all support Mapped Diagnostic Context, or MDC, which lets you store key-value pairs that are then added to your log data. This is particularly useful if you are logging to JSON because these contextual attributes can then be used to filter and sort your logs.
Note that with Log4J2, in order for your MDC attributes to be included in JSON output, you must include the properties="true" flag in your JsonLayout:
<JsonLayout compact="true" properties="true" eventEol="true" >
 [...]
</JsonLayout>
As an example, we might have a request ID associated with a thread. We can add this ID to MDC and have it automatically included in any associated logs:
import org.apache.logging.log4j.ThreadContext;

[...]

    ThreadContext.put("request_id", requestId);
We can see the contextual information (contextMap) included in a log that shows a refused connection to a database:
{
  "timeMillis": 1551908790726,
  "thread": "http-nio-8080-exec-2",
  "level": "ERROR",
  "loggerName": "com.example.app.WebDict.DbCalls",
  "message": "Couldn't connect to Redis: java.net.ConnectException: Connection refused (Connection refused)",
  "endOfBatch": false,
  "loggerFqcn": "org.apache.logging.slf4j.Log4jLogger",
  "contextMap": {
    "request_id": "<REQUEST_ID>"
  },
  "threadId": 21,
  "threadPriority": 5,
  "service": "java-app"
}
With a logging service we can use the added attributes to filter our logs, which can provide insight, for example, if only certain clients are having this issue, which can help speed up troubleshooting.
Centralize your logs
Large, complex applications can generate so many logs that they become difficult to organize, store, and access for investigating problems. Even if you are writing logs to multiple files, a centralized logging platform can tail them all and aggregate everything into one location for troubleshooting and analysis. Or, if you aren’t able to access your application’s hosts, you can stream logs directly to a service’s endpoint for ingestion.
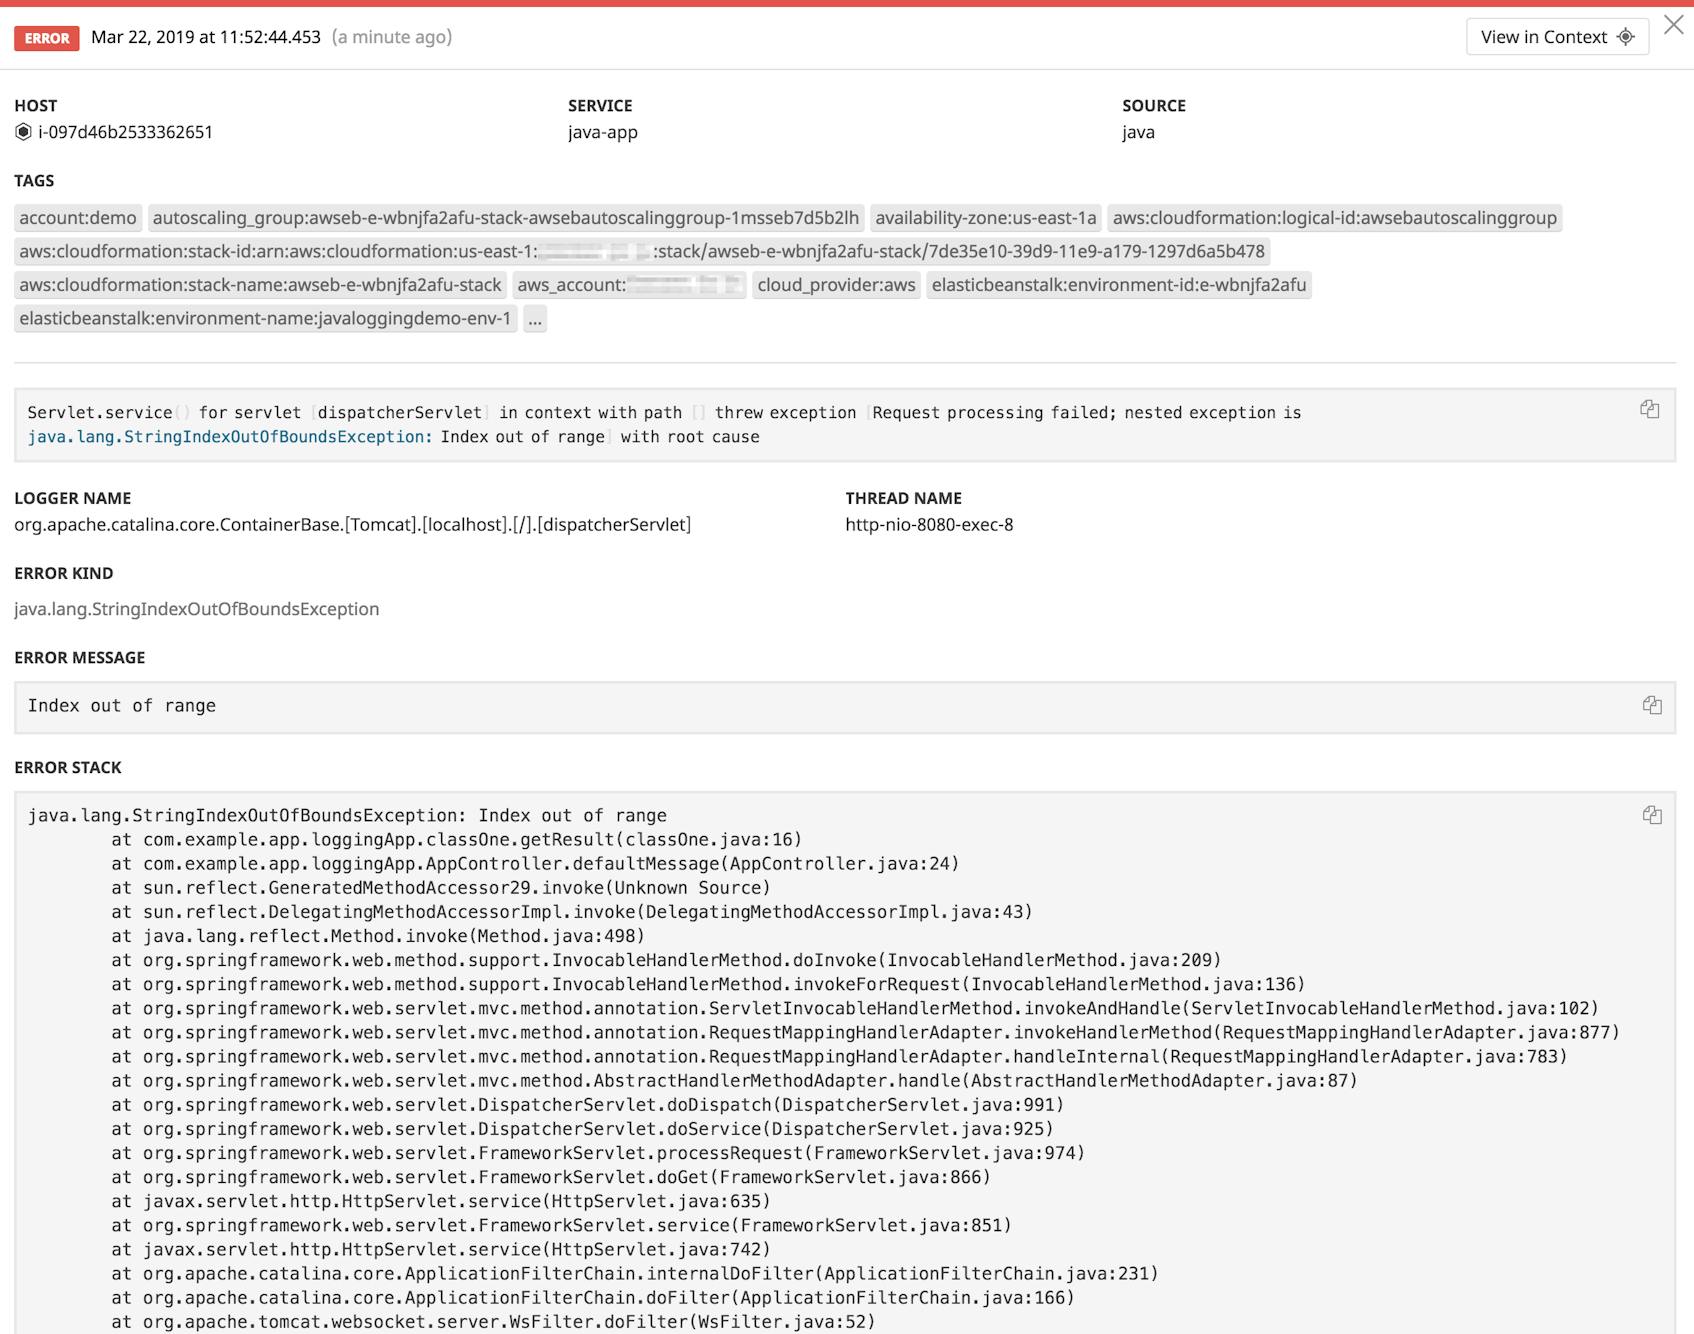
Use Datadog to standardize your Java logs for easier collection and analysis.
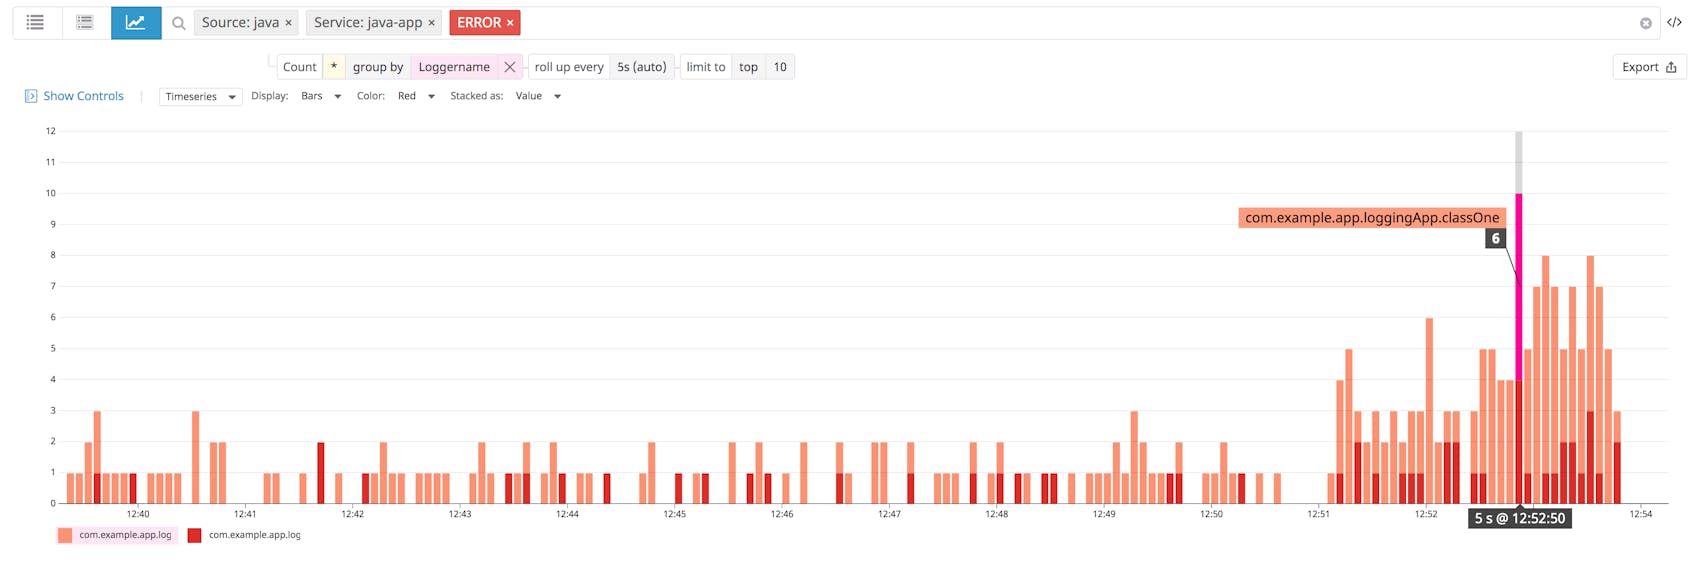
A monitoring service can automatically parse all JSON fields in your log messages so that you can sort, filter, and alert on them by any attribute. For example, grouping your error logs by Logger name can surface problematic classes in your application that are generating a large number of errors.
This functionality can be particularly helpful with MDC, as you can use different contextual attributes to drill down into, for example, whether specific endpoints or requests are experiencing problems.
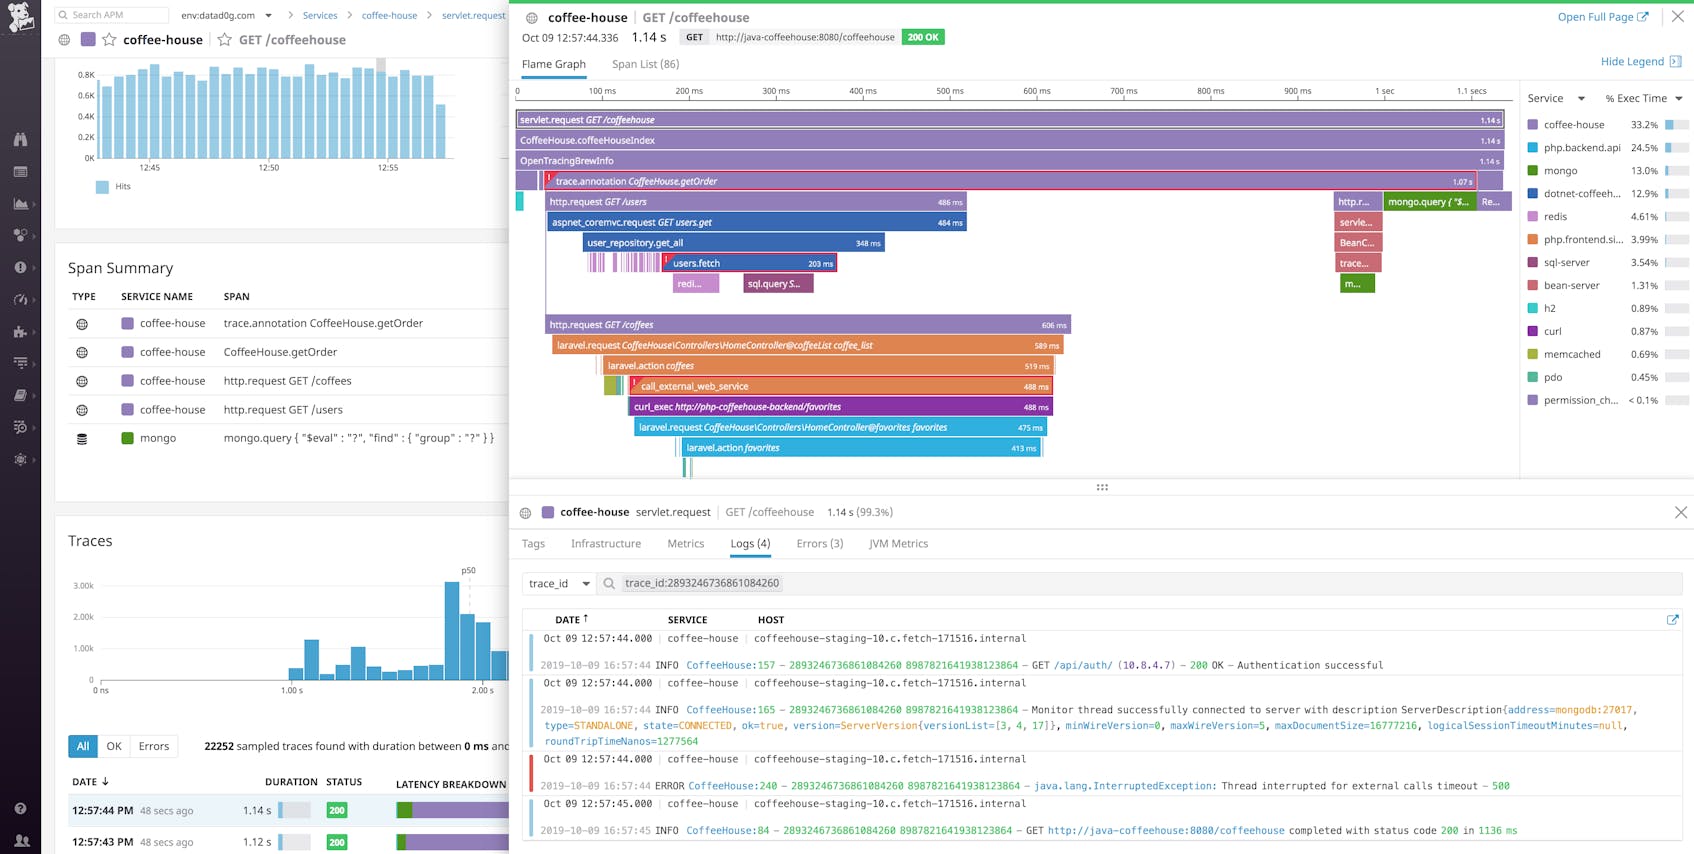
A central monitoring service like Datadog can also let you correlate your logs with request traces and infrastructure metrics—such as from your web servers, databases, etc.—giving you full insight into how your application is performing. For example, Datadog automatically collects data about the infrastructure your application is running on and the specific service that emitted the log. Using thread context to include request trace IDs in your logs means you can instantly pivot from logs to traces, letting you correlate logs with application performance data—and vice versa—for easier troubleshooting. See our documentation for more information on including trace IDs in your Java logs.
Get more out of your Java logs
Properly configured Loggers can be invaluable to investigating and troubleshooting issues with your Java applications. This post has covered some basic methods for how to set up your Loggers as well as some best practices for getting the most out of your logs, including logging to files, structuring your logs in JSON, and adding contextual metadata for easier troubleshooting.
A centralized, hosted monitoring service like Datadog can help get the most out of your logs by collecting, parsing, and visualizing them so that you can view them alongside metrics and distributed request traces from your environment. If you’re not using Datadog yet and want to start collecting logs from your Java applications, sign up for a free 14-day trial.


