Thomas Sobolik
Unsurprisingly, application crashes due to fatal errors can be a major pain point for iOS users. Recent research shows that roughly 20 percent of mobile application uninstalls were due to crashes or other code errors. As a developer, it’s paramount to manage this potential churn by capturing comprehensive crash data in order to track, triage, and debug recurring issues in your iOS apps.
Datadog RUM’s iOS SDK enables you to collect crash data from your iOS apps so you can correlate them with user metadata and app interactions. This helps you determine the scope of application errors so you can triage the most severe issues and get deeper insight into your application’s performance.
In this post, we’ll discuss how you can use Datadog to:
- Collect and process crash reports using the RUM iOS SDK
- Analyze crash data using dashboards, alerting, and Error Tracking
Collect crash reports
The Datadog iOS SDK enables you to collect logs, traces, and RUM data from your mobile applications. Now, you can also collect crash reports so that you can visualize crash data in dashboards, analyze symbolicated error reports, and triage error trends with Error Tracking.
To enable crash report collection, simply modify the SDK’s initialization steps to implement the enableCrashReporting method:
import DatadogCrashReporting // NEW
Datadog.initialize( appContext: .init(), trackingConsent: trackingConsent, configuration: Datadog.Configuration .builderUsing( rumApplicationID: "<rum_application_id>", clientToken: "<client_token>", environment: "<environment_name>" ) .trackUIKitRUMViews() .trackUIKitActions() .trackURLSession() .enableCrashReporting(using: DDCrashReportingPlugin()) // NEW .build())Symbolicate your iOS crash data
Crash reports from iOS apps are unsymbolicated—having readable function names in the stacktrace replaced with memory addresses—to reduce file size and provide a security benefit (i.e., the symbols can’t be read by other code running within the same process). You can use Datadog’s CLI to collect and upload mapping files (.dSYM files) stored in your app’s build directory. Datadog then uses them to replace the memory addresses with meaningful symbols. This way, your stacktraces will appear in Datadog in a readable format.
Once you’ve begun forwarding crash reports, Datadog will use the data to populate graphs in the out-of-the-box mobile RUM dashboard. This shows you key information about the health of your app, including:
- app resources throwing the most errors
- most common error types (HTTP, syntax, runtime exception, etc.)
- iOS versions or versions of your application experiencing crashes

Triage and analyze crashes with Error Tracking
During heavy usage, your application may generate a large volume of errors that cause it to crash—such as I/O exceptions, runtime exceptions, out-of-memory errors, and more. With potentially thousands of devices emitting this data, it can be difficult to effectively make sense of it all.
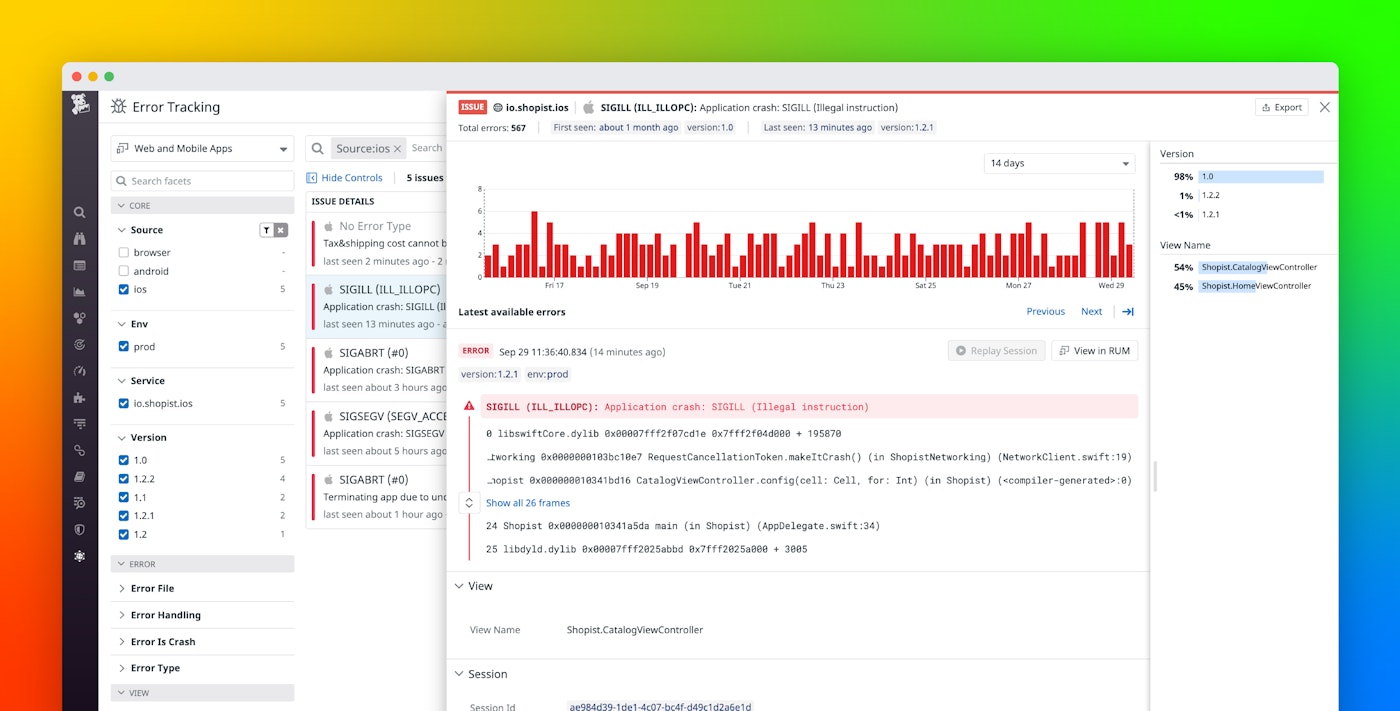
Datadog Error Tracking monitors your iOS crash reports and groups similar errors together into issues, so you can view debugging info from your app alongside user session info from RUM. RUM automatically enriches each error with key metadata like customer location, device, code version, and view name. This helps you understand the scope of crashes—how often they occur and which customer locations, releases, and parts of your app are affected—and begin to triage the most severe and frequent crashes to focus your debugging efforts on.

You can dive into a specific error to view key context for performing root-cause analysis of your issues. This includes key information from the crash report, such as the error message and a fully symbolicated stacktrace. You can also see any custom attributes you add using the SDK’s included setRUMResourceAttributesProvider function—for example, the device location, device type, or the device’s internet connection status.
The session timeline charts all the view loads, errors, and user actions that occurred during the relevant session that produced the crash. This provides the context you need to reproduce the error, saving time and guesswork. Once you’ve shipped a fix, you can scope your Error Tracking view to the new code version to see if the issue is still showing up.

Datadog emits an event each time Error Tracking creates a new issue. Using Datadog’s event monitors, you can alert on the first sighting of a new issue in a given environment or view path. This allows you to be informed as soon as a specific part of your app starts crashing, so you can ship a fix for impacted customers as quickly as possible.

Practice iOS crash safety
With Datadog’s iOS SDK, you can now use Datadog RUM and Error Tracking to easily track, triage, and debug application crashes in order to manage their impact on users and reduce churn. The new version of the RUM iOS SDK and included crash report symbolication CLI are now generally available—for more information on setting up your apps to forward crash reports to Datadog, see our documentation. Or, if you’re brand new to Datadog, get started with a 14-day free trial


