You may recall from Part 1 of this series that IIS exposes metrics in two principal ways:
- Performance counters: Performance counters for the IIS web service, along with those for Windows in general, can reveal metrics like the rate of requests per IIS site and the percentage of CPU utilization per worker process.
- Web service logs: Some metrics, like request latency and the frequency of each URI stem, are only available from HTTP request logs.
In this post, we’ll show you how to use built-in IIS monitoring tools to access and graph performance counters, configure logging in IIS, and query your logs with Microsoft’s Log Parser Studio. We’ll also explain how to use a diagnostic tool to investigate memory leaks and high CPU utilization in your application pools and worker processes.
Performance counters
In Windows, performance counters automatically collect data from a particular service, application, or driver, as well as from the operating system itself. In Part 1, we introduced some performance counter classes that are useful for monitoring the health and performance of IIS.
Performance counters report metrics from classes stored within a given IIS host, which makes it possible to query them with multiple techniques. We will show you how to collect IIS-related performance counters through PowerShell scripts, the Performance Monitor, and the IIS API. In particular, we’ll look at the performance counters we introduced in Part 1:
| Name in Performance Monitor | Full name |
|---|---|
| Web Service | Win32_PerfFormattedData_W3SVC_WebService |
| HTTP Service Request Queues | Win32_PerfFormattedData_Counters_HTTPServiceRequestQueues |
| W3SVC_W3WP | Win32_PerfFormattedData_W3SVCW3WPCounterProvider_W3SVCW3WP |
| Process | Win32_PerfFormattedData_PerfProc_Process |
Enabling the Web Service performance counter class
Before you can query IIS performance counters, you’ll need to make sure they’re enabled.
All of the performance counters you’ll need to monitor IIS should already be installed on your Windows system, with the exception of the Web Service class. Run the following PowerShell script to check for the Web Service class on your server host:
Get-WmiObject -List -Namespace root\cimv2 | select -Property name | where name -like "*Win32_PerfFormattedData_W3SVC*"
If the Web Service class is already installed, the output should include the following:
Name
----
Win32_PerfFormattedData_W3SVC_WebService
If it doesn’t, run the following command to install the class:
install-windowsfeature web-common-http
The performance counters will then collect data from different components of IIS, including your worker processes, HTTP.sys, and the IIS request queue. You can then query these performance counters in a number of ways, which we’ll explain below.
Accessing performance counters via PowerShell
You can access performance counters programmatically by using various tools and libraries (such as packages for Python). In this section we’ll show you how to access WMI performance counters with PowerShell commands. PowerShell is well suited for ad-hoc checks, and it’s straightforward to include them in scripts or pipe their outputs into other commands.
To access the value of counters within a performance counter set, you can simply run a WMI query for that class. Enter the PowerShell command, Get-WmiObject, and assign the -Class option to the class of your choice. To see which classes are available to query, consult Microsoft’s list of WMI classes. For example, if you wanted to view all of the performance counters within the Web Service class (Win32_PerfFormattedData_W3SVC_WebService), you could run the following PowerShell command:
Get-WmiObject -Class Win32_PerfFormattedData_W3SVC_WebService
The output should resemble the following (as part of a much longer list).
__CLASS                                   : Win32_PerfFormattedData_W3SVC_WebService
__SUPERCLASS                              : Win32_PerfFormattedData
__RELPATH                                 : Win32_PerfFormattedData_W3SVC_WebService.Name="_Total"
__PROPERTY_COUNT                          : 95
__DERIVATION                              : {Win32_PerfFormattedData, Win32_Perf, CIM_StatisticalInformation}
__SERVER                                  : EC2AMAZ-O31F7MR
AnonymousUsersPersec                      : 0
BytesReceivedPersec                       : 562
BytesSentPersec                           : 2480
TotalAllowedAsyncIORequests               : 0
TotalAnonymousUsers                       : 138
TotalBlockedAsyncIORequests               : 0
Totalblockedbandwidthbytes                : 0
TotalBytesReceived                        : 44466
TotalBytesSent                            : 1874900
TotalBytesTransferred                     : 1919366
Properties that begin with a double underscore represent system properties, which belong to all WMI classes. You’ll also see properties specific to the WMI class you’ve queried, such as BytesReceivedPersec and TotalBytesReceived for the Web Service class. Some counters report rates (e.g., BytesReceivedPersec), and others, like TotalBytesReceived, are cumulative totals, calculated from the last time the IIS server (rather than an individual site) was started. WMI includes a taxonomy of performance counter types, which you’ll find in the Microsoft documentation.
You can check the type of a given counter by running the following PowerShell commands:
$obj = Get-WmiObject <COUNTER_CLASS> -List
$obj.properties.Where{$_.Name -eq '<COUNTER_NAME>'}.Qualifiers.Where({$_.Name -eq "CookingType"})
In the output, the value of CookingType will be the type of the counter, which WMI uses to “cook” the counter into a formatted value. BytesSentPersec has a CookingType of PERF_COUNTER_BULK_COUNT, which takes an average over a user-defined sample interval. TotalBytesSent has a CookingType of PERF_COUNTER_LARGE_RAWCOUNT, the current value of the counter (which continues to increment until the server stops running).
If you’d like to query specific properties, or display the results in a specific format, you can pipe your query into the Format-List command. The example below shows how you can use the -Property option to specify the properties to query, listed in the order in which you’d like to view them:
Get-WmiObject -class Win32_PerfFormattedData_W3SVC_WebService | Format-List -Property Name, ServiceUptime, TotalGetRequests, TotalPutRequests, TotalBytesReceived, TotalBytesSent
The Format-List command outputs the value of each property of the WMI class on a separate line. The output should resemble the following (the value of Name is that of the instance of the counter, with _Total representing the sum for all instances):
Name                          : _Total
ServiceUptime                 : 667801
TotalGetRequests              : 27
TotalPutRequests              : 5
TotalBytesReceived            : 19873
TotalBytesSent                : 206196
Accessing performance counters via Windows Performance Monitor
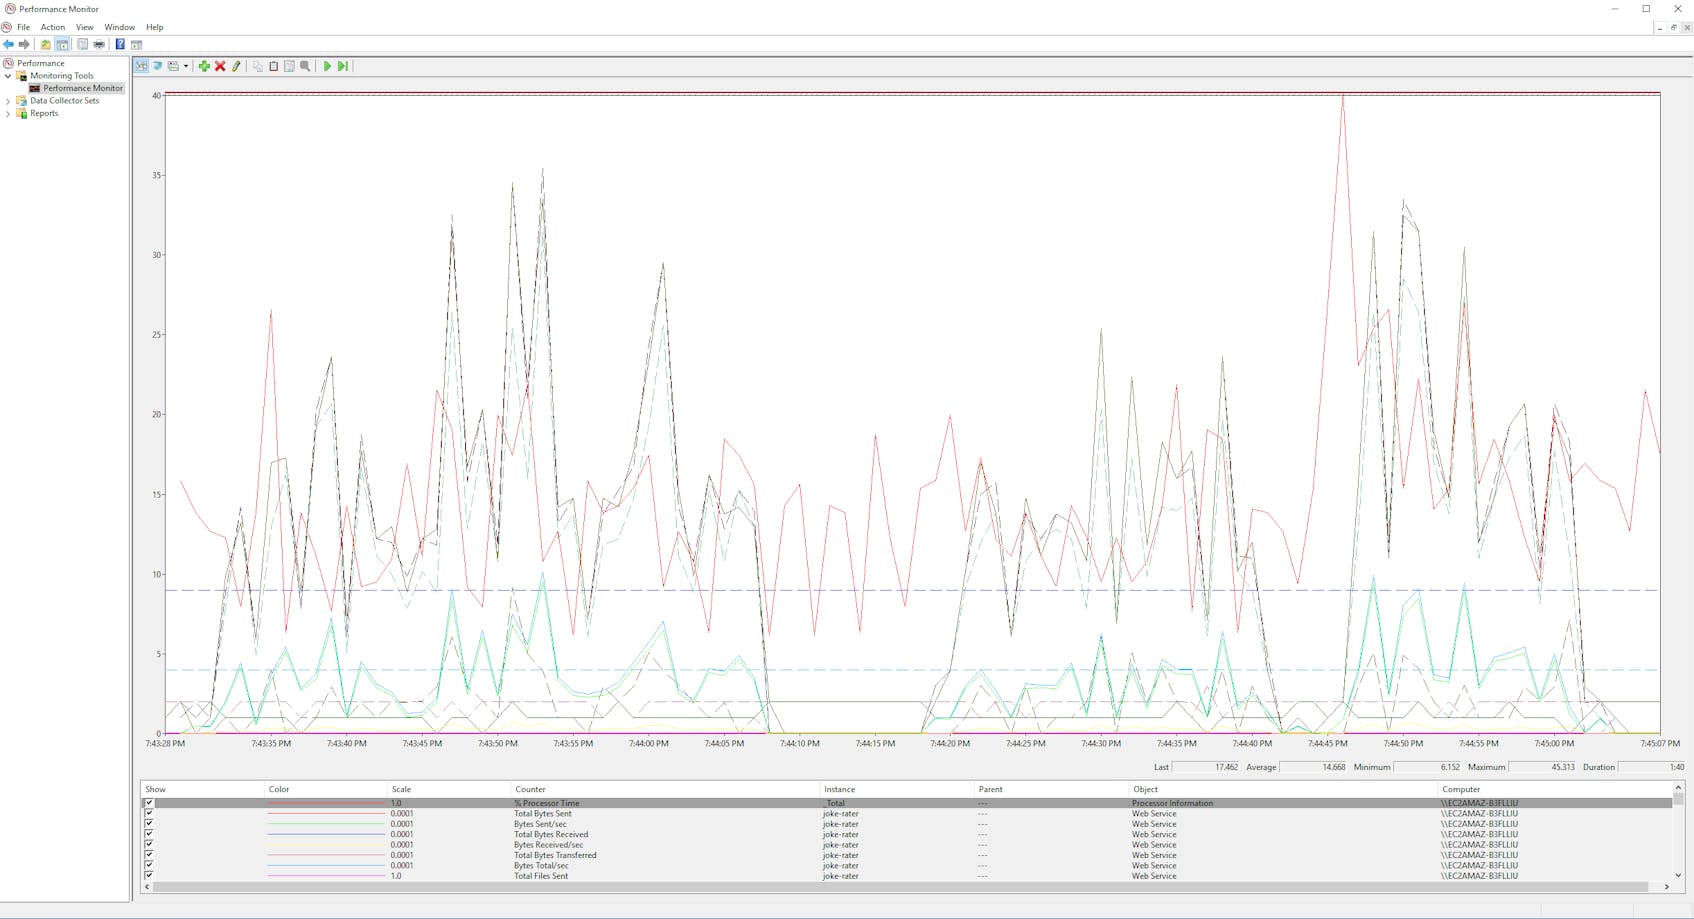
Performance Monitor ships with all versions of Windows since NT 3.51. You can use it as an IIS monitoring tool that provides a high-level view of performance counters, updated live, with timeseries graphs, histograms, and reports.
To start graphing IIS metrics within Performance Monitor, open the application from the Start menu. Next, choose which performance counters you’d like to plot. You’ll see a “Monitoring Tools” folder within a navigation tree. Click this folder, then click the “Add…” button in the toolbar, as shown in the screenshot below. You’ll find a menu of WMI classes and, when you click one, the performance counters it contains.
Each performance counter can have one or several instances (depending on what it tracks). For performance counters that track IIS worker processes, you’ll see one instance per process. For the Web Service class, there’s one instance per IIS site. You can choose to graph counters for one instance or all of them-in the example below, we’ve plotted all of the counters that correspond to a single instance, an IIS site.
Within the menu of performance counter classes, you’ll find most of the key metrics covered in Part 1 under the Web Service, Process, and Memory classes.
You can customize the default timeseries graph by clicking the “Properties” icon or entering Ctrl+Q. Options include the length of the y-axis, the coloration of lines within the graph, and the sample rate for each performance counter.
You can also choose to see your data in the form of a histogram or a textual report, by clicking Change graph type in the dropdown menu. The report is particularly useful if you’d like to see specific values for the counters you’ve selected, especially if the values have vastly different orders of magnitude that make them difficult to visualize within the same y-axis.
Accessing performance counters via the IIS Administration API
Starting with Windows 7, you also have the option to configure and monitor IIS with the IIS Administration REST API. The API is compatible with IIS 7.5 and above, and accesses a microservice that runs on your IIS host. And as an HTTP service, it lets you manage IIS from a variety of tools, from cURL scripts to Microsoft’s own web-based frontend, https://manage.iis.net. The API exposes endpoints for configuring application pools, sites, and other objects within IIS, and for our purposes, exposes three endpoints that report health and performance metrics:
- /api/webserver/monitoring
- /api/webserver/application-pools/monitoring
- /api/webserver/websites/monitoring
To set up the API, you’ll need to download and run the installer, and obtain an access token by visiting https://localhost:55539/security/tokens or generating one programmatically.
By default, the API microservice listens on port 55539, and you can change it through the command line just like you would with any other port (though not within IIS itself). You can also open the port to remote traffic by editing your firewall settings.
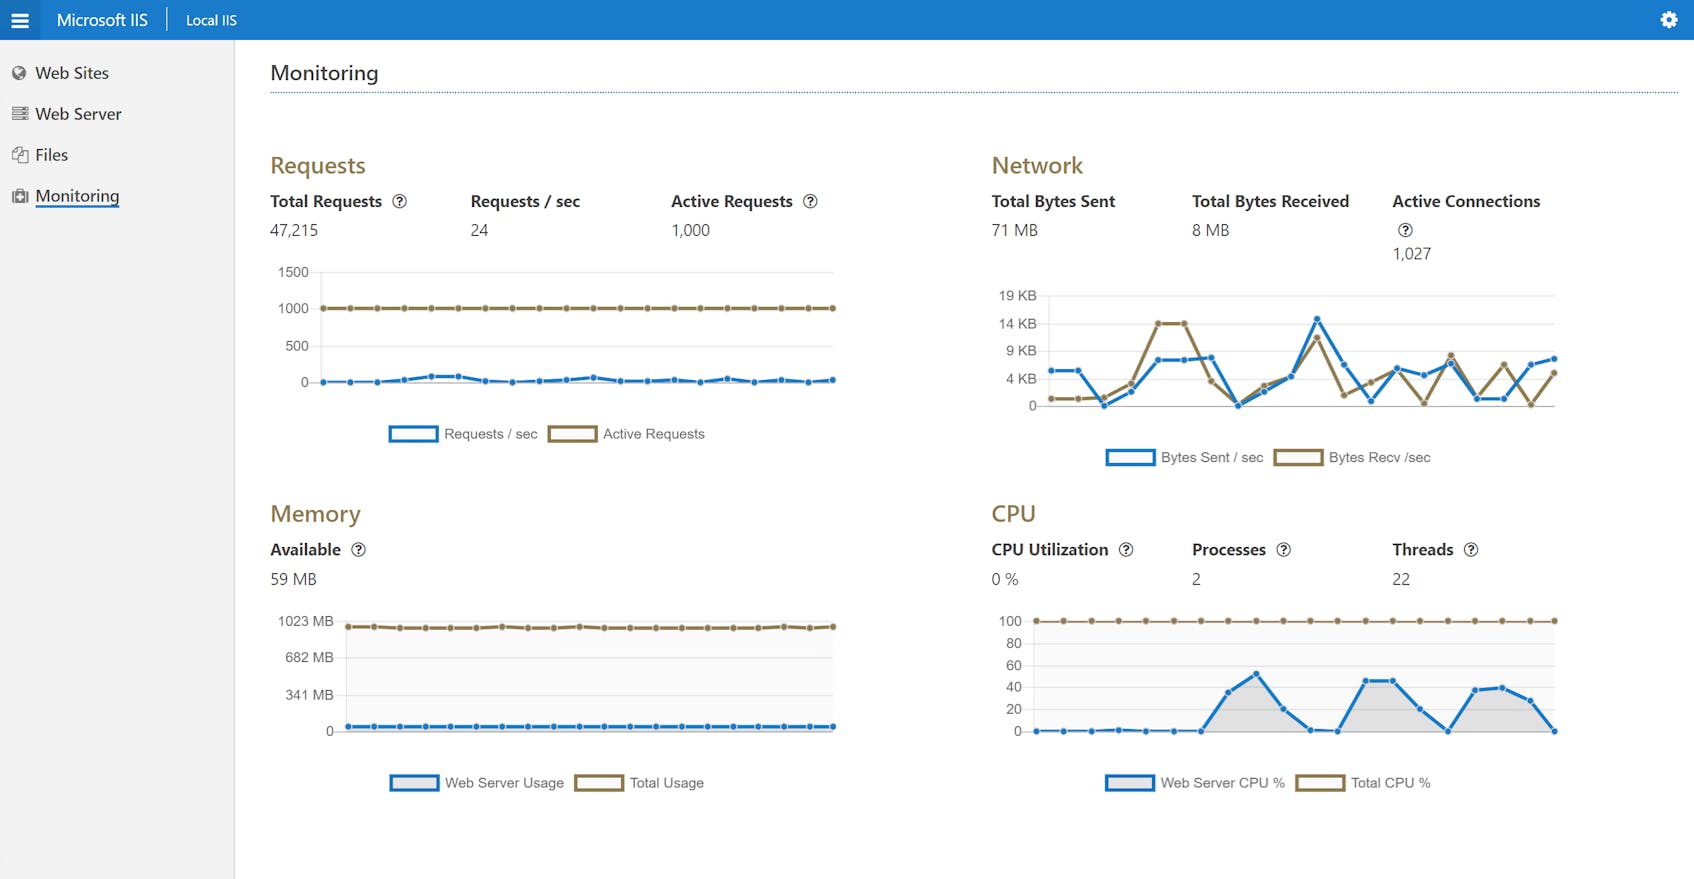
You can query data from the IIS Administration REST API in a few different ways. One approach is to use a browser-based graphical interface that displays a dashboard of timeseries graphs. You’ll see a range of high-level IIS metrics, including requests per second, available system memory, bytes sent and received per second, and CPU utilization. You can access the frontend by navigating to https://manage.iis.net/connect and entering your access token and the API server URL (by default, https://localhost:55539).
Like Performance Monitor, the API’s browser-based interface displays graphs that are updated in real time. Unlike Performance Monitor, you can graph each metric as a separate timeseries graph on the same dashboard, which makes it easier to correlate metrics even if they have vastly different y-axis scales. You won’t, however, get to choose which metrics to display.
You can also return metrics from the API as JSON, either by sending a GET request directly to one of the API endpoints reserved for monitoring or by using the browser-based API Explorer.
If you’re querying the API from the command line, you can take advantage of PowerShell’s Invoke-WebRequest command. In this example, we’ll use PowerShell to query the /api/webserver/monitoring endpoint for high-level metrics from the IIS instance.
Invoke-WebRequest -Headers @{"Access-Token"="Bearer <YOUR_ACCESS_TOKEN>"} -Method GET
https://localhost:55539/api/webserver/monitoring -UseDefaultCredentials | ConvertFrom-Json
There are several things to note for these requests. First, every request to the API must include a valid access token under the Access-Token header, beginning with the string, Bearer (note the space). In this example, we’ve used the -Headers option to specify headers. The argument for this option is a PowerShell dictionary. We’ve also specified the -Method, which must be GET, along with the URI for the API endpoint (https://localhost:55539/api/webserver/monitoring). We’ve included the switch, UseDefaultCredentials, which sends the current user’s credentials with the request-if you omit this, the API will return a 401 (Unauthorized) response.
Finally, we’re piping the output of Invoke-WebRequest into ConvertFrom-Json, a PowerShell command that converts the response of our GET request into JSON. If you don’t use ConvertFrom-Json, the response will show up as an incomplete value of a RawContent key.
Once you send the API request, you’ll see something similar to the following, with high-level statistics on network bytes sent, request throughput, resource usage, and more:
id       : FZto7FXp2gguv2OrOJuHhg
network  : @{bytes_sent_sec=0; bytes_recv_sec=0; connection_attempts_sec=0; total_bytes_sent=738972827; total_bytes_recv=17299959;
           total_connection_attempts=164314; current_connections=1}
requests : @{active=0; per_sec=0; total=164410}
memory   : @{handles=219; private_bytes=8314880; private_working_set=2736128; system_in_use=1009979392; installed=1073332224}
cpu      : @{threads=16; processes=2; percent_usage=0; system_percent_usage=100}
disk     : @{io_write_operations_sec=0; io_read_operations_sec=0; page_faults_sec=0}
cache    : @{file_cache_count=0; file_cache_memory_usage=0; file_cache_hits=0; file_cache_misses=6; total_files_cached=0; output_cache_count=0;
           output_cache_memory_usage=0; output_cache_hits=0; output_cache_misses=164410; uri_cache_count=1; uri_cache_hits=164331;
           uri_cache_misses=79; total_uris_cached=28}
The IIS Administration API also exposes endpoints that give you access to statistics from specific application pools and websites. You can obtain statistics about your application pools by querying the following endpoint: /api/webserver/application-pools/monitoring. To fetch metrics about your IIS sites, you’d query the endpoint, /api/webserver/websites/monitoring.
For manual querying, you might find it easier to use the API Explorer, a browser-based GUI that makes API calls with information that you submit through an HTML form. The API Explorer is available at the root of the IIS Administration microservice, https://localhost:55539. One advantage of using the API Explorer is that you don’t need to include credentials or define headers-all you need to do is enter the URI of the endpoint.
In the example below, we’ve queried the /monitoring endpoint to obtain data about our IIS instance as a whole, including metrics related to network connections, requests, memory, CPU, disk, and the IIS cache. The UI includes an input box for the API endpoint and a menu of HTTP methods.
When you submit a request, the API Explorer will display output similar to the following:
{
    "id": "GnyZVZsOxXqYBtxvJzO6dQ",
    "network": {
        "bytes_sent_sec": "5837",
        "bytes_recv_sec": "7094",
        "connection_attempts_sec": "36",
        "total_bytes_sent": "68784171",
        "total_bytes_recv": "8137036",
        "total_connection_attempts": "40920",
        "current_connections": "260"
    },
    "requests": {
        "active": "382",
        "per_sec": "36",
        "total": "40922"
    },
    "memory": {
        "handles": "205",
        "private_bytes": "15372288",
        "private_working_set": "10625024",
        "system_in_use": "926236672",
        "installed": "1073332224"
    },
    "cpu": {
        "threads": "17",
        "processes": "2",
        "percent_usage": "0",
        "system_percent_usage": "100"
    },
    "disk": {
        "io_write_operations_sec": "9",
        "io_read_operations_sec": "9",
        "page_faults_sec": "173"
    },
    "cache": {
        "file_cache_count": "1",
        "file_cache_memory_usage": "1208",
        "file_cache_hits": "7427",
        "file_cache_misses": "28",
        "total_files_cached": "27",
        "output_cache_count": "0",
        "output_cache_memory_usage": "0",
        "output_cache_hits": "0",
        "output_cache_misses": "40814",
        "uri_cache_count": "4",
        "uri_cache_hits": "40372",
        "uri_cache_misses": "442",
        "total_uris_cached": "215"
    },
    "_links": {
        "self": {
            "href": "/api/webserver/monitoring/GnyZVZsOxXqYBtxvJzO6dQ"
        }
    }
}
Web service logs
Logs are the only source of some of the key metrics covered in Part 1, including the time taken to service requests, and counts and rates of HTTP 4xx and 5xx responses. You can configure the format your logs will follow and the fields your logs will include. You can then extract aggregates by querying your log files with a tool like Log Parser Studio or with a dedicated log management service.
Configuring web service logs
Logging in IIS is enabled by default. You can check to see if it’s enabled, and enable logging if it’s not, by opening IIS Manager and navigating to the name of an IIS instance you’d like to log information about (as shown in the video below). In the list of options that follows, double-click the Logging icon. You’ll see a sidebar on the right, titled “Actions.” Click “Enable.” You can then select a format for your logs, and indicate which fields to log, including several of the metrics we introduced in Part 1.
You can configure IIS to output logs in one of several standard formats: W3C Extended, IIS, NCSA, ODBC, and Centralized Binary. Of these, only the W3C Extended format (the default) lets you customize the fields you’ll log, including those discussed in Part 1. The following is an example of an IIS log entry that follows the W3C Extended format. The list of #Fields appears as the fourth line of the log file, and below that, IIS will create a new log entry for every incoming request.
#Fields: date time s-ip cs-method cs-uri-stem cs-uri-query s-port cs-username c-ip cs(User-Agent) cs(Referer) sc-status sc-substatus time-taken
2018-03-14 17:00:37 172.31.3.237 GET / - 80 - 172.31.3.237 Mozilla/5.0+(Windows+NT+10.0;+Win64;+x64)+AppleWebKit/537.36+(KHTML,+like+Gecko)+Chrome/65.0.3325.146+Safari/537.36 - 200 0 78
This particular log entry contains the following fields:
| Field | Description |
|---|---|
date | Date of the request |
time | Time of the request |
s-ip | Server IP address |
cs-method | HTTP request method |
cs-uri-stem | URI stem |
cs-uri-query | Query string |
s-port | Server port |
cs-username | Client username |
c-ip | Client IP |
cs(User-Agent) | User agent |
cs(Referer) | Referer |
sc-status | Status of the request |
sc-substatus | Substatus of the request |
time-taken | Duration of the request, in milliseconds |
You can find a key for all of the W3C Extended logging fields in Microsoft’s documentation.
Querying web service logs
After you’ve configured IIS to generate logs, you’ll need a way to gather metrics from them. Log Parser Studio is a Microsoft tool that lets you query IIS logs with commands that resemble SQL.
In order to use Log Parser Studio, you’ll need to install Log Parser by following the instructions. Once you’ve done this, install Log Parser Studio and open it.
Within Log Parser Studio, choose the location of the log files you’d like to analyze, and click the “Create a new query” button. You’ll see a text field at the bottom of the screen. Above the text field, make sure the “Log Type” matches the format of the files you’d like to query. If you’re using the W3C Extended log format, select “IISW3CLOG.”
You can send queries in Log Parser Studio as SQL SELECT statements. There are several important variations on the SQL standard. First, the argument of a FROM clause is the absolute path of a given log file, rather than the name of a table. To find the location of your log files, enter IIS Manager, return to the Logging view where you enabled logging earlier, and within the “Actions” sidebar, click “View Log Files.”
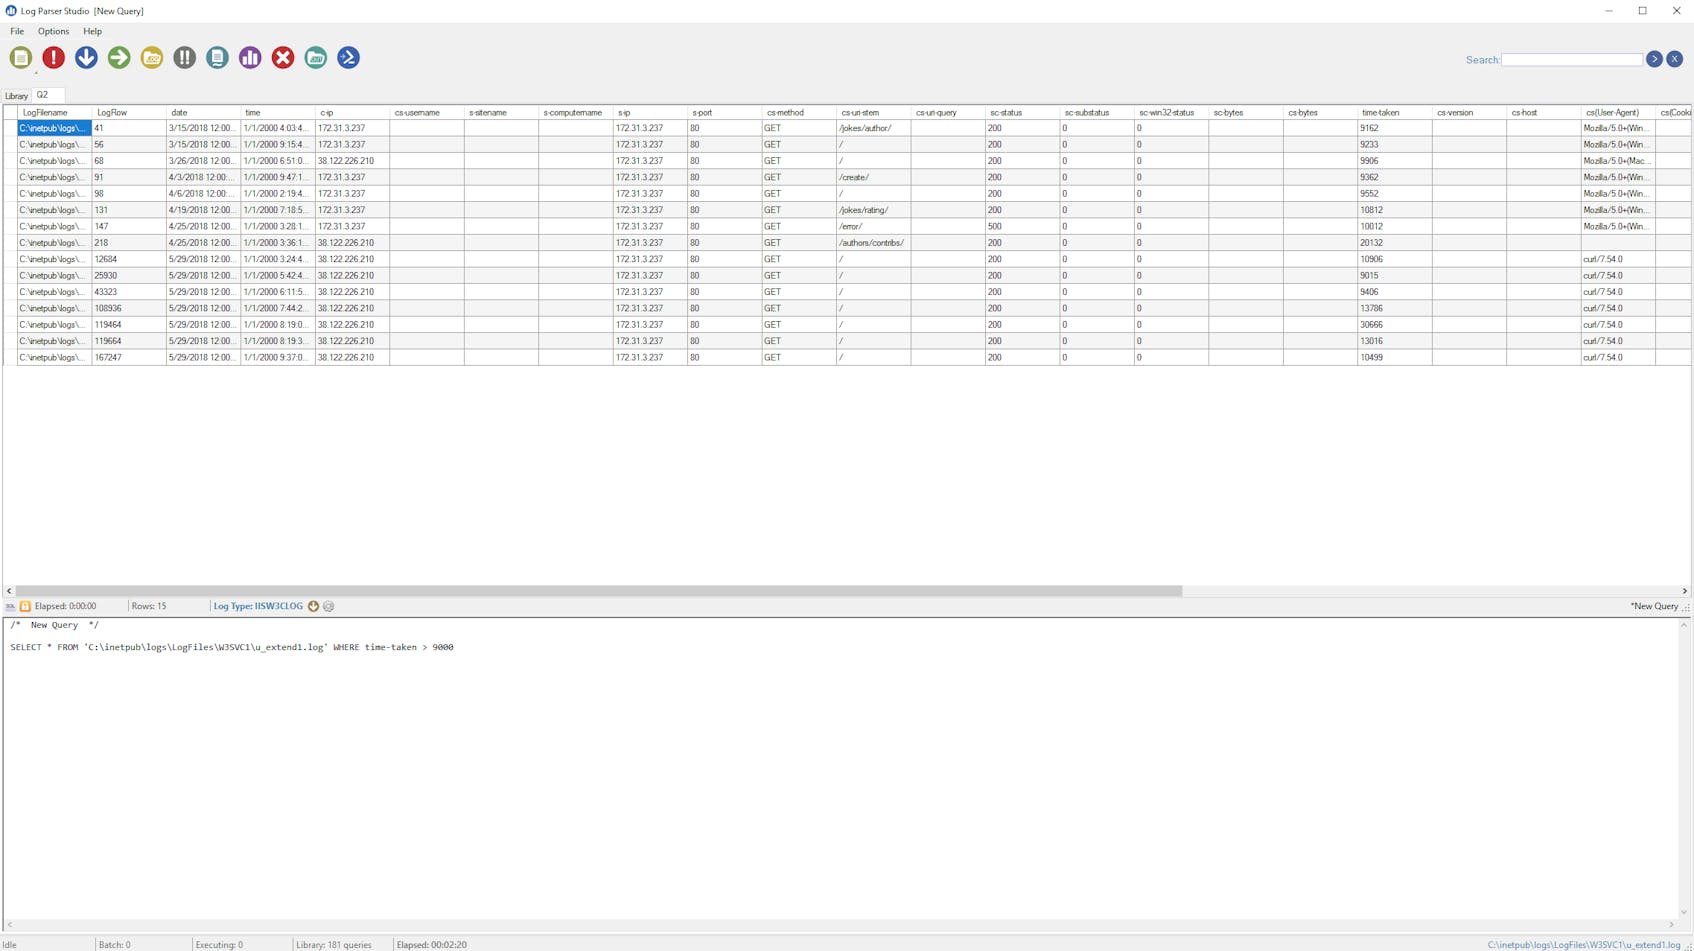
Second, the arguments of a WHERE clause will be the names of fields within the log file you’d like to query, rather than the names of columns in a table. If you’re querying a log file that uses the W3C format, you can see a list of fields within the file on the fourth line, under #Fields. In the example below, we are querying one log file for all requests that have taken longer than nine seconds to complete.
SELECT * FROM 'C:\inetpub\logs\LogFiles\W3SVC1\u_extend1.log' WHERE time-taken > 9000
You’ll see the results in the form of a table. This query returns one line per request.
You can also aggregate data by using GROUP BY clauses. The example below shows how you can query the average time-taken, aggregated by URI stem:
SELECT
  cs-uri-stem as URIStem,
  AVG(time-taken) as TimeTaken
FROM 'C:\inetpub\logs\LogFiles\W3SVC1\u_extend1.log'
GROUP BY URIStem
If we determine from this query that HTTP requests to one URI stem tend to take much longer than the others, we can drill into the logs for that stem to see if any particular HTTP method is to blame. Let’s say that we notice that requests to /create, a URI stem in our demo application, have taken an average of 1,550 milliseconds to complete. GET requests to this stem retrieve a web form, while POST requests need to access the database. Based on this information, we suspect that POST requests take longer, and we can test our hypothesis by querying the average time-taken of each request, grouped by HTTP request method:
SELECT
  cs-method as Method,
  AVG(time-taken) as TimeTaken
FROM 'C:\inetpub\logs\LogFiles\W3SVC1\u_extend1.log'
WHERE cs-uri-stem = '/create'
GROUP BY Method
The output will be a table resembling the following.
| Method | TimeTaken |
|---|---|
| GET | 2,109 |
| POST | 295 |
We find that, in fact, GET requests to /create have taken an average of 2,109 milliseconds, while POST requests have taken an average of only 295 milliseconds. Analyzing information from the logs helps us determine which aspects of our site we can optimize to improve request latency. If we want to speed up the GET requests to this endpoint, we can try reducing the size of the resources on that page (e.g., a large video file).
DebugDiag
The Debug Diagnostic Tool (DebugDiag) is a Windows application that analyzes memory dumps and integrates with IIS. You can write the contents of a process’s memory to a .dmp file, then process the file to generate a report. DebugDiag can perform stack traces to suss out memory leaks and high CPU utilization within user-mode processes, making it well-suited for debugging IIS applications. If you’ve encountered a performance issue in an IIS application pool, you can use DebugDiag to investigate further by inspecting comprehensive traces of your application.
To start using DebugDiag, download the installer and finish the installation wizard. While this example uses IIS 10.0, the setup process for previous versions of IIS may differ.
You’ll want to adjust your IIS configuration settings so that any unhealthy application pools will remain in your system long enough for you to create a memory dump. In IIS 6.0+, this means turning off worker process recycling and keeping your worker processes from shutting down when idle. Since running unhealthy workers is not an optimal configuration for a production server, you’ll probably want to use DebugDiag only when debugging memory leaks or high CPU utilization outside of production.
You can configure DebugDiag to automatically create a memory dump every time a performance counter exceeds a threshold, whenever an application pool crashes or there’s unusually high memory use in a certain process, or based on slow response times for HTTP requests. For each of these types of rules, the configuration is similar. Open “DebugDiag 2 Collection” from the Start menu, and specify the type of rule to add. Rules related to performance counters and HTTP response times fall within the Performance category.
You can create a Performance rule by specifying a threshold, which is either the value of a performance counter or the duration of an HTTP request to a certain URI. Then specify a dump target, the running tasks you’d like to analyze. This can be a process whose memory you want to write to disk (e.g., an instance of the worker process, w3wp.exe) or an IIS application pool, among other options (e.g., an NT Service or an executable). DebugDiag lets you select an IIS application pool by name, rather than having to find the pool’s w3wp.exe processes manually.
The video below is an example of creating a rule based on the value of a performance counter. The rule triggers a memory dump when the % Processor Time counter exceeds 90 percent for 10 seconds. We are specifying the joke-rater application pool as the dump target.
Once DebugDiag has created a memory dump, you can analyze it to collect metrics and traces. Open “DebugDiag 2 Analysis” from the Start menu. You’ll find a gallery of analytical rules (e.g., “Memory Pressure Analyzers,” “Performance Analyzers,” and “Default Analysis” for crashes and hangs), each of which will include its own information within a final report.
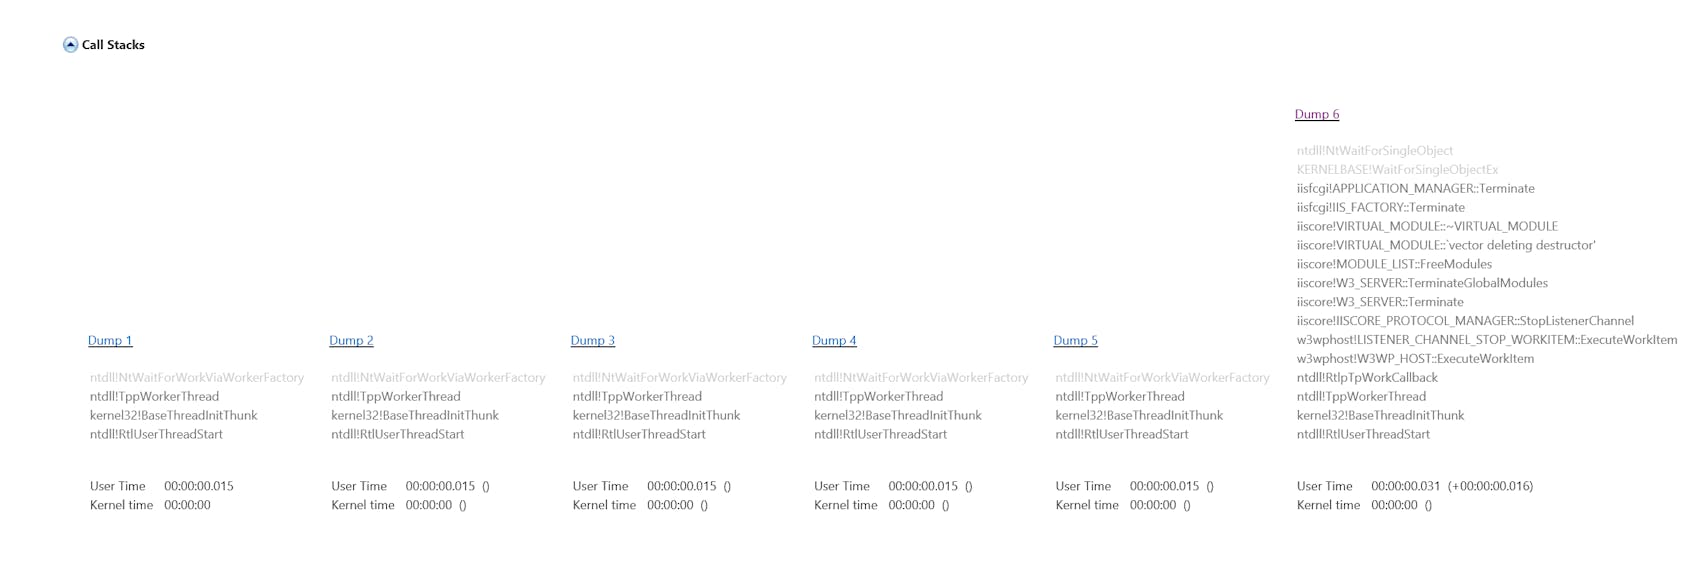
In the example below, we’ve chosen the “Performance Analyzers” rule, which traces function calls within the dump file and measures the CPU time for each. You can use this rule to help determine the source of high CPU utilization in your application. Click “Add Data Files” and select the dump files that you’d like to analyze. After the analysis is complete, you should see a report in your browser, similar to the screenshot below.
The report displays a call stack for the threads within each memory dump, as well as a summary of the CPU time each call stack spent. You can then see whether any periods of high CPU utilization correspond with any particular call stack. When you see high CPU utilization on your IIS server, you can use DebugDiag to help find out which modules or functions may be responsible.
Automate your IIS monitoring
Examining IIS performance counters and log entries allows you to glean information about specific requests and perform spot checks on your server’s performance. However, using multiple IIS monitoring tools to query log entries and pull data from each individual performance counter becomes onerous at scale. In order to automate your IIS monitoring-and gain access to extensive visualizations and log analysis for IIS and the rest of your stack-you’ll need a more comprehensive solution.
Datadog’s IIS integration collects metrics and logs from your servers, so you can start gaining insights in minutes. And since Datadog integrates with more than 850 other technologies, you can monitor every component of your infrastructure and applications in one place. We’ll show you how to start using Datadog to monitor IIS in Part 3.
Source Markdown for this post is available on GitHub. Questions, corrections, additions, etc.? Please let us know.


