

Chas DeVeas
Engineering Manager

Aaron Silverman
Engineering Manager

Tyler Buffington
Senior Software Engineer

Jonathan Fulton
Staff Software Engineer

Taylor Overturf
Technical Content Writer
When Datadog acquires a company, we usually rebuild the product rather than plugging it in as is. That’s exactly what we did with Eppo, an experimentation and feature-management platform. Eppo’s feature-management capabilities became Datadog Feature Flags, while experimentation became Datadog Experiments. This post focuses on the experimentation platform and four changes we made to help you get to a decision faster.
Datadog Experiments lets you analyze randomized experiments, or A/B tests, alongside observability data to understand how releases affect business outcomes, user behavior, and application performance. While warehouse-native metrics often act as the primary basis for decision making, you can also leverage Real User Monitoring (RUM) or Product Analytics as part of your experiment metrics.
We focused the Experiments rebuild on helping you move from an experiment result to a confident decision more quickly, with statistical efficiency, interpretable impact, verifiability, and faster feedback. In this post, we’ll cover key features of Experiments, including how we:
How we extended CUPED to segments and percentiles
CUPED (Controlled-experiment Using Pre-Experiment Data) uses information about each subject from before an experiment to reduce metric variance, which tightens confidence intervals. The result is faster experiment conclusions with smaller sample sizes.
At Eppo, we implemented CUPED as a regression adjustment with a separate subject-level model for each variant. The resulting lift estimate was unbiased only for the population used to fit those models. This made it impractical to extend CUPED to segments, since each segment would need its own refitted model.
Apply CUPED consistently across segments
For Experiments, we built a more flexible CUPED model inspired by CUPED’s original authors, who describe the method as a metric augmentation rather than a regression adjustment. You start from the unadjusted lift and add adjustment terms chosen to average out to zero over many randomizations. Because those terms are zero in expectation, the adjustments add no bias, but can reduce variance.
A single set of coefficients gives zero-expectation adjustments for any segment. So a single model run, reusing the same global coefficients, now enables unbiased, CUPED-adjusted results for any segment. In practice, this generally reduces variance, and it also keeps segment results consistent with the overall result.
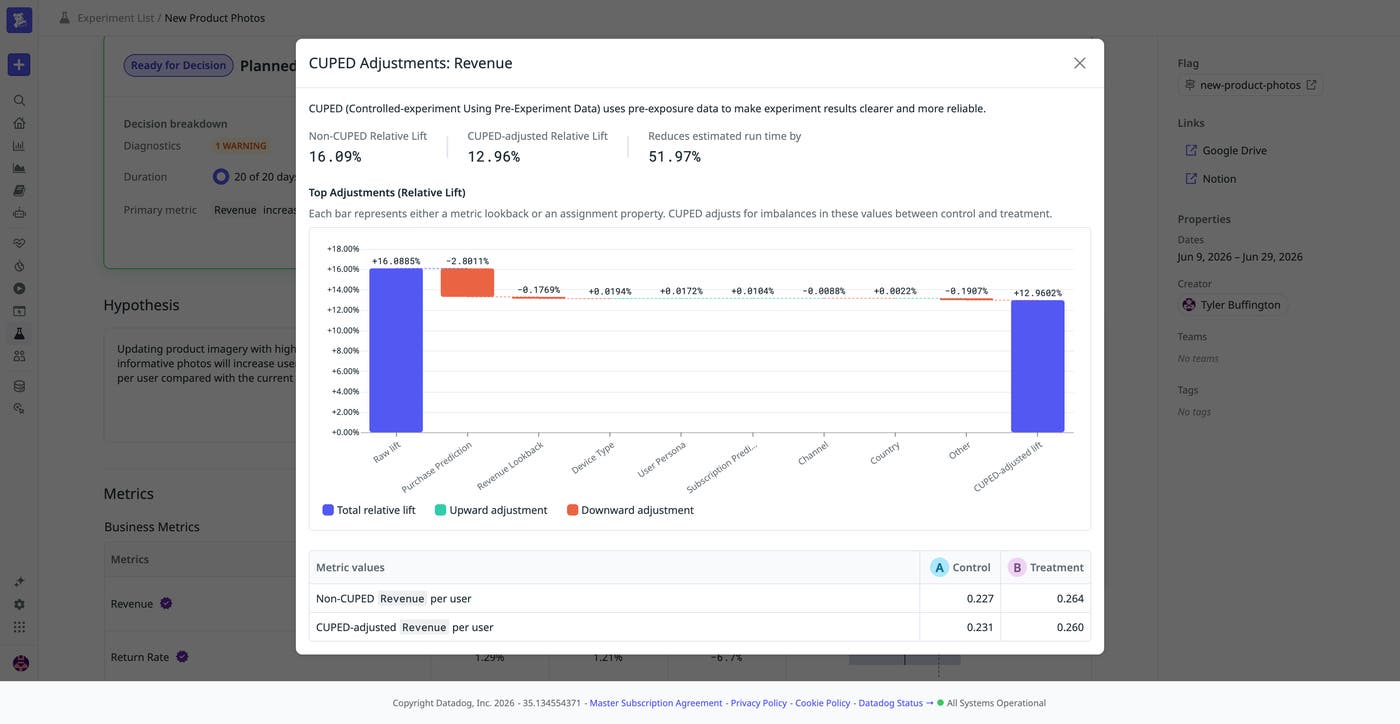
The waterfall view above starts from the raw lift and applies each adjustment term to arrive at the CUPED-adjusted lift. In the example experiment, that variance reduction shortened the estimated run time by about 52%.
Extend variance reduction to percentile metrics
The metrics that best capture application performance are often percentiles. Variance reduction on percentiles has long been out of reach for commercial experimentation platforms. The standard, regression-based implementation of CUPED does not naturally extend to percentile metrics, because there is not an obvious subject-level outcome to predict. But augmentation removes that limit.
We take the ordinary p90 and add adjustment terms like we would for any other metric. A p90 page load time can now help inform an experiment or guard a rollout on less traffic than an unadjusted percentile would need. Because CUPED now extends to percentiles, a change that causes a latency spike can be caught sooner and rolled back faster.
How we rebuilt global lift around coverage
Global lift estimates how an experiment’s result would change your company-wide metric total if you rolled the treatment out to every eligible user. One approach would be to apply the experiment’s relative lift to your company-wide total, but that assumes every user in that total is affected by the change. If only a fraction are, the full relative lift overstates the effect. Global lift accounts for that gap. It depends on local lift, the relative lift among enrolled subjects, and coverage, the share of your company-wide metric total that the experiment’s eligible users account for.
At Eppo, we calculated global lift and coverage separately and reported both. The two weren’t designed to combine, and there was no clear relationship between them. Multiplying coverage by local lift wouldn’t reproduce the reported global lift. Global lift also didn’t extend to windowed metrics. Getting a global lift number for a windowed metric meant building a second, unwindowed version, which might have a different local lift. Global lift then came from that second metric’s lift, not the metric you were evaluating.
For Datadog Experiments, we rebuilt global lift as the product of two factors (local lift and coverage) you can read on their own: Global lift = Coverage × Local lift.
Say an experiment’s eligible users make up half your revenue. Coverage is 50%. Multiply that 50% coverage by a 10% local lift on revenue, and you get a 5% global lift. Every global lift number comes from multiplying coverage by local lift, so you can always check it yourself.
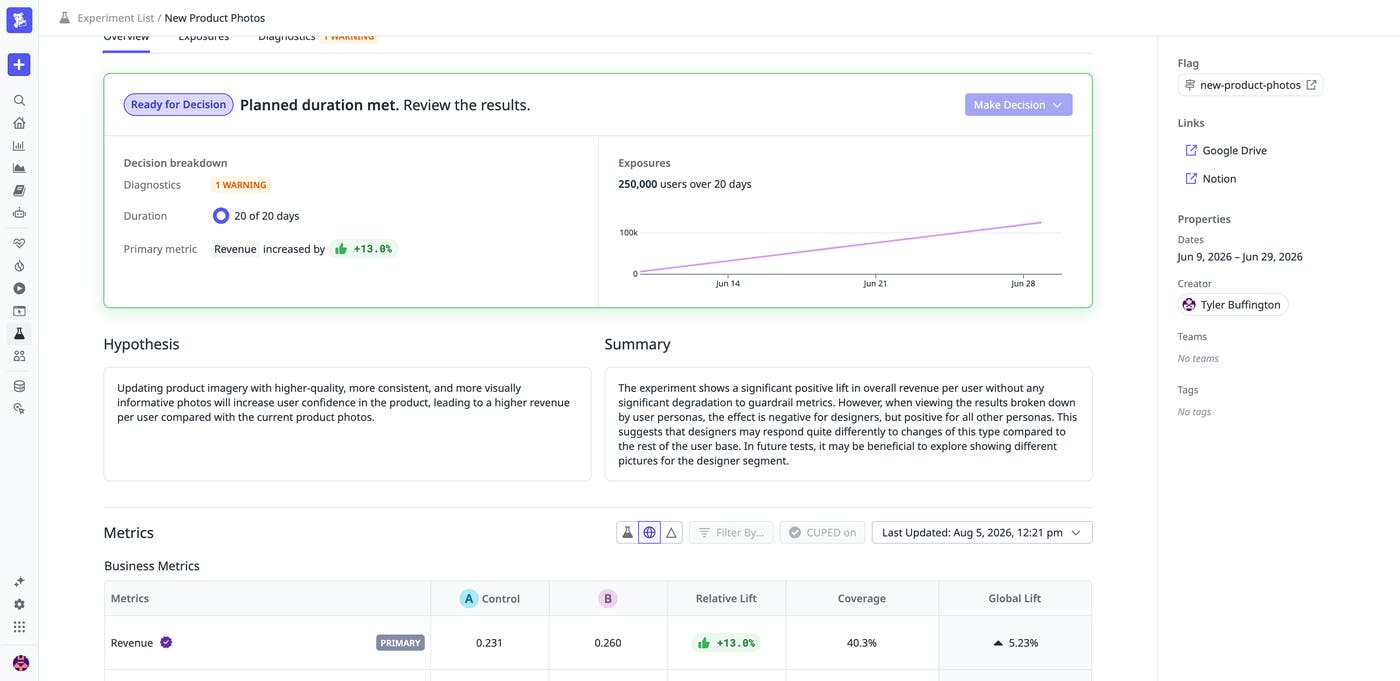
The metrics table above shows relative lift, coverage, and global lift as separate columns, with a 13.0% relative lift and 40.3% coverage producing the 5.23% global lift.
Windowed metrics are often advantageous for decision making and impact reporting. Now you get both of these benefits in the Experiments platform. Global lift works for windowed metrics on Experiments because coverage is computed separately from global lift, rather than inside it. You no longer have to maintain a second metric to get global lift, or worry about two metrics that might have two different lifts.
How we made warehouse metrics easier to verify
At Eppo, about 20 pipeline steps sat between your raw tables and a reported result. Two things were hard to do with that pipeline: confirm a result was correct and diagnose one that looked wrong. To understand how the pipeline produced a particular number, an analyst had to handcraft queries to reproduce what it did. One assumption that differed from the pipeline’s was enough to produce discrepancies that were difficult to trace. So, an analyst would often send Eppo the query, and the Eppo team would help track down where its assumptions diverged from the pipeline’s.
For Datadog Experiments, we built Copy SQL to reduce that back-and-forth so you can verify your own results. For your warehouse-native metrics, you can copy the query behind a number and run it in your own warehouse to trace an unexpected result. A copied query lands very close to the dashboard number, though because the pipeline is incremental, late-arriving data can cause small differences.
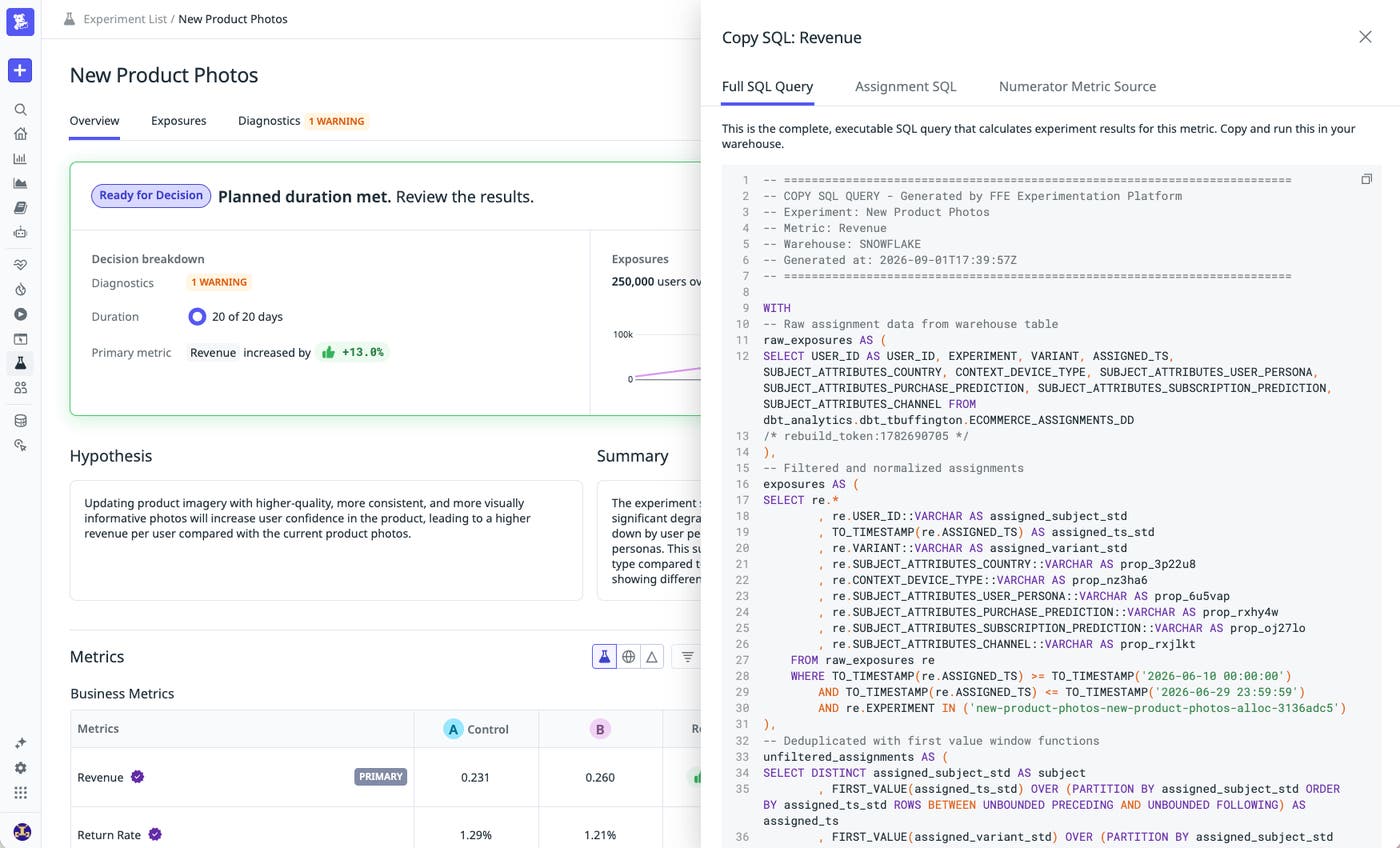
The example above shows the full query behind the revenue metric, with the pipeline’s steps as named stages. It is also important to note that Copy SQL reproduces results for metrics without CUPED adjustment. Separately, Experiments runs diagnostic checks before you interpret results, flagging issues like a traffic imbalance between variants or a metric with no data.
How we added behavioral and performance metrics to experiments
At Eppo, experiments read data from the warehouse and reported results on a schedule. The business metrics that decide whether you ship a change, like revenue or retention, can land hours later. Early in a test, you want to know the change hasn’t broken something before those warehouse metrics arrive.
In Experiments, you can now build metrics from Real User Monitoring (RUM) and Product Analytics data. These capture how users behave and how your app performs, including pageviews, clicks, and errors, across web and mobile.
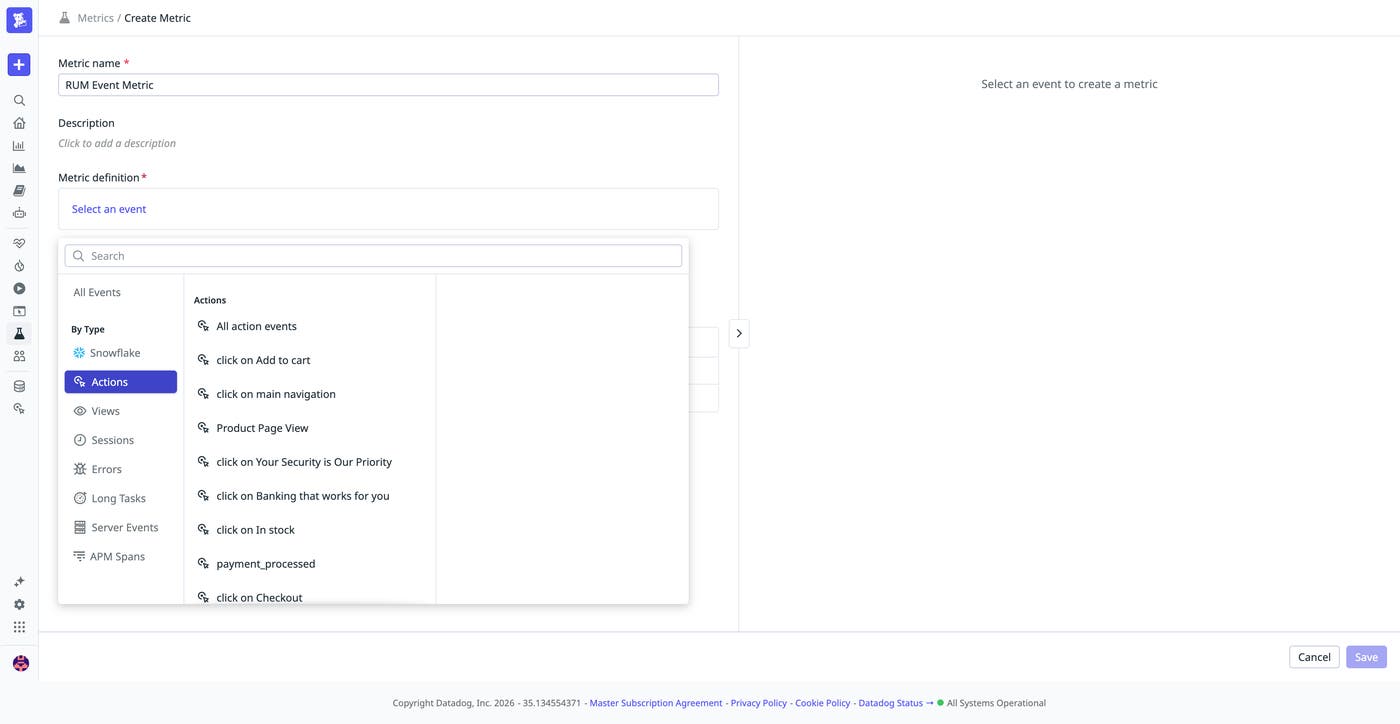
For example, the metric builder above lets you pick a RUM or Product Analytics event, like a checkout click or a product pageview, as the basis for an experiment metric. You can also build metrics from APM Spans, now in Preview. RUM and Product Analytics metrics update in near real time (typically about every 15 minutes), without any separate streaming infrastructure. Now you can see early behavioral and performance signals while your warehouse metrics are still landing. Your warehouse metrics stay as they are. You get an additional, early signal on whether a change may be degrading behavior or performance, so you can act sooner.
Within minutes of your experiment launching, you can also watch full Session Replays from the first users exposed to it. Confidence intervals will still be wide at this stage, but qualitative signals from Session Replay show how your new variant is behaving and how users are interacting with it.
Get started with Datadog Experiments
With Datadog Experiments, experiments conclude faster and their results are easier to trust. CUPED now extends to percentiles, so you can catch a latency spike sooner and roll it back faster. Global lift breaks into coverage and local lift, so you can check the math yourself. Copy SQL hands you the query to rerun in your own warehouse. Metrics from RUM and Product Analytics give you an early read on behavior and performance before your warehouse results are in. Together, these platform improvements can shorten the time from result to decision, and make it easier to verify results.
To learn more about Datadog Experiments, check out the documentation for how to plan and launch your first experiment.
If you’re not already a Datadog customer, sign up for a free 14-day trial.
