Evan Mouzakitis
This post is part 2 of a 3-part series on HAProxy monitoring. Part 1 evaluates the key metrics emitted by HAProxy, and Part 3 details how Datadog can help you monitor HAProxy.
Collecting the HAProxy metrics you need
Now that you know the key HAProxy metrics to monitor, it’s time to collect them! You can either use HAProxy’s built-in tools or a third-party tool. HAProxy gives you two means by which you can monitor its performance: via a status page, or via sockets. Both of the methods below give you an immediate and detailed view into the performance of your load balancer. The main difference between the two is that the status page is static and read-only, whereas the socket interface allows you to modify HAProxy’s configuration on the fly.
Stats page
The most common method to access HAProxy metrics is to enable the stats page, which you can then view with any web browser. This page is not enabled out of the box, and requires modification of HAProxy’s configuration to get it up and running.
Configuration
To enable the HAProxy stats page, add the following to the bottom of the file /etc/haproxy/haproxy.cfg (adding your own username and password to the final line):
listen stats # Define a listen section called "stats" bind :9000 # Listen on port 9000 mode http stats enable # Enable stats page stats hide-version # Hide HAProxy version stats realm Haproxy\ Statistics # Title text for popup window stats uri /haproxy_stats # Stats URI stats auth Username:Password # Authentication credentialsThis sets up a listener on port 9000 in HTTP mode with statistics enabled.
Next you’ll need to restart HAProxy, which can interrupt client sessions and cause downtime. If you want to be very careful about how you restart HAProxy, check out Yelp’s research on the least disruptive means by which you can reload HAProxy’s configuration.
If you’re comfortable with session interruption, you can restart HAProxy with
sudo service haproxy restart.
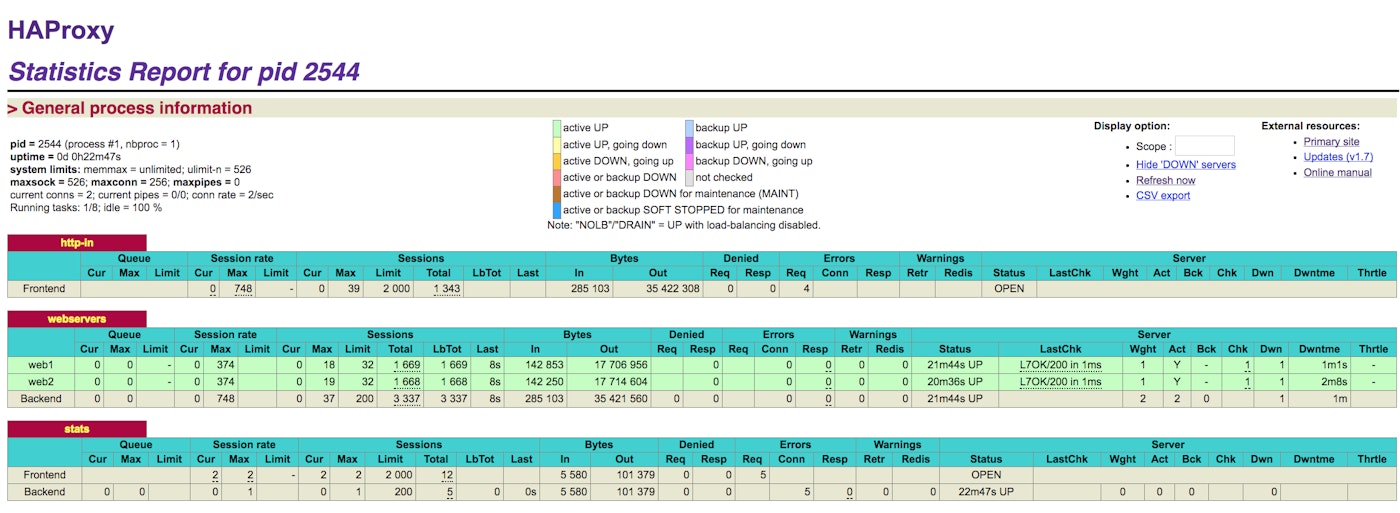
After restarting HAProxy with your modified configuration, you can access a stats page like the one below after authenticating via the URL: http://<YourHAProxyServer>:9000/haproxy_stats

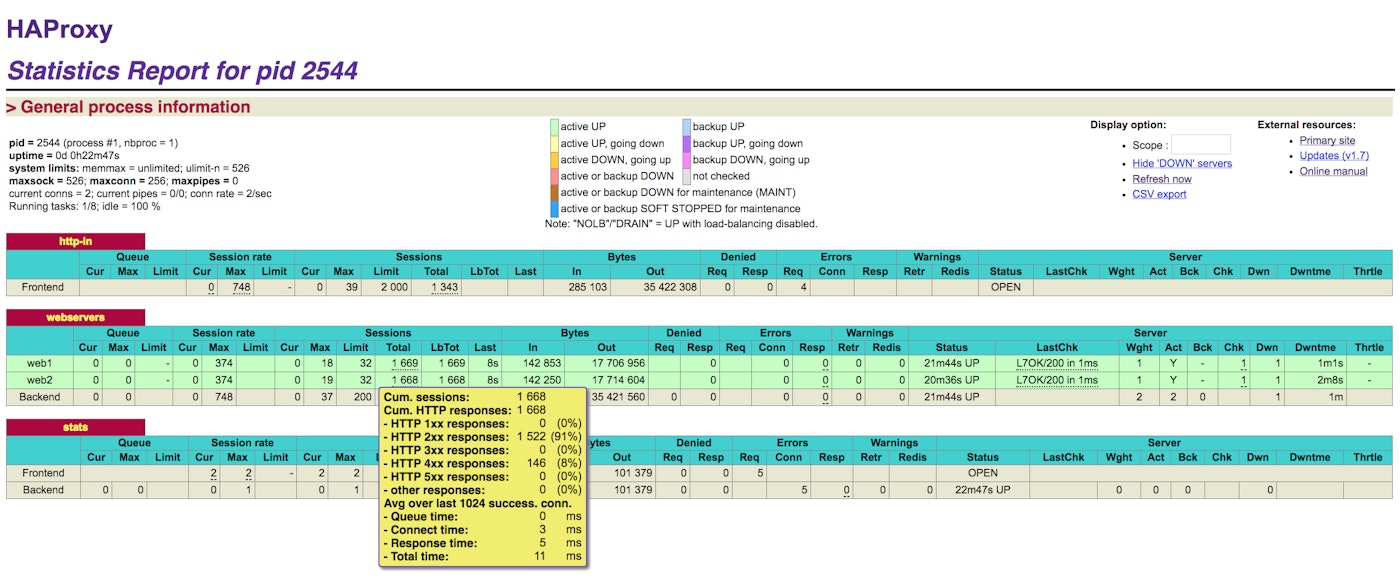
You can even mouse over some stats for more information, as seen in this screenshot:

If you prefer machine-readable output, you can choose to view the page as CSV output instead by appending ;csv to the end of your stats URL.
The stats page is great for a quick, human-readable view of HAProxy. However, there are a couple of downsides:
-static: the page must be refreshed to be updated
-ephemeral: old statistics are lost on each refresh
If you plan on scraping HAproxy’s metrics for a script or otherwise, communicating over the socket interface is a much more practical method.
Unix Socket Interface
The second way to access HAProxy metrics is via a Unix socket. There are a number of reasons you may prefer sockets to a web interface: security, easier automation, or the ability to modify HAProxy’s configuration on the fly. If you are not familiar with Unix interprocess communication, however, you may find the statistics page served over HTTP to be a more viable option.
Enabling HAProxy’s socket interface is similar to the HTTP interface—to start, open your HAProxy configuration file (typically located in /etc/haproxy/haproxy.cfg). Navigate to the global section and add the following lines:
global
stats socket /run/haproxy/haproxy.sock mode 660 level admin stats timeout 2m # Wait up to 2 minutes for inputAlthough only the stats socket line is necessary to open the socket, setting a timeout is useful if you plan on using the socket interactively. For the curious, the mode 660 level admin parameters tell HAProxy to set the permissions of the socket to allow only the owner and members of the owner's group to read and write to it (mode 660) with administrative privileges. Admin rights let you alter HAProxy’s configuration through the socket interface; without them the socket is essentially read-only.
Make sure that any user who needs to access the socket is assigned to the haproxy group:
gpasswd -a <user name> haproxySocket communication
Accessing HAProxy’s interface requires a means to communicate with the socket, and the popular netcat tool is perfect for the job. Most *NIX platforms have a version of nc either installed by default or available from your package manager of choice, but if not you can always compile from source.
Although the HAProxy’s official socket documentation recommends socat as the preferred socket client, during our tests we found that many popular versions of socat lack readline support (necessary for using the socket interactively). Using OpenBSD’s nc is just as easy and works out of the box.
HAProxy’s socket interface offers two modes of operation: interactive or non-interactive.
In non-interactive mode, you can send one string of commands to the socket before the connection closes. This is the most common method for automated monitoring tools and scripts to access HAProxy statistics. Sending multiple commands in this mode is supported by separating each command with a semicolon. In the examples to follow we will assume your HAProxy socket is located at /var/run/haproxy.sock.
The following command will return:
-information about the running HAProxy process (pid, uptime, etc)
-statistics on your frontend and backend (same data returned from your stats URI)
echo "show info;show stat" | nc -U /var/run/haproxy.sock
Interactive mode is a similar one-liner. Running:
nc -U /var/run/haproxy.sock connects to the socket and allows you to enter one command.
Entering the prompt command drops you into an interactive interface for the HAProxy socket.
$ nc -U /var/run/haproxy.sock$ prompt> show infoName: HAProxyVersion: 1.6.1Release_date: 2015/10/20Nbproc: 1Process_num: 1id: 6515Uptime: 0d 0h08m22sUptime_sec: 502Memmax_MB: 0Ulimit-n: 4030Maxsock: 4030Maxconn: 2000Hard_maxconn: 2000CurrConns: 0CumConns: 2CumReq: 2[...]Send an empty line or quit to exit the prompt.
For more information on the available socket commands, refer to the HAProxy documentation.
Show me the metrics!
Once you’ve enabled the socket interface, getting the metrics is a simple one-liner: echo "show stat" | nc -U /var/run/haproxy.sock
This command pipes the text “show stat” into the socket, producing the output below:
http-in,FRONTEND,,,0,85,2000,4655,380562,991165,0,0,14,,,,,OPEN,,,,,,,,,1,2,0,,,,0,0,0,3305,,,,0,0,0,14,4641,0,,0,3305,4655,,,0,0,0,0,,,,,,,,appname,lamp1,0,0,0,0,,0,0,0,,0,,0,0,0,0,DOWN,1,1,0,1,1,134,134,,1,3,1,,0,,2,0,,0,L4TOUT,,2002,0,0,0,0,0,0,0,,,,0,0,,,,,-1,,,0,0,0,0,appname,lamp2,0,0,0,0,,0,0,0,,0,,0,0,0,0,DOWN,1,1,0,1,1,133,133,,1,3,2,,0,,2,0,,0,L4TOUT,,2002,0,0,0,0,0,0,0,,,,0,0,,,,,-1,,,0,0,0,0,appname,BACKEND,0,0,0,77,200,4641,380562,988533,0,0,,4641,0,0,0,DOWN,0,0,0,,1,133,133,,1,3,0,,0,,1,0,,3292,,,,0,0,0,0,4641,0,,,,,0,0,0,0,0,0,-1,,,0,0,0,0,As you can see, if you want to access your HAProxy metrics in a human-readable format, the stats page is the way to go.
The output metrics are grouped by server. In the snippet above you can see four devices: http-in, a frontend; the backend appname; and the backend servers associated with appname, lamp1 and lamp2.
The metric names are abbreviated and some, if you have already read Part 1, should look familiar: qcur is the current queue size, bin is the number of bytes in, etc. You can find a full list of HAProxy metrics in the documentation.
Third party tools
There is no shortage of third party tools available in the HAProxy community, though many are unmaintained.
Luckily, there is HATop.

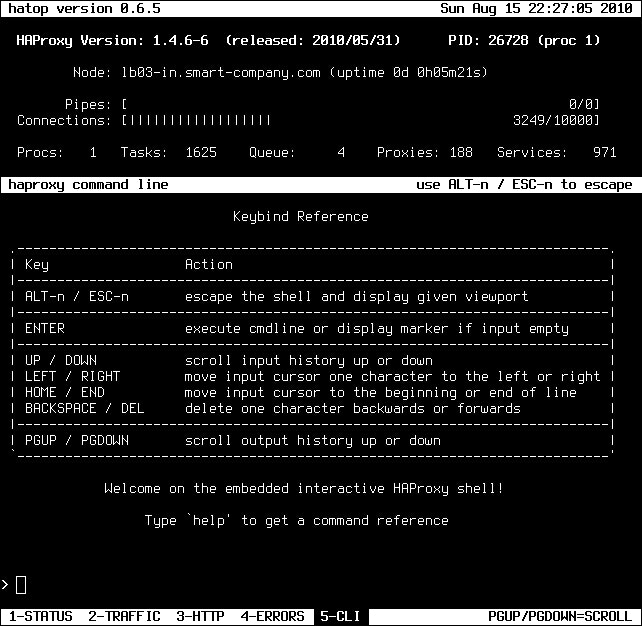
Though unpatched for over five years, HATop to this day remains the go-to tool for taking a closer look at a running HAProxy service. HATop was designed to mimic the appearance of htop. It is an excellent management and diagnostics tool capable of overseeing the entirety of your HAProxy service stack.
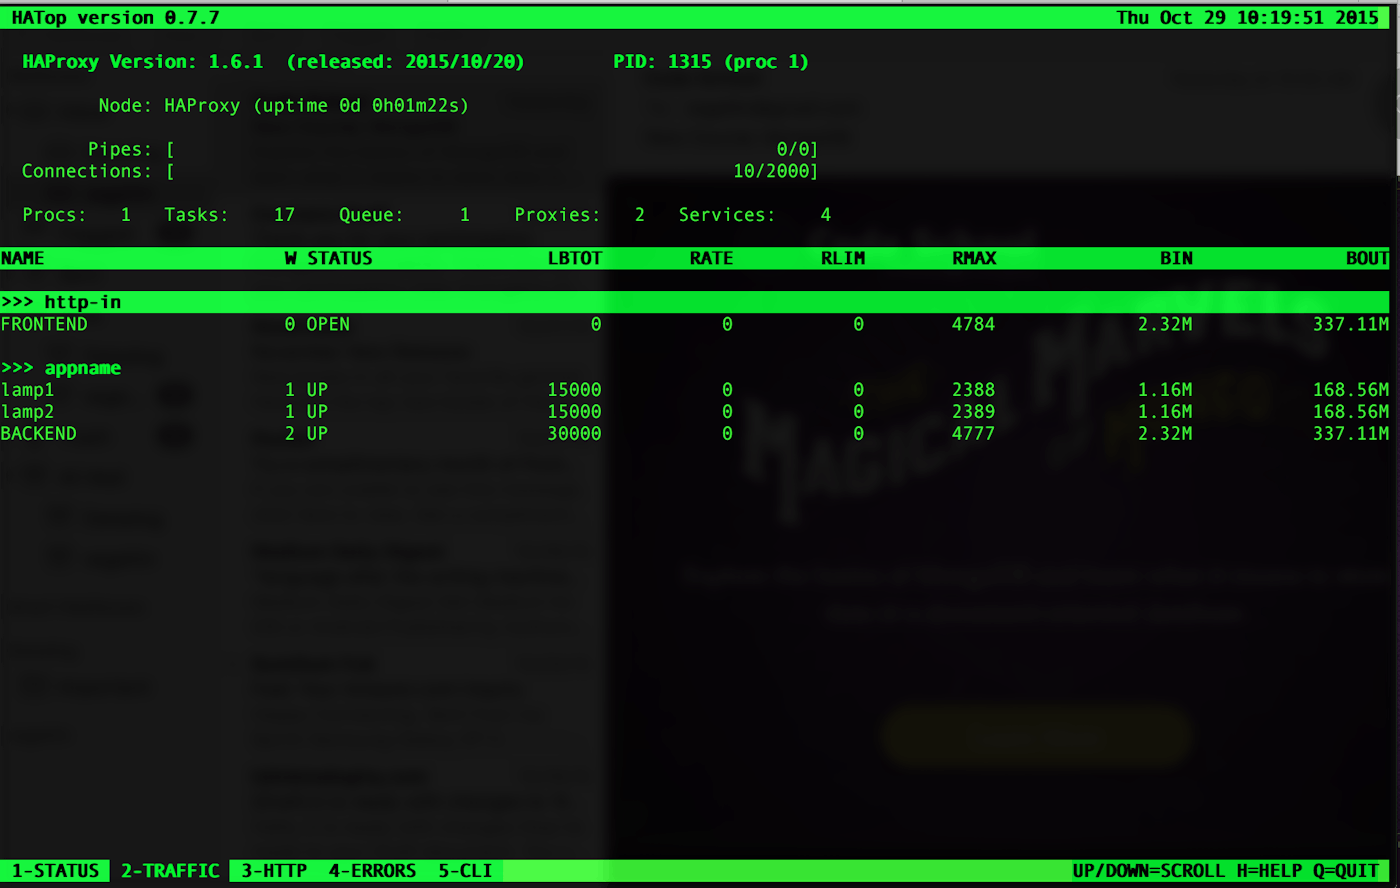
Once downloaded, start HATop with the following command (assuming HATop is in your PATH): hatop -s /var/run/haproxy.sock
You should see something similar to the screen below:

With a tool like HATop, you get human-readable metrics (updated in real time), along with the ability to perform common tasks, such as changing backend weights or placing servers into maintenance mode. The HATop documentation has details on what you can do with this useful tool.
Conclusion
HAProxy’s built-in tools provide a wealth of data on its performance and health. For spot checking your HAProxy setup, HAProxy’s tools are more than enough.
For monitoring systems in production, however, you will likely need a dedicated monitoring system that can collect and store your HAProxy metrics at high resolution, and that provides a simple interface for graphing and alerting on your metrics. At Datadog, we have built an integration with HAProxy so you can begin collecting and monitoring its metrics with a minimum of setup. Learn how Datadog can help you to monitor HAProxy in the next and final part of this series.
Source Markdown for this post is available on GitHub. Questions, corrections, additions, etc.? Please let us know.


