Jean-Mathieu Saponaro
This post is part 2 of a 3-part series on monitoring DynamoDB. Part 1 explores key DynamoDB metrics, and Part 3 describes the strategies Medium uses to monitor DynamoDB.
This section of the article is about collecting native DynamoDB metrics, which are available exclusively from AWS via CloudWatch. For other non-native metrics, see Part 3.
CloudWatch metrics can be accessed in three different ways:
- Using the AWS Management Console and its web interface
- Using the command-line interface (CLI)
- Using a monitoring tool integrating the CloudWatch API
Using the AWS Management Console
Using the online management console is the simplest way to monitor DynamoDB metrics with CloudWatch. It allows you to set up simple automated alerts, and get a visual picture of recent changes in individual metrics.
Graphs
Once you are signed in to your AWS account, you can open the CloudWatch console where you will see the metrics related to the different AWS technologies.

By clicking on DynamoDB’s “Table Metrics” you will see the list of your tables with the available metrics for each one:

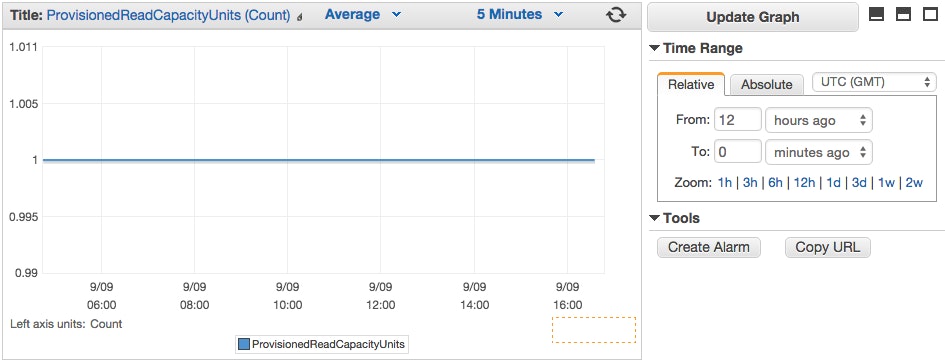
Just select the checkbox next to the metrics you want to visualize, and they will appear in the graph at the bottom of the console.

Alerts
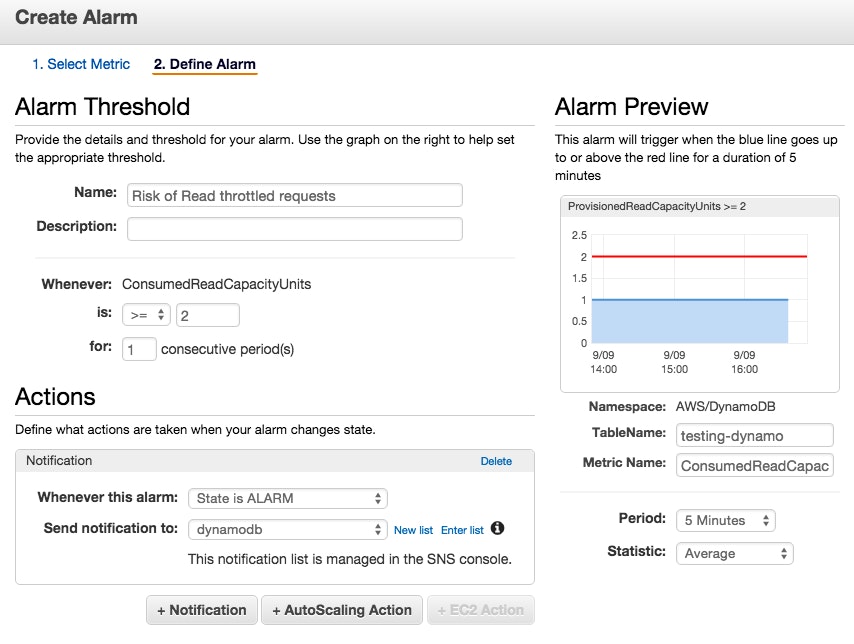
With the CloudWatch Management Console you can also create alerts which trigger when a certain metric threshold is crossed.
Click on Create Alarm at the right of your graph, and you will be able to set up the alert, and configure it to notify a list of email addresses:

Using the Command Line Interface
You can also retrieve metrics related to a specific table using the command line. To do so, you will need to install the AWS Command Line Interface by following these instructions. You will then be able to query for any CloudWatch metrics you want, using different filters.
Command line queries can be useful for spot checks and ad hoc investigations when you can’t or don’t want to use a browser.
For example, if you want to retrieve the metrics related to PutItem requests throttled during a specified time period, you can run:
aws cloudwatch get-metric-statistics --namespace AWS/DynamoDB --metric-name ThrottledRequests --dimensions Name=TableName,Value=YourTable Name=Operation,Value=PutItem --start-time 2015-08-02T00:00:00Z --end-time 2015-08-04T00:00:00Z --period 300 --statistics=SumHere is an example of a JSON output format you will see from a “get-metric-statistics“ query like above:
{ "Datapoints": [ { "Timestamp": "2015-08-02T11:18:00Z", "Average": 44.79, "Unit": "Count" }, { "Timestamp": "2015-08-02T20:18:00Z", "Average": 47.92, "Unit": "Count" }, { "Timestamp": "2015-08-02T19:18:00Z", "Average": 50.85, "Unit": "Count" }, ], "Label": "ThrottledRequests" }Integrations
The third way to collect CloudWatch metrics is via your own monitoring tools which can offer extended monitoring functionality. For example if you want the ability to correlate metrics from one part of your infrastructure with other parts (including custom infrastructure or applications), or you want to dynamically slice, aggregate, and filter your metrics on any attribute, or you need specific alerting mechanisms, you probably are using a dedicated monitoring tool or platform. CloudWatch can be integrated with these platforms via API, and in many cases the integration just needs to be enabled to start working.
In Part 3, we cover a real-world example of this type of metrics collection: Medium’s engineering team monitors DynamoDB using an integration with Datadog.
Conclusion
In this post we have walked through how to use CloudWatch to collect and visualize DynamoDB metrics, and how to generate alerts when these metrics go out of bounds.
As discussed in Part 1, DynamoDB can't see, or doesn't report on all the events that you likely want to monitor, including true latency and error rates. In the next and final part on this series we take you behind the scenes with Medium's engineering team to learn about the issues they've encountered, and how they've solved them with a mix of tools which includes CloudWatch, ELK, and Datadog.
Source Markdown for this post is available on GitHub. Questions, corrections, additions, etc.? Please let us know.


