This post is part 2 of a 3-part series on monitoring Amazon ELB. Part 1 explores its key performance metrics, and Part 3 shows you how Datadog can help you monitor ELB.
Note: The metrics referenced in this article pertain to classic ELB load balancers. We will cover Application Load Balancer metrics in a future article.
This part of the series is about collecting ELB metrics, which are available from AWS via CloudWatch. They can be accessed in three different ways:
- Using the AWS Management Console
- Using the command-line interface (CLI)
- Using a monitoring tool integrating the CloudWatch API
We will also explain how using ELB access logs can be useful when investigating on specific request issues.
Using the AWS Management Console
Using the online management console is the simplest way to monitor your load balancers with CloudWatch. It allows you to set up basic automated alerts and to get a visual picture of recent changes in individual metrics.
Graphs
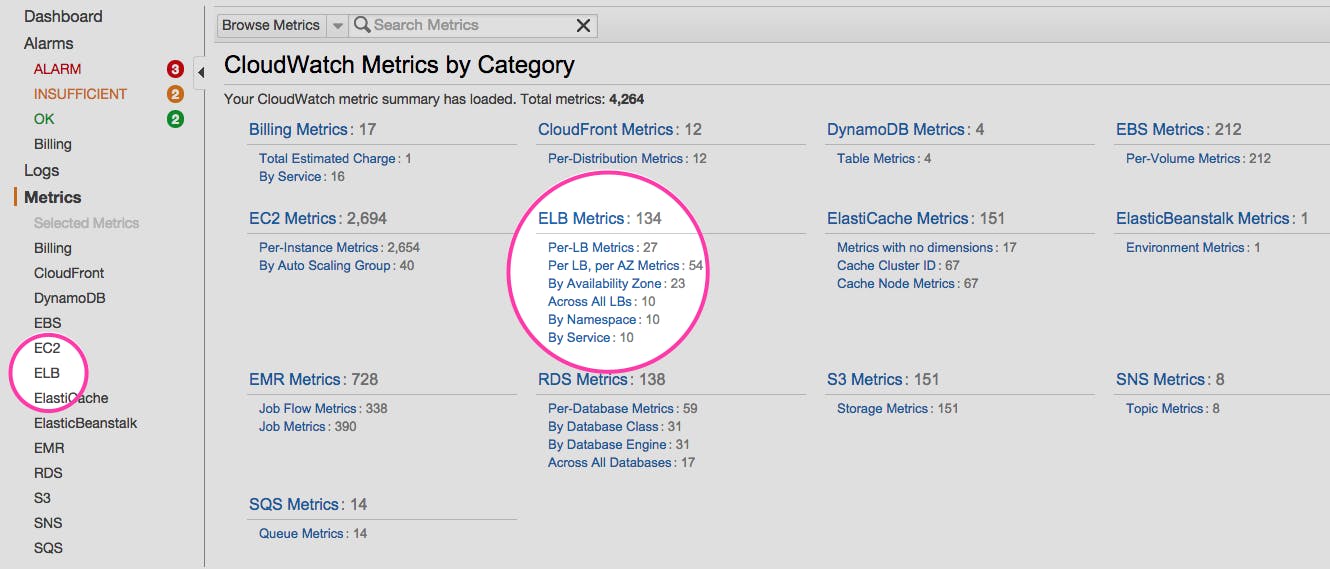
Once you are signed in to your AWS account, you can open the CloudWatch console and then browse the metrics related to the different AWS services.
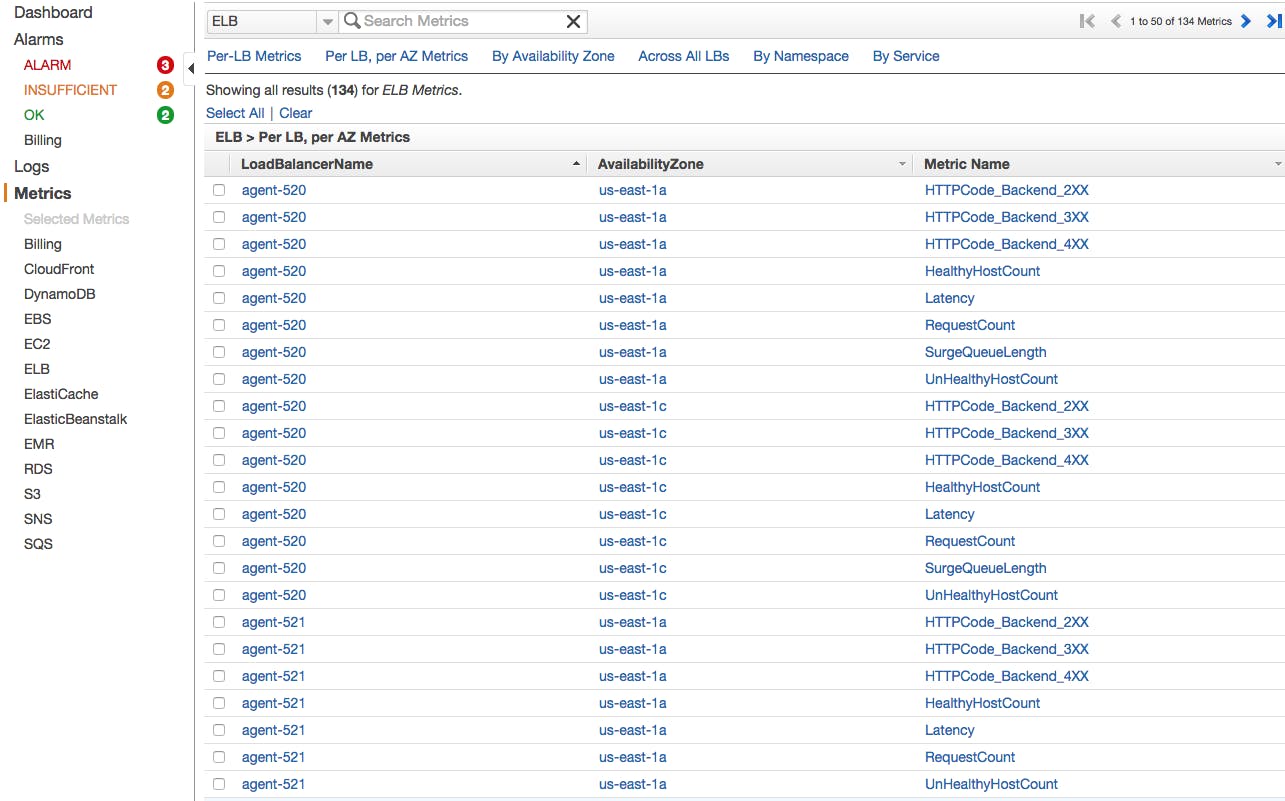
By clicking on the ELB Metrics category, you will see the list of available metrics per load balancer, per availability zone:
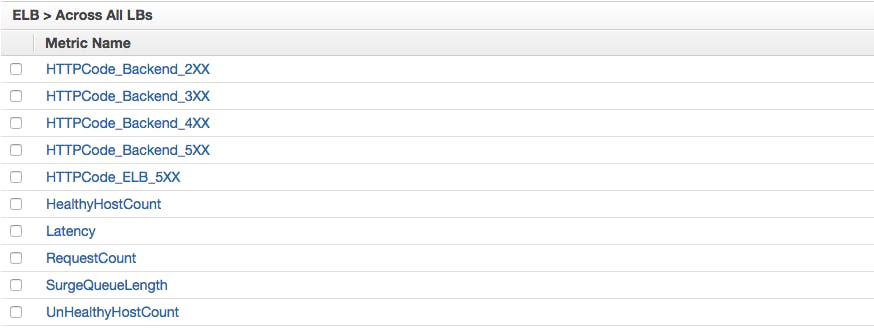
You can also view the metrics across all your load balancers:
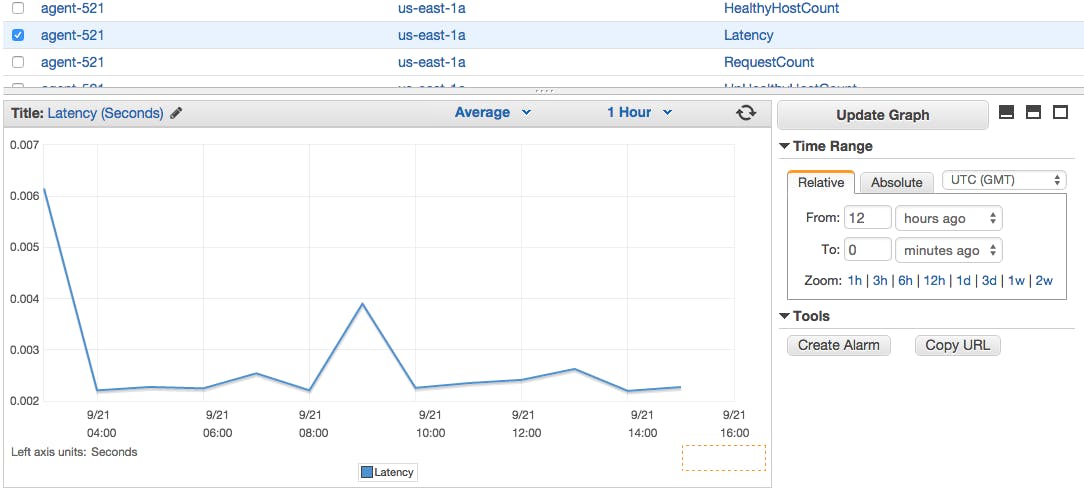
Just select the checkbox next to the metrics you want to visualize, and they will appear in the graph at the bottom of the console:
Alerts
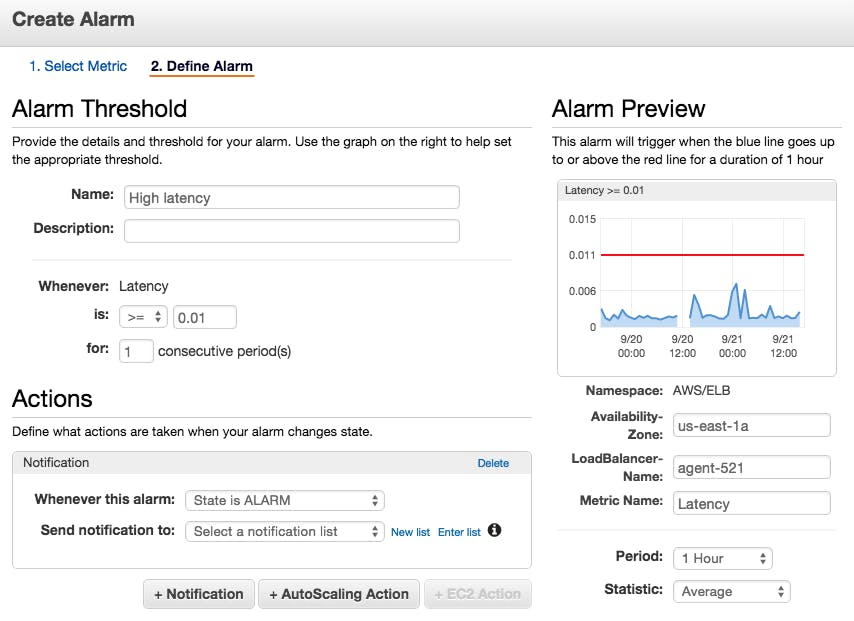
With the CloudWatch Management Console you can also create simple alerts that trigger when a metric crosses a specified threshold.
Click on the “Create Alarm” button at the right of your graph, and you will be able to set up the alert and configure it to notify a list of email addresses:
Using the AWS Command Line Interface
You can also retrieve metrics related to a load balancer from the command line. To do so, you will need to install the AWS Command Line Interface (CLI) by following these instructions. You will then be able to query for any CloudWatch metric, using different filters.
Command line queries can be useful for quick spot checks and ad hoc investigations. For example, if you want to check the latency of a specific load balancer, you can run:
aws cloudwatch get-metric-statistics
--metric-name Latency
--start-time 2016-05-18T00:23:00
--end-time 2016-05-18T00:24:00
--period 60
--statistics Average
--namespace AWS/ELB
--dimensions Name=LoadBalancerName,Value=<YOUR-LOAD-BALANCER-NAME>
That command returns a JSON output of this form:
{
   "Datapoints": [
      {
           "Timestamp": "2016-05-18T00:23:00Z",
            "Average": 0.000995635986328125,
            "Unit": "Seconds"
        }
    ],
      "Label": "Latency"
 }
n this example we queried a one-minute window at 60-second granularity (via the period parameter), so the query returned only one datapoint. Be aware that if you query a longer timeframe and CloudWatch returns multiple datapoints, they may not appear in chronological order in the JSON response.
Here are all the commands you can run with the CLI.
Monitoring tool integrated with CloudWatch
The third way to collect CloudWatch metrics is via your own monitoring tools, which can offer extended monitoring functionality.
You probably need a dedicated monitoring system if, for example, you want to:
- Correlate metrics from one part of your infrastructure with others (including custom infrastructure or applications)
- Dynamically slice, aggregate, and filter your metrics on any attribute
- Access historical data
- Set up sophisticated alerting mechanisms
CloudWatch can be integrated with outside monitoring systems via API, and in many cases the integration just needs to be enabled to start working.
As explained in Part 1, CloudWatch’s ELB-related metrics give you great insight about your load balancers’ health and performance. However, for more precision and granularity on your backend instances’ performance, you should consider monitoring their resources directly. Correlating native metrics from your EC2 instances with ELB metrics will give you a fuller, more precise picture. In Part 3, we cover a concrete example of this type of metrics collection and detail how to monitor ELB using Datadog.
ELB Access Logs
ELB access logs capture all the information about every request received by the load balancer, such as a time stamp, client IP address, path, backend response, latency, and so on. It can be useful to investigate the access logs for particular requests in case of issues.
Configuring the access logs
First you must enable the access logs feature, which is disabled by default. Logs are stored in an Amazon S3 bucket, which incurs additional storage costs.
Elastic Load Balancing creates log files at user-defined intervals, between 5 and 60 minutes. Every single request received by ELB is logged, including those requests that couldn’t be processed by your backend instances (see Part 1 for the different root causes of ELB issues). You can see more details here about the log entry format and the different fields containing information about a request.
Analyzing logs
ELB access logs can be useful when troubleshooting and investigating specific requests. However, if you want to find and analyze patterns in the overall access log files, you might want to use dedicated log analytics tools, especially if you are dealing with large amount of traffic generating heavy log file volume.
Conclusion
In this post we have walked through how to use CloudWatch to collect and visualize ELB metrics, how to generate alerts when these metrics go out of bounds, and how to use access logs for troubleshooting.
In the next and final part on this series you will learn how you can monitor ELB metrics using the Datadog integration, along with native metrics from your backend instances for a complete view, with a minimum of setup.
Source Markdown for this post is available on GitHub. Questions, corrections, additions, etc.? Please let us know.


