

Björn Antonsson
Staff Engineer

Paul Le Grand des Cloizeaux
Senior Software Engineer

Scott Gerring
Senior Technical Advocate
When we started building more production services in Rust at Datadog, tracing was the part of our observability stack that needed to evolve alongside it the most. Different teams instrumented services with different libraries, context propagation varied depending on which crates were in the request path, and sampling decisions often depended more on local configuration than on end-to-end behavior.
These inconsistencies had a real cost during incidents. Engineers investigating a latency spike or error spike would pull up a trace only to find it truncated at a Rust service boundary—context lost, a new trace started, the downstream path invisible. Manually stitching together what happened from incomplete traces added time and uncertainty to every investigation. Over time, it became clear that solving this well meant investing in shared infrastructure. We needed a shared approach to Rust observability that worked across teams and held up under production load.
In this post, the Datadog APM team describes how we arrived at that approach by contributing upstream to OpenTelemetry and building an opinionated Rust tracer—dd-trace-rs—on top of it. We’ll walk through the design constraints we encountered, the trade-offs we made around propagation and sampling, and what we learned from operating Rust services with tracing in production.
Rust and OpenTelemetry at Datadog scale
At Datadog, we collect more than 100 trillion events per day, and a growing share of them now pass through Rust services as we’ve adopted Rust for performance-sensitive infrastructure. OpenTelemetry is how those services integrate with the rest of our observability stack without fragmenting our observability data.
Many teams used the tracing crate—a popular structured logging library—and bolted on OpenTelemetry exporters and instrumentation for databases, HTTP clients, and other dependencies. In practice, this meant mixing tracing-based and OpenTelemetry-based instrumentation within the same request path, and teams were often frustrated to discover that single requests became a fragmented mess when exported.
Even when teams worked around these issues, more subtle problems remained. Sampling decisions were inconsistent across services, and resource utilization was often inefficient or higher than expected. Over time, this complexity compounded, leading to wasted engineering effort and unnecessary resource consumption.
Evaluating our options: OpenTelemetry, tracing, or a custom approach
As engineers, we enjoy building new things from scratch. The “not built here” instinct is real. But before going down that path, we first asked: Do we actually need to?
The most obvious alternative to building a new Datadog tracer was to standardize on the OpenTelemetry Rust SDK. We could define internal best practices, provide example configurations, and contribute upstream as we encountered limitations. This approach has clear advantages: It preserves compatibility with the broader ecosystem, avoids introducing additional abstraction layers, and aligns with the industry’s growing adoption of OpenTelemetry as a standard.
OpenTelemetry is intentionally flexible, as it supports many backends, sampling strategies, and deployment models. That flexibility is valuable for the broader community, but in our case—running services at Datadog and exporting to Datadog—it often led to confusion. The number of configuration choices that OpenTelemetry offers made it difficult to achieve consistent behavior across teams. For example, failing to consistently supply service metadata such as service version, service name, and container tags makes it difficult to correlate signals with telemetry data downstream.
Another option we considered was to double down on tracing as the primary abstraction layer and treat OpenTelemetry purely as an export mechanism. tracing is widely used in the Rust ecosystem, but it comes with limitations. Its name refers to tracing execution within a single process. While there have been attempts to extend it for distributed tracing, as well as wrappers for various clients, we felt this approach would push it beyond its intended use and introduce long-term complexity.
Introducing dd-trace-rs: An opinionated Rust tracer built on OpenTelemetry
Given these constraints, we wanted to build on OpenTelemetry, which was designed from the ground up to support distributed tracing, while avoiding a reliance on documentation and best practices alone. We needed an approach that worked automatically and consistently in production.
Enter dd-trace-rs, Datadog’s open source distributed tracing library for Rust. It builds on the OpenTelemetry Rust SDK while providing an opinionated configuration tailored for Datadog users—both our internal service teams and our customers. In practice, this shifts tracing from “each team configures tracing correctly” to “correct behavior is the default.”
Out of the box, dd-trace-rs:
Configures itself using standard Datadog environment variables such as
DD_SERVICEandDD_ENV. This enables teams to configure services consistently across languages.Applies opinionated sampling strategies aligned with Datadog’s ingestion model. By making sampling decisions consistently across distributed traces, it helps preserve complete traces while reducing the amount of telemetry that applications send.
Provides consistent context propagation, which helps ensure that traces remain intact as requests move across heterogeneous services and libraries.
Uses the existing OpenTelemetry instrumentation ecosystem in Rust, allowing teams to reuse integrations without additional work.
Improving interoperability between tracing and OpenTelemetry
Building dd-trace-rs meant more than adding a thin layer on top of OpenTelemetry. To make tracing behave consistently in real systems, we had to invest both upstream in OpenTelemetry and in extensions to the OpenTelemetry SDK itself.
In practice, most Rust services use tracing for instrumentation while relying on OpenTelemetry to export spans. Because the two APIs weren’t designed with each other in mind, interoperability has been a long-standing challenge in the Rust observability ecosystem, as documented in a closed issue. One common failure mode is illustrated in the Broken trace example issue (#1690): Creating a span with the OpenTelemetry API from inside an active tracing span doesn’t attach to that span because the OpenTelemetry API has no way to see that a tracing span is currently active. Any service combining the two could hit this without doing anything wrong, ending up with two separate traces for the same request: one with the logs, the other with the nested spans.
We traced the root cause to a mismatch between OpenTelemetry’s representation of the “currently active” context: a single slot, which couldn’t reliably support the way tracing’s own span stack works. We rewrote it as a proper stack, resilient to out-of-order and overlapping scopes, in PR #2378.
That foundational groundwork for interoperability also made several context operations 2–4x faster as a side effect. That stack made it possible to extend the bridge in tracing-opentelemetry so that it keeps an OpenTelemetry context synchronized with the active tracing span in real time. This work landed in PR #202, after which calling the standard OpenTelemetry API from inside tracing-instrumented code now finds the right context automatically. Landing that also meant fixing a bug in tracing itself, where layered subscribers weren’t propagating a callback the bridge needed (PR #3379).
None of this is Datadog-specific. These changes now benefit anyone combining tracing and OpenTelemetry, helping to make correct, correlated traces the default across the Rust ecosystem, not just our own services.
Extending the OpenTelemetry pipeline for consistent tracing
OpenTelemetry is built around a simple, intentionally extensible pipeline: Spans are created, processed (batched, sampled, enriched), and then exported, as shown in the following diagram.
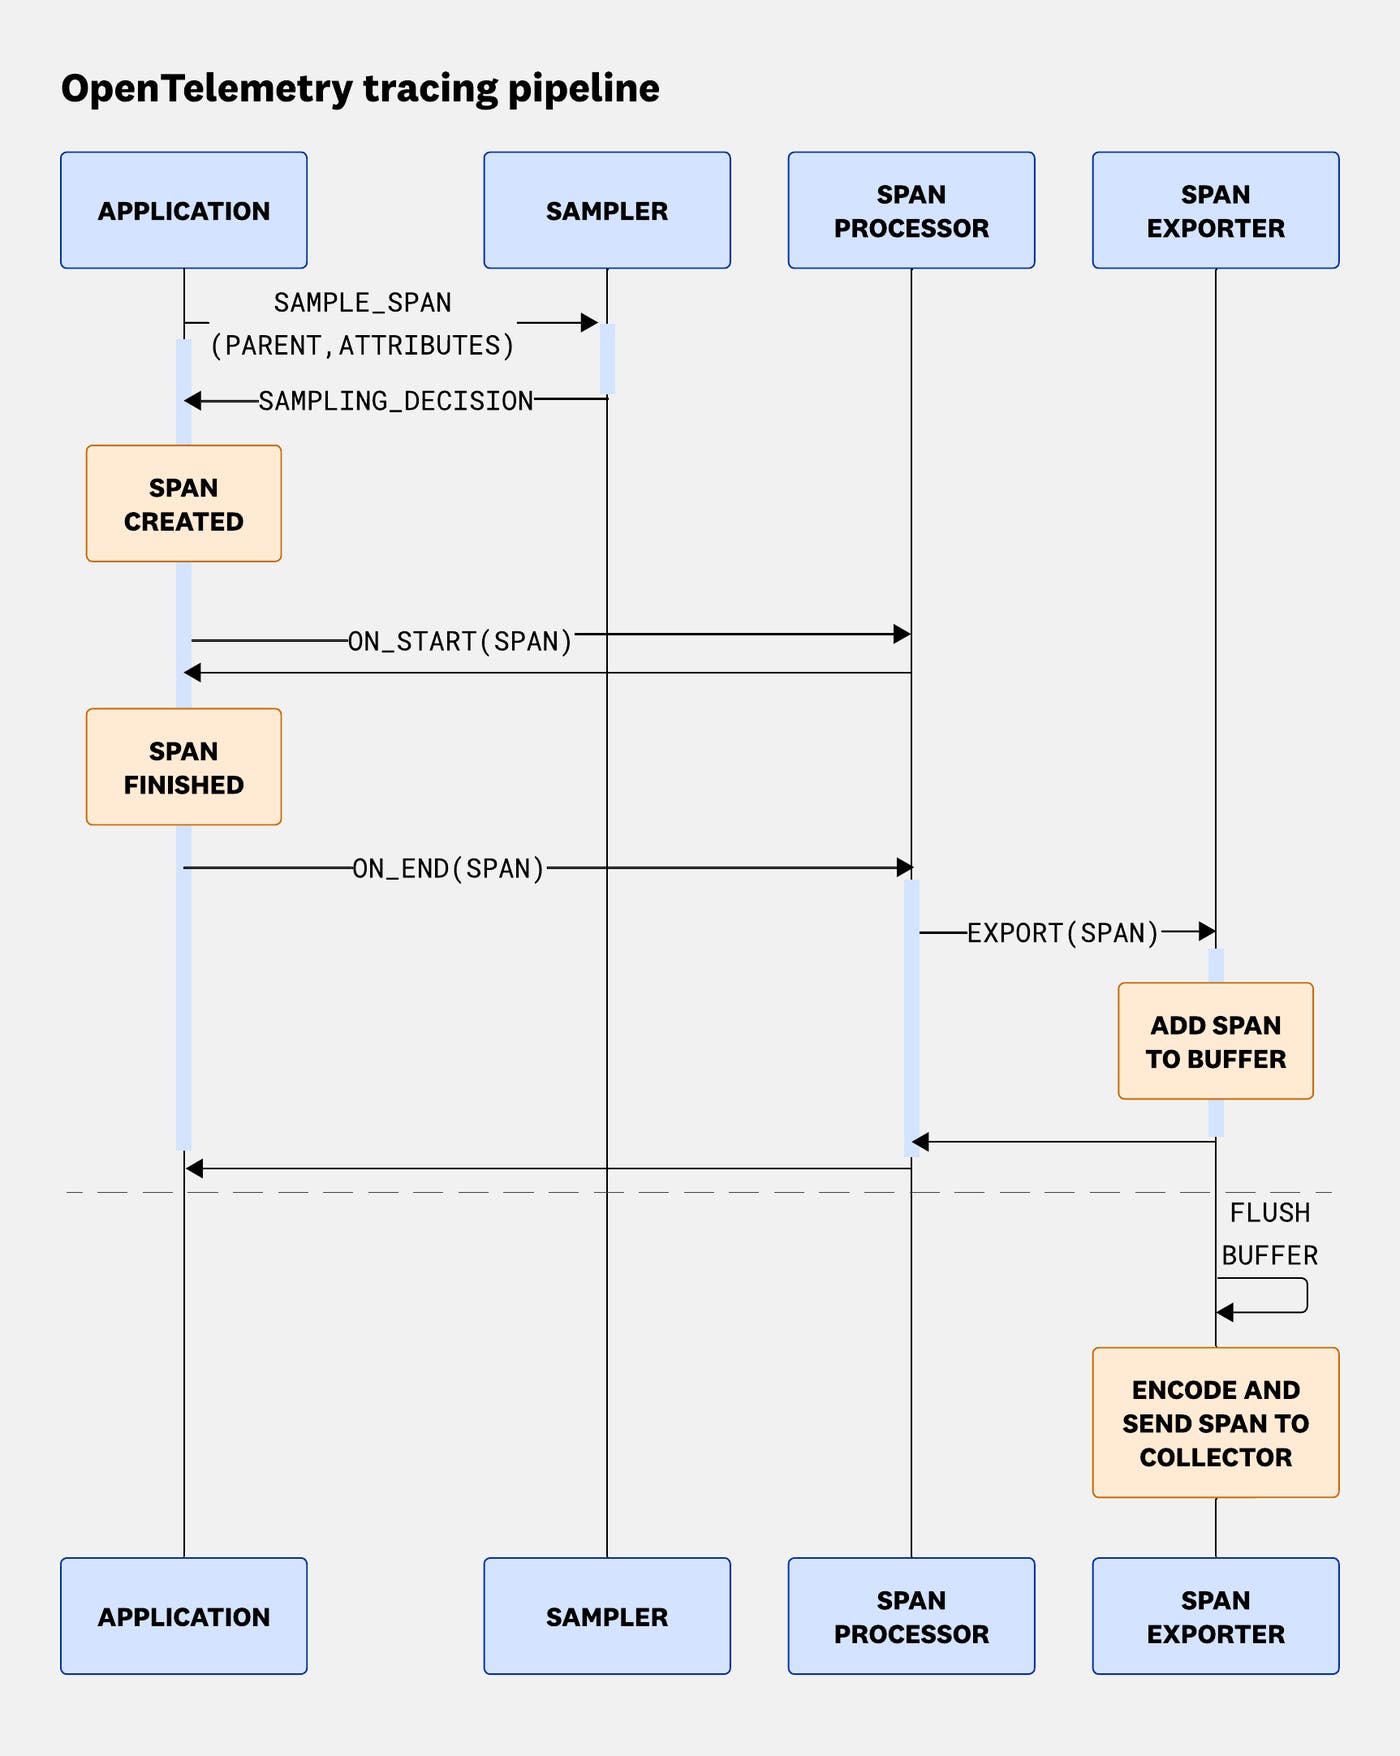
dd-trace-rs builds on these extension points.
Configuration builder
The OpenTelemetry SDK is intentionally unopinionated about configuration. It exposes a flexible TracerProvider builder that leaves wiring decisions to the user. This is the right choice for a vendor-neutral SDK, but it means every team has to determine the correct sampler, exporter, propagator, and resource settings.
We wrap this builder to accept a Datadog configuration object that resolves settings from environment variables, files, and code, then instantiates the TracerProvider with all components correctly wired together. The defaults are tuned for high-throughput production deployments, so teams don’t have to configure tracing from scratch. In the rare cases where a service needs manual configuration, overriding these defaults remains possible.
Sampler
In the standard OpenTelemetry model, the SDK calls the sampler before a span is created, and the resulting decision is immutable. This minimizes overhead by dropping unsampled spans as early as possible.
For our use cases, that decision often happens too early. We may want to retain spans for errors, interesting HTTP responses, or rarely hit endpoints. That information may not be available at span creation time.
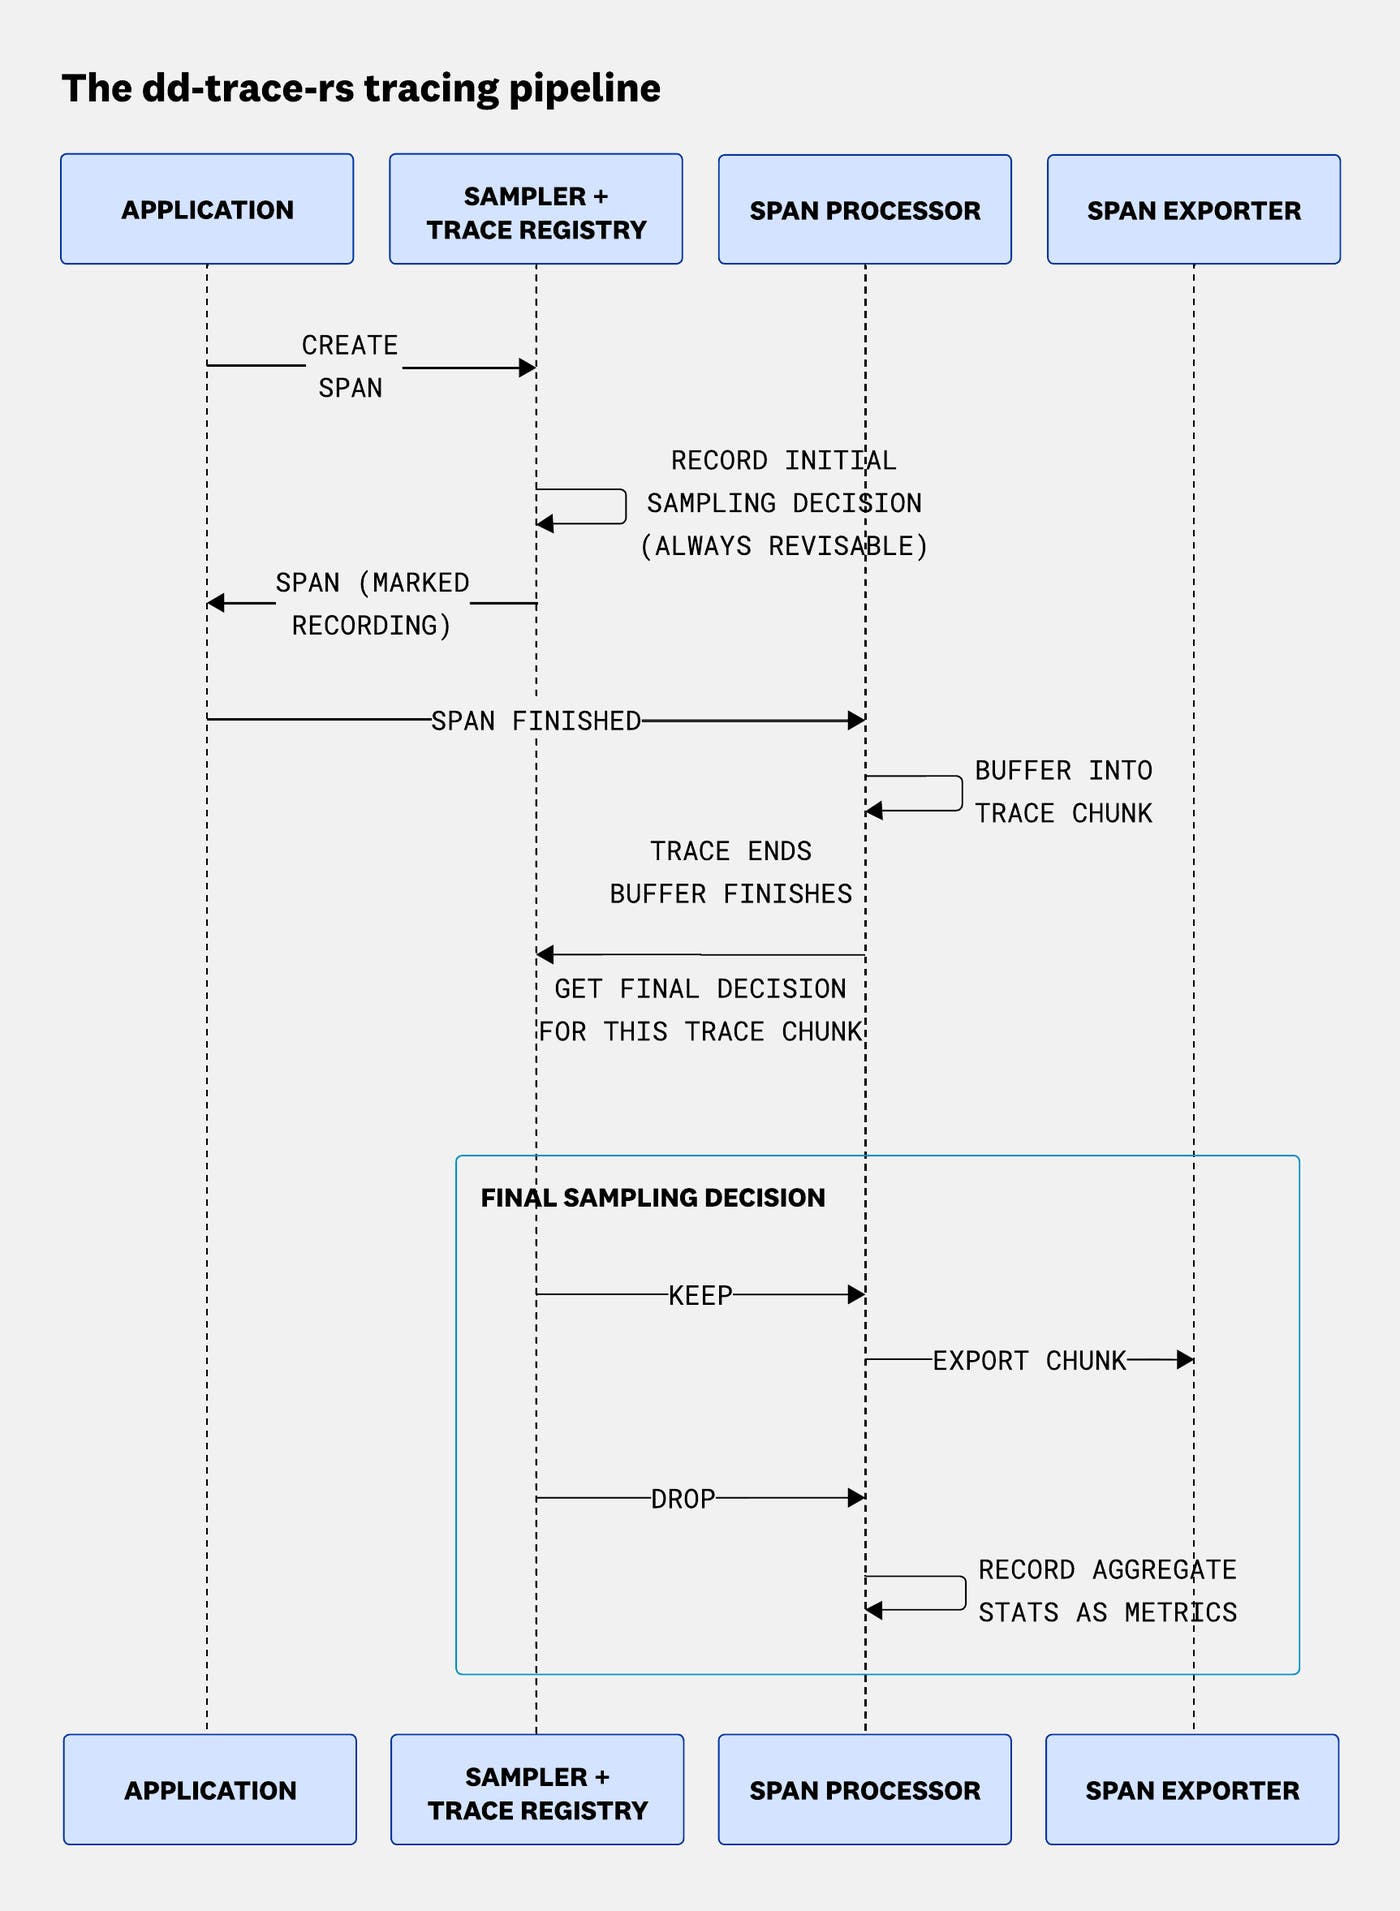
Instead, our sampler marks all spans as recording and stores an initial sampling decision in an internal trace store that can be revised at any point during the span’s lifetime. This allows us to defer the final keep-or-drop decision until we have full context.
This deferred-decision model goes beyond what OpenTelemetry’s standard sampler interface assumes: Rather than a single immutable choice made at span creation, every span’s fate stays open for revision until the trace is complete, at any scale, without holding the whole trace in memory at once.
Span processor
By default, the OpenTelemetry SDK flushes completed spans individually and as quickly as possible. This works well in general, but does not account for trace-level decisions.
Because our sampler marks all spans as recording, the processor observes every span. Rather than flushing spans one by one, it buffers them and flushes entire traces together as trace chunks, using a bounded buffer to cap memory.
At flush time, it makes a final sampling decision per chunk. Kept spans are exported, while dropped spans have aggregate statistics computed and sent as metrics before being discarded. This enables Datadog’s backend to reconstruct accurate analytics even when services are sampling aggressively.
Adding in our custom components, the full pipeline is shown in the following diagram.
Results and impact
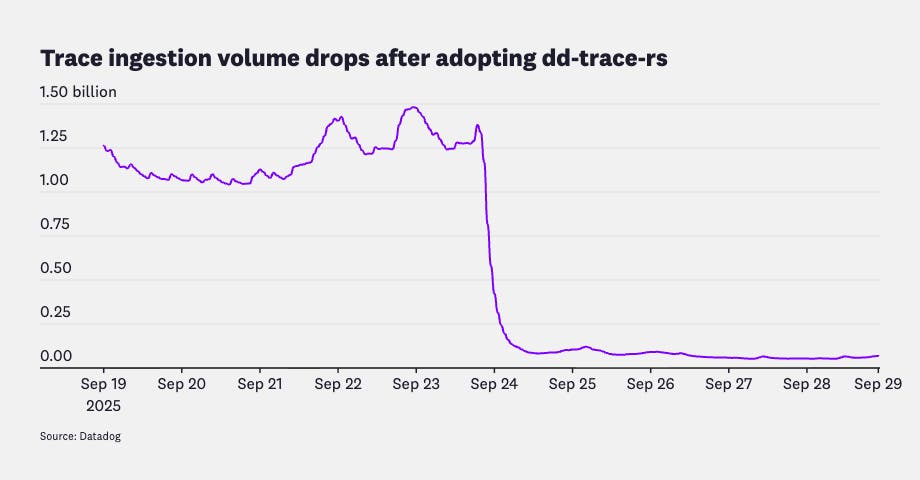
Once we began adopting dd-trace-rs in internal services, we saw improvements in our trace ingestion system.
Improved sampling strategies reduced ingestion volume on the backend by a factor of 20. By aligning with Datadog’s sampling model, we were able to preserve the same level of observability signal while sending significantly less data.
For the traces that were sampled, we also observed 3x the rate of indexed spans per service. This completes the picture: Because sampling decisions are now consistent across all services involved in a trace, spans are more likely to be retained and indexed together.
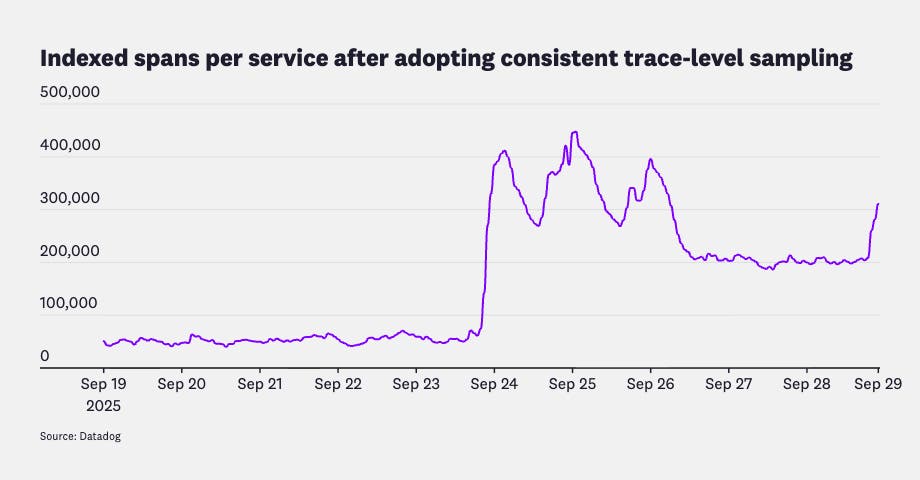
Together, these results show that dd-trace-rs improves the quality of ingested traces by ensuring consistent sampling decisions across services, while reducing the amount of data that applications send and Datadog processes.
Configuration
The configuration required to achieve this setup is also simpler and includes Datadog-specific best practices out of the box:
use opentelemetry::trace::TracerProvider;use tracing_subscriber::{layer::SubscriberExt, util::SubscriberInitExt};// This picks up env var configuration and other datadog configuration sourceslet tracer_provider = datadog_opentelemetry::tracing().init();
tracing_subscriber::registry() .with( tracing_opentelemetry::layer() .with_tracer(tracer_provider.tracer("my_application_name")), ) .init();What’s next for Rust observability at Datadog
OpenTelemetry provides a strong foundation for building interoperable observability systems, and we continue to invest in it. The context stack and tracing bridge work described previously is one example, and there’s more of the same ahead. By contributing upstream, we help ensure that the challenges we encounter at Datadog scale help improve the ecosystem as a whole, not just our own tooling.
At the same time, building an opinionated layer like dd-trace-rs allows us to meet the specific requirements of running tracing in production at scale. It enables consistent behavior across services, reduces operational overhead, and provides a better out-of-the-box experience without fragmenting the ecosystem.
There are still areas where OpenTelemetry’s current model does not fully align with our needs, particularly around deferred sampling, richer context propagation, and attaching data at the trace level. These gaps reflect differences in underlying models rather than shortcomings, and they continue to shape the work we do both upstream and in our own libraries.
This combination—contributing to shared foundations while building targeted extensions—is how we expect to continue evolving Rust observability at Datadog.
Building consistent Rust tracing at scale
As Rust use continues to grow inside Datadog and across the industry, reliable observability becomes increasingly important. By investing in OpenTelemetry, contributing upstream, and building dd-trace-rs on top of those shared foundations, we’ve been able to deliver consistent, high-quality tracing across services while reducing cost and operational complexity.
The result is a system where correct behavior is the default instead of something each team has to rediscover. We hope the lessons we have learned help other teams navigate Rust tracing at scale while encouraging deeper collaboration across the Rust and OpenTelemetry communities.
If you’re interested in working on problems like these, we’re hiring across multiple engineering teams at Datadog.
