Darron Froese
We've been using Consul for about 18 months at Datadog and it's an important part of our production stack.
It helps us primarily to:
- Distribute configuration across our cluster.
- Discover service endpoints for our microservices based architecture.
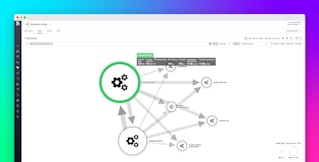
Here's how it's all connected together:

We've talked about our journey with Consul but want to post some of our most important recommendations here:
- Consul Servers like Beefy CPUs
- Fast Auditable Configuration Changes
- ACLs are your Friend
- Don't DDoS Yourself - Use a Watch
- dnsmasq Lightens the Load
- Monitoring Consul is Not Optional
Consul Servers like Beefy CPUs
Consul server nodes elect a Leader using the Raft consensus protocol. They need a single leader to help them to agree as a distributed system.

If the non-Leader server nodes don't hear from the Leader for 500 milliseconds, they kick that Leader out and elect a new one - this is called a leadership transition. If your Consul server nodes are undergoing a large number of leadership transitions, the simplest thing to do is to give them more CPU power.
Server Size Recommendations:m3.large ~ 300 agent nodesc3.xlarge ~ 500 agent nodesc3.2xlarge ~ 800 agent nodes
We have some specific recommendation sizes posted, but the rule of thumb is: If you're seeing leadership transitions every hour - or more - then increase the server's CPU size until they are - at most - a daily occurrence.
Please note - most monitoring systems don't have high enough resolution to see a 500 millisecond CPU spike - but this helps to minimize leadership transitions.
Fast Auditable Configuration Changes

A great use of Consul's Key Value store is to distribute configuration data around your cluster. Data stored here is available on any node via an HTTP call or - when it changes - through a Consul watch.
Having this data available without an audit trail is a recipe for disaster - you don't know who changed what or when the change was made. Use git2consul to distribute the contents of a git repository.
We use git2consul for 60 second cluster wide configuration changes dozens of times a day.
ACLs are your friend
Ever heard the saying: "Good fences make good neighbors?"
In the same way, use Consul's Access Control List system to make sure that only authorized processes can remove or overwrite data that you're placing into the Key Value store.
These ACLs can also help to protect against accidental mistakes by localizing the scope of the damage - any given token only has access to its own data and no more.
Don't DDoS Yourself - Use a Watch
Watch your read and write velocity and volume. Even though it can handle significant read and write loads, Consul isn't designed to be accessed hundreds of thousands of times per second like Redis or Memcached.
Consul watches are a very powerful way to distribute and interact with Key Value data as it changes:
{ "watches": [ { "type": "key", "key": "/kvexpress/hosts/checksum", "handler": "kvexpress out -k hosts -f /etc/hosts.consul -c 00644 -e 'sudo pkill -HUP dnsmasq'" } ]}Be aware that Consul watches can occasionally fire too much. We've been using sifter to protect against watches firing when they're not supposed to.
dnsmasq Lightens the Load
If you're using Consul for service discovery, and you're using the DNS interface to find your services, there are several ways to help Consul scale.
First off, add a short DNS TTL to Consul - we use 10s for most services.
Secondly, query dnsmasq instead of Consul directly. If dnsmasq doesn't know the answer, it will ask Consul. There's some example dnsmasq configuration and installation details available here.

Third, at extremely high velocities, you can cache the Consul services in an additional hosts file that's loaded into dnsmasq - see here. With this in place, we regularly serve more than 100,000 DNS requests / second using dnsmasq while only 400 requests / second are hitting Consul directly.
We're getting stats out of dnsmasq and into Datadog using goshe.
Monitoring Consul is Not Optional
If you want to deploy Consul - you really do need a way to monitor it. We have blogged about monitoring Consul in the past using Datadog but because of the go-metrics library that Consul uses, there are additional alternatives.
The most important metrics to watch are:
consul.consul.leader.reconcile.count- Do we have a Leader? Should be flat.consul.serf.events.consul_new_leader- When were the last leadership transitions? Lots of these are a sign of problems.
With those two metrics in a good state you can be reasonably sure that your Consul cluster is healthy.
You can be assured that your cluster is NOT healthy if you see this:

Other metrics to watch include:
consul.raft.leader.lastContact- Time since the node has had contact with the Leader.consul.consul.dns.domain_query.count- How many DNS requests are hitting Consul directly?- CPU on Consul server nodes.
- Networking on Consul server nodes.


