

Thomas Kowalski
Senior Software Engineer

Scott Gerring
Senior Technical Advocate
We released the first version of the Datadog Python profiler almost 10 years ago. Since then, frameworks built on asyncio have become common, and asynchronous code has become the norm for many Python services. Traditional flame graphs, however, often lose the relationships between asyncio tasks: They can show where work is happening without showing which application path led to it.
We encountered this limitation while investigating the performance of our own Python services. To preserve the context needed to understand performance regressions, we built an async-aware profiling model that reconstructs the relationships between tasks. Making that model practical in production also led us to reduce profiler overhead by more than 60% while producing higher-fidelity profiles.
In this post, we’ll explain how we reconstruct relationships between asyncio tasks, the edge cases we encountered in production, and the changes we made to reduce profiling overhead.
How asyncio changes Python’s execution model
Python’s asyncio provides a way to write concurrent programs without requiring developers to manage operating system threads directly. Instead, developers work with higher-level abstractions such as coroutines and tasks. But that concurrency comes with a different execution model. Multiple coroutines can make progress on a single thread, with their execution suspended and resumed over time. For a profiler, that means a single thread can no longer be represented by a single logical execution stack. This difference is what prompted us to overhaul how our profiler handles asyncio.
Python developers define coroutines by using the async def keyword. A coroutine can await another coroutine—for example, await other_coroutine()—perform asynchronous I/O, or wait on asyncio synchronization primitives such as await async_lock.acquire(). Coroutines can also call synchronous functions, which execute normally on the current thread.
Coroutines always execute as part of a task. Each task has a root coroutine, and the task is ongoing as long as its root coroutine hasn’t completed or failed. Tasks can also be created by one coroutine and awaited elsewhere, and thus by other tasks. Creating a task does not require immediately awaiting it. A coroutine can create a task, which can begin running independently, then return it to its caller, or pass it to another coroutine. Tasks must be retained or awaited so that their results and exceptions can be handled.
In that sense, creating a task is different from calling a function in synchronous code. The new task is effectively free-floating: It has its own execution stack and can make progress concurrently with the task that created it. It can even outlive that task.
Finally, when a task—or, rather, the coroutine currently executing within it—awaits something, it yields control back to the event loop, which orchestrates the execution of all tasks. This allows the event loop to run other ready tasks while the coroutine is suspended.
For developers, running asynchronous Python requires relatively little setup: It boils down to calling the right helper and passing it a coroutine as an entry point. Profiling asynchronous code, on the other hand, requires additional logic to account for this execution model. As we’ll see next, simply capturing the stack of the currently running task isn’t enough to reconstruct the relationships between tasks.
Why traditional flame graphs fall short for asyncio
This all sounds great—safe concurrency without much effort for the programmer—until you attach a traditional profiler and see a flame graph like the following:

Looking at this flame graph, where frames are colored based on the task they execute in, you can see that everything has been flattened out: The stack trace does not reflect the relationship between tasks. If you suspect a performance issue with Cassandra, for instance, you can see time being spent there, but not which path through the application led to that work.
Because each task has its own execution stack, the stack traces for the following code will never show handle_request, signup, Cassandra-related code, and metrics-related code together on the same stack:
import aio_cassandra
async def handle_request(...) -> None: if route == "signup": await asyncio.create_task(signup(...))
async def signup(...) -> None: await validate_user(...) # emit metrics in the background asyncio.create_task(emit_datadog_metrics(...))
async def validate_user(...) -> None: cass_tasks = [ # several validations needed aio_cassandra.query(...), aio_cassandra.query(...), ] await asyncio.gather(*cass_tasks)
# ... do caching etc.
asyncio.run(handle_request(...))If we compare the resulting flame graph with our mental model of the code, we can see what gets lost when those stacks are flattened:
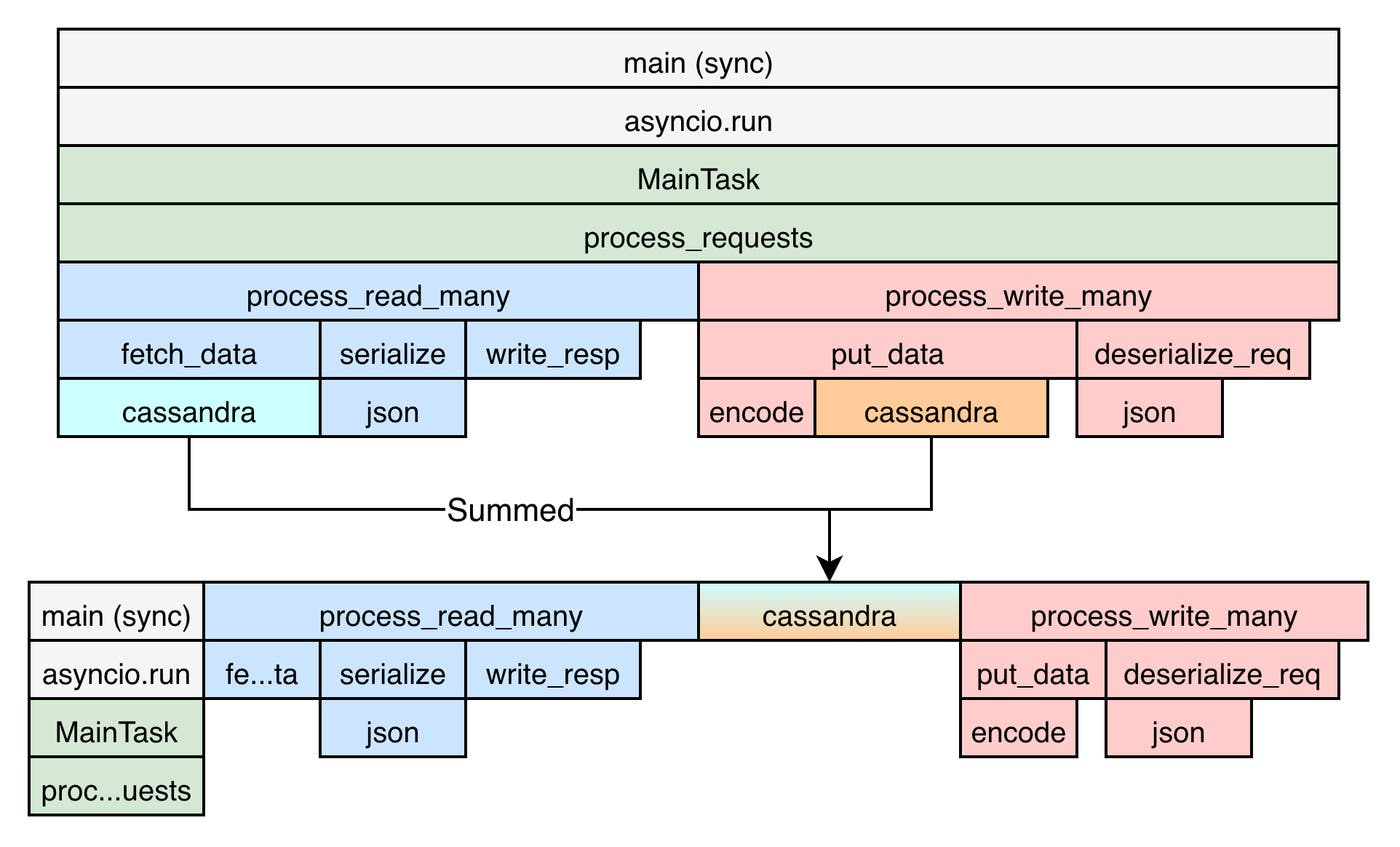
Instead of cassandra processing time being attributed to the tasks that depend on it, it appears free-floating. Looking at the flame graph alone, we cannot tell which task led to the work in cassandra because context has been lost. As a result, the reported time for callers is also incorrect.
This is a simple example, but it shows why traditional flame graphs become difficult to interpret for asynchronous applications. Imagine a web framework that spawns one task per request and handles dozens of requests concurrently.
What developers need to see is the relationships between tasks in the way they structured them in the code, so that they can reason about their relative performance impact. We call this concept stacked stacks.
Reconstructing relationships between tasks
Instead of unwinding each task’s stack and reporting it independently—which is technically the most faithful way to do it, but results in the issues above—we keep track of parent-child relationships between tasks: which task is awaiting which.
When unwinding, we first build the frame stack for each task, then build a task dependency tree from those relationships. Finally, we use that tree to create the stacked stacks we report. By stacking related tasks, we can show what each coroutine is blocked on, representing those relationships much like function calls in synchronous programming.
The result is that programs that structure the same work in different ways produce comparable flame graphs. First, consider an asyncio implementation in which the work is split across separate tasks:
# Two separate tasks for check_auth and cassandra queriesimport aio_cassandra
async def validate_user() -> None: # (... handle caching ...)
cass_query = asyncio.create_task(aio_cassandra.query(...)) # cass_query has a separate execution context and stack await cass_query
# send metrics in the background asyncio.create_task(send_metrics())
# (... check, then return or raise ...)
async def check_auth() -> None: # raise if not logged in await validate_user()
asyncio.run(check_auth())Now consider an asyncio implementation in which the same work is performed within coroutines in a single task:
# One task for check_auth / validate_user / cassandra and send_metrics# which are directly called intoimport aio_cassandra
async def validate_user() -> None: # (... handle caching ...)
await aio_cassandra.query(...)
# send metrics (blocking) await send_metrics()
# (... check, then return or raise ...)
async def check_auth() -> None: # raise if not logged in await validate_user()
asyncio.run(check_auth())Finally, consider a synchronous implementation of the same work:
# Synchronous code only: check_auth, validate_user, cassandra driver# and send_metrics are regular functions
import cassandra
def validate_user() -> None: # (... handle caching ...)
# all code is synchronous, cassandra.query() is # a regular function call that executes on # the current thread's stack cassandra.query(...)
# send metrics (blocking) send_metrics()
# (... check, then return or raise ...)
def check_auth() -> None: # raise if not logged in validate_user()
check_auth()From a user’s perspective, this makes sense: cassandra.query and send_metrics are work happening in the context of, and required by, validate_user, regardless of whether the code is synchronous or asynchronous or whether that work runs in a separate task.
Handling tasks that outlive their creators
After we implemented this pattern in our profiler, Tachyon—the new CPython statistical profiler introduced in Python 3.15—implemented a similar approach. Production code, however, exposed an additional complication. Looking at code from production services showed us that these simple examples rarely translate neatly to real applications.
Flame graphs make an assumption that does not hold for tasks. In synchronous code, if one function calls another, the called function necessarily returns before its caller does. With asyncio, however, a task can outlive the task that created it:
async def escapes() -> None: await asyncio.sleep(1.0)
async def create_task() -> Task[None]: # t is created (and started) in create_task... t = asyncio.create_task(escapes(), name="escapes") # ... but it outlives create_task as it continues # executing after this return return t
async def main() -> None: t = await create_task() # escapes keeps running for ~1 second await tIn this case, should the stack for escapes appear under create_task, where it was created, or under main, where it is awaited for most of its lifetime? We chose the representation that would make the most sense for debugging: Time spent in escapes counts toward create_task while create_task is running. Once create_task finishes and main awaits escapes, that time counts toward main instead.
How we built async-aware stack traces
Our synchronous Python profiler works in a simple way. Every few milliseconds, the process captures a stack for each running thread. To do this without acquiring the global interpreter lock (GIL) and interrupting execution, it tentatively copies chunks of memory containing Python stacks, reinterprets them as CPython C objects, and extracts relevant information such as the function names and line numbers.
Another way to profile asynchronous Python is to instrument the interpreter’s call and return events. This approach can provide exact call counts and timing information, but its overhead grows with the application’s call volume. Our profiler instead uses periodic sampling, whose overhead is driven primarily by sampling frequency. This makes the profiler practical to run continuously in production while preserving the asynchronous context developers need to interpret the results.
Building the task dependency tree
Capturing stack samples for asynchronous code is more complicated. In addition to capturing a stack for each thread, the profiler needs to keep track of all existing asyncio tasks and determine their current dependencies when it captures a sample. A task’s creator is not necessarily the task that currently depends on the created task, and those relationships can change over the task’s lifetime. For each task, the profiler then walks the chain of coroutine frames from the root coroutine to the innermost one.
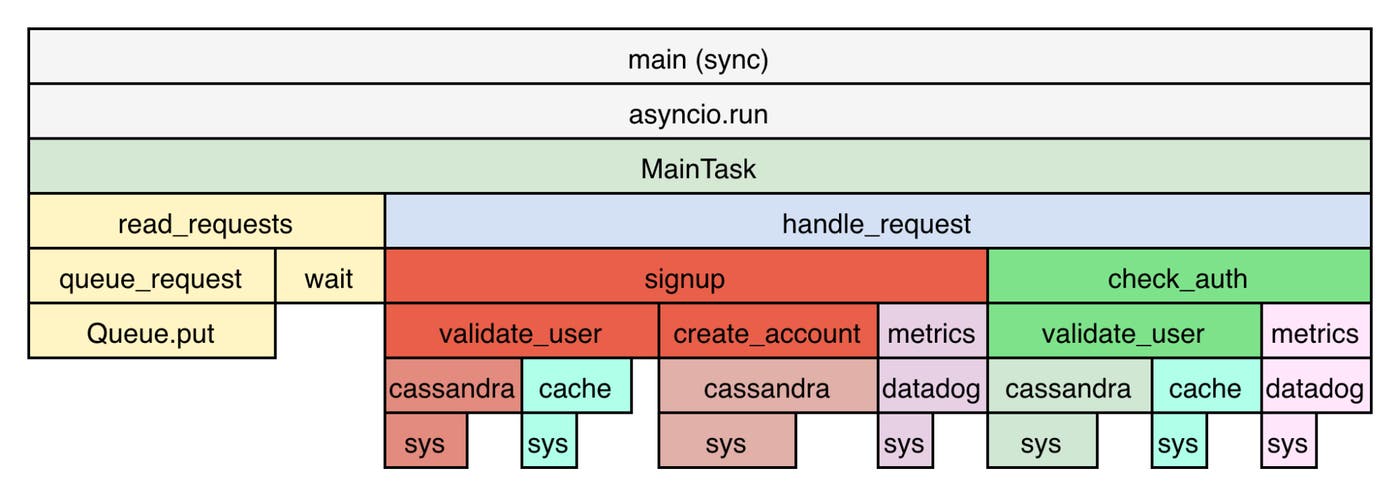
Once we have collected that information, we can build the task dependency tree and use it to construct the stacks that the profiler reports. We start with leaf tasks—tasks that are either running or awaiting something that is not another task—and push all their frames onto the task. We then check whether another task is awaiting the leaf task. If so, we push the frames from that parent task onto the same stack. We continue until there is no parent task left and we have reached the outermost task.
Coming back to our initial example, we now get the following flame graph:
The cost of profiling every task
Unfortunately, this additional context comes at a cost. Where synchronous profiling has O(n_threads) time complexity, asynchronous profiling adds O(n_tasks) complexity on top of the existing per-thread logic. It also requires copying more chunks of memory per task than synchronous profiling does per thread.
The number of tasks running at any point in an app can also be large by design (for example, one task per request in an HTTP server, then additional tasks to handle bits of work within the request)—much larger than the number of threads in an average Python app.
As a result, what was an acceptable per-thread sampling overhead becomes an unreasonable per-task overhead. This has an immediate effect on sample quality: The profiler periodically captures stacks for threads and tasks to attribute CPU time to them. With adaptive sampling, which dynamically adjusts sampling frequency to keep overhead low relative to the amount of CPU the application itself uses, this can lead to situations where the sampling frequency reaches its minimum: one sample per second. And while one sample per second is still statistically valid, it gives little visibility into what the application is really doing.
Reducing the overhead of async profiling
Realizing overhead was going to be a problem for real-world asynchronous profiling, we decided that before going further with our stacked stacks approach, we would reduce the profiler’s overhead more broadly. That raised another question: Where does our overhead even come from?
Finding the source of the overhead
In 2020, our profiler took samples by having the sampling thread acquire the GIL, capture stacks, and then allow other threads to resume work. This came with a visible cost: Pausing threads to capture samples had a direct impact on the profiled app’s latency. In response, in 2024 we released Stack v2—a stack profiler that worked in a native thread and captured stacks without needing to acquire the GIL.
To avoid pausing the interpreter, Stack v2 used the Linux API process_vm_readv to attempt to copy a chunk of the process’s memory—the same approach Tachyon adopted. If the copy succeeded, we could interpret the copied memory as CPython objects, such as frames and compiled code objects, to reconstruct a stack. Because we used this particular API to read memory, a failed copy—for example, if the memory had been freed or corrupted in the meantime—would cause the system call to return an error but never crash the process. We would simply drop the sample.
When we added support for asyncio, we applied the same thread- and memory-safe technique to unwind coroutine chains or read task metadata.
Why process_vm_readv became too expensive
This directly contributed to our overhead problem: process_vm_readv is a system call, which means each call requires a transition from user space into the kernel, adding overhead. Doing this once for large memory areas is easily amortized—for example, contiguous memory areas holding many Python stack frames. Copying many small structures, on the other hand—such as task objects and generators or coroutines—makes its cost prohibitive. As a result, whereas capturing a sample for all threads could often be done with a single process_vm_readv call, doing the same for all tasks would require several calls per task, multiplied by the number of tasks.
We came up with several ideas to reduce CPU overhead. The first two were removing all C++ exceptions from the sampling path, which reduced overhead by 15%, and interning strings such as function and file names to remove redundant per-sample memory copies, which reduced overhead by an additional 25%. But these changes were not enough to compensate for the growing number of system calls required for each new sample with asyncio.
Why sampling fewer tasks wouldn’t work
Further speeding things up would have required doing less work—specifically, reading less memory. One solution would be to subsample: Instead of capturing a stack for every task, we could capture stacks for a bounded number of randomly selected tasks, which is statistically correct on average. This technique is called reservoir sampling, and our profiler uses it on threads as an extra safety layer.
In the majority of cases, Python processes have few enough threads that taking a sample for each thread has low overhead. But in some cases—threading bugs is one example—threads can linger and accumulate over time, making it prohibitively expensive to capture one sample per thread, even with adaptive sampling in place.
Applying reservoir sampling to tasks would have broken our model. Because we need to build the task dependency tree to keep stacked stacks consistent, we would need to capture metadata for all tasks before we could subsample them. This alone would make the memory-copying overhead too high, meaning that lowering overhead would require going back on our product choices around profile readability.
Replacing process_vm_readv with protected memcpy
That led us to consider replacing process_vm_readv with memcpy. We had been using process_vm_readv to reduce the risk of crashing the profiled process when memory changed during sampling. This was not strictly necessary, though, since our profiler is in-process. If the goal was to safely read memory from the current process, maybe we could achieve that with a bare memcpy and additional setup.
But memcpy comes with the same drawback as reading memory directly: If the memory is released while we are accessing it, the whole Python process can crash. What if we could recover from those crashes, though?
Recovering from these crashes is possible, and somewhat common for in-process profilers. POSIX defines a sigaction utility, which can be used to catch deadly signals such as SIGSEGV and SIGBUS and change how the process responds to them. The default signal handler for SIGSEGV exits the process immediately. In most cases, trying to read or write memory that does not belong to the process indicates a bug, and crashing is the only “recovery” that makes sense.
In the profiler’s case, things are a bit different. We know we are reading memory from a live process, and there are many race conditions in which the memory slice we need to read may no longer be ours by the time we read it. When that happens because of the profiler, we want the process to effectively pretend nothing happened and, above all, avoid crashing.
You can see the implementation of this recovery mechanism in dd-trace-py.
Making memory faults safe to recover from
We made this happen as follows. When the sampler starts, it installs its signal handler—the function to call on deadly signals. As long as the sampler is not trying to read memory from the interpreter, the signal handler is disarmed: If it receives a signal, it simply forwards it to the signal handler that was installed before ours.
When the sampler calls try_memcpy, it arms the signal handler. If memcpy causes a deadly signal, our signal handler is triggered and jumps to the recovery instruction pointer. There, try_memcpy indicates that copying failed and returns an error. In that case, the default signal handler, which would crash the process, is never called, and the sampler can handle the failure by ignoring the sample, for example.
Going through the handler to recover from a deadly signal is extremely costly. When that happens, it means the profiler tried to read memory it shouldn’t have, which triggered the operating system’s memory integrity protection and crossed the kernel boundary. In that regard, it is no better—worse, actually—than process_vm_readv. However, this is only relevant when a fault occurs: If memcpy executes without faulting, try_memcpy is approximately as cheap as memcpy itself—that is to say, extremely fast even when called repeatedly.
Thankfully, the profiler rarely faults in practice: Most code objects are effectively immortal, Python interpreter frame stacks don’t churn nearly as fast as we read them, and tasks are longer-lived than the memcpy it takes to capture their metadata. The signal handler is only needed in rare cases where, for example, we attempt to read a frame at exactly the moment its Python thread frees it. That said, the sampler risks triggering those edge cases thousands of times per second, making the crash protection a necessity.
Implementing this approach was more complicated than explaining it. Other Python extensions can install signal handlers themselves—Python’s faulthandler, for one, does it—and writing the signal handler to be async-signal-safe is tricky. The result, however, was worth the complexity: It reduced the profiler’s overhead by about 50% for synchronous code while also making it practical for asynchronous code and its many memory copies.
We extensively dogfooded this change against our internal Python services before releasing it externally. This helped us build confidence that the change was not only an improvement to the profiler’s functionality, but also a net improvement to its performance and stability.
What async-aware profiling revealed in production
With async-aware profiling in production, we could investigate the performance of our internal Python services with substantially more context.
One of the first production problems we investigated with the new profiler was an incident involving the Bits Chat API. In rare cases, requests would time out, causing uvicorn to kill the worker process. The requests themselves didn’t seem abnormal: Payload sizes and shapes were reasonable, and nothing really stood out. But the profiling data showed a clear culprit. CPU time was being spent in a busy loop in pylzstr, which we used to decompress cached data.
We looked at the source code and discovered that decompression entered an infinite loop on malformed input that was sometimes returned in large language model (LLM) calls. We reported the bug and contributed the fix upstream.
Profiling of other Python services showed interesting patterns. We found a case where an internal library would make many calls to log.debug with an INFO-level logger. While this is in theory free when using %-formatting, the library would generate huge strings to pass to the logger. Generating those strings that would never be used significantly increased CPU usage. We were aware of this issue thanks to spiky CPU metrics in affected services, but we had never been able to determine their root cause—the new version of the profiler made it clear.
Teaming up with applied scientists, we had a look at some of our anomaly detection pipelines. Those services typically make heavy use of NumPy for statistical models developed in-house. Looking at profiles from related job runners showed hot Python functions that would make back-to-back calls to lower-level math functions. We tasked an AI agent with using Model Context Protocol (MCP) tools to profile relevant services and propose improved implementations benchmarked on real inputs captured through Dynamic Instrumentation. This approach yielded better implementations for data array manipulation algorithms, with CPU usage reductions ranging from about 15% to 30% across the functions we optimized. That optimization, applied to a function that accounted for 5% of the service’s total CPU, scaled to hundreds of workers, allowed us to save cores without having to process less data.
Finally, and more generally, the CPU overhead improvements themselves brought savings. Across the services where we rolled out these optimizations, we reduced profiler overhead by more than 60%. On those services, adaptive sampling had previously reached its minimum sampling frequency, resulting in lower-quality profiles. Reducing the profiler’s CPU overhead enabled higher-fidelity profiling while consuming substantially less CPU.
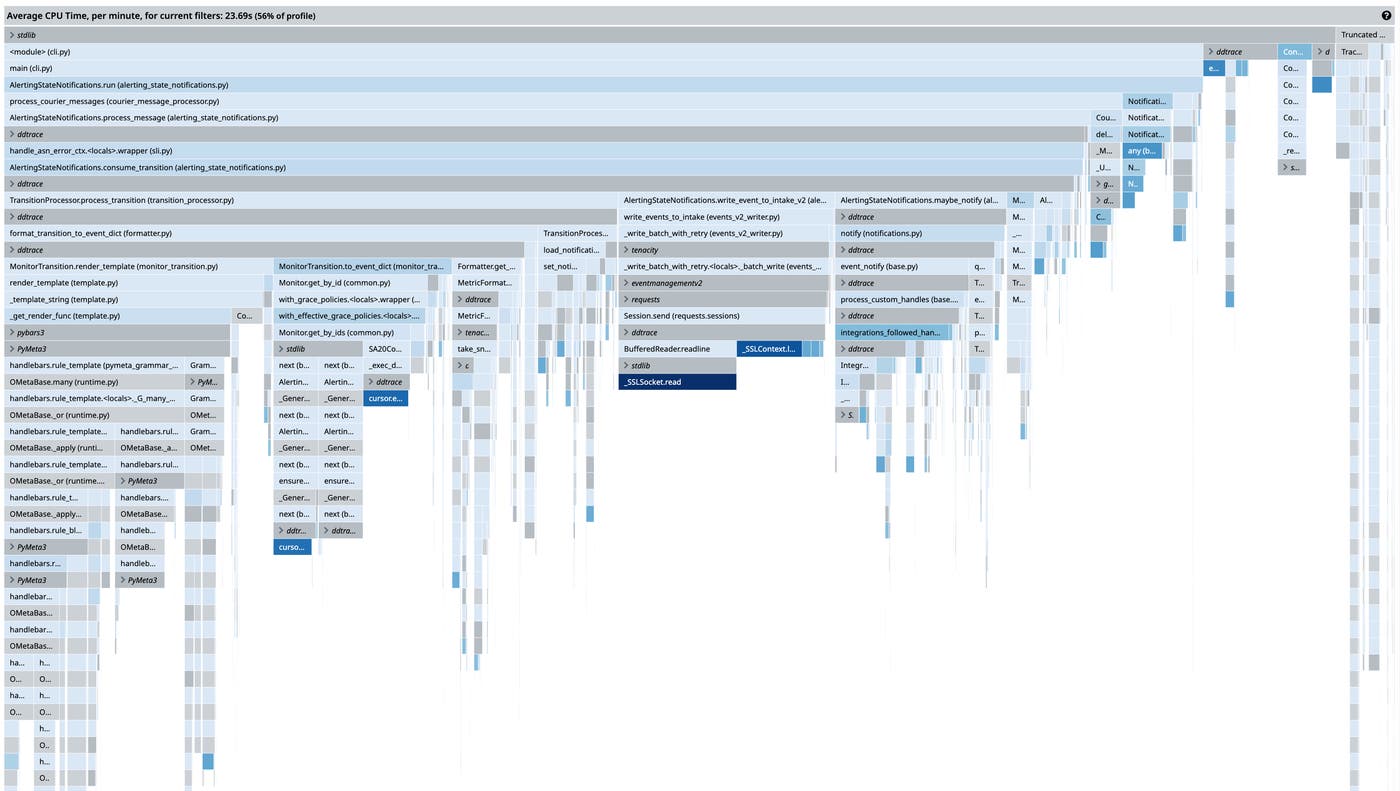
Making Python profiling async-aware
Investigating the performance of Datadog’s own services revealed the shortcomings of our Python profiler in a world where asynchronous programming is becoming the norm. Flame graphs lacked essential asynchronous call context, often making their interpretation more difficult and their data misleading for investigation purposes.
By looking at production profiles and partnering with Python developers, we designed a new model where call stacks are shown in the context of the task they belong to, including other tasks that depend on them. Where developers previously had to take guesses when attributing time to callers—or lacked enough context to attribute it reliably—they are now able to get strong signals on which parts of their code are burning CPU or more generally contributing to latency increases and performance regressions.
Implementing this new model forced us to face latent performance issues in the profiler itself, so we decided to invest time into reducing our sampling overhead. Eventually, our optimizations brought the overhead numbers below where we started, a win for asynchronous and synchronous applications alike. We are now looking to expand this approach to other areas in the profiler, to make overhead even less of a concern when instrumenting Python applications.
These improvements are available in the latest versions of ddtrace. Users can upgrade to benefit from the lower profiling overhead and higher-fidelity async profiles.
If you’re interested in solving performance and profiling challenges like these, explore our open engineering roles.
