In Parts 1 and 2 of this series, we saw that key EKS metrics come from several sources, and can be broken down into the following main types:
- Cluster state metrics from the Kubernetes API
- Node and container resource metrics from your nodes’ kubelets
- AWS service metrics from AWS CloudWatch
In this post, we’ll explore how Datadog’s integrations with Kubernetes, Docker, and AWS will let you track the full range of EKS metrics, as well as logs and performance data from your cluster and applications. Datadog gives you comprehensive coverage of your dynamic infrastructure and applications with features like Autodiscovery to track services across containers; sophisticated graphing and alerting options; and full support for AWS services.
In this post, we will cover:
- Installing the Datadog Agent across your cluster to track host- and container-level resource metrics
- Enabling Datadog’s AWS integration to collect CloudWatch metrics and events
- Using Datadog’s full feature set to get end-to-end visibility into your EKS infrastructure and hosted applications and services
If you don’t already have a Datadog account but want to follow along and start monitoring your EKS cluster, sign up for a free trial.
Deploy the Agent to your EKS cluster
The Datadog Agent is open source software that collects and forwards metrics, logs, and traces from each of your nodes and the containers running on them.
Once you deploy the Agent, you will have immediate access to the full range of Kubernetes cluster state and resource metrics discussed in Part 1. The Agent will also begin reporting additional system-level metrics from your nodes and containers.
We will go over how to deploy the Datadog Cluster Agent and node-based Datadog Agents across your EKS cluster. Note that the following instructions are tailored to monitoring Amazon EKS pods running on EC2 instances. See our documentation for instructions on deploying the Datadog Agent to any Amazon EKS pods running on AWS Fargate.
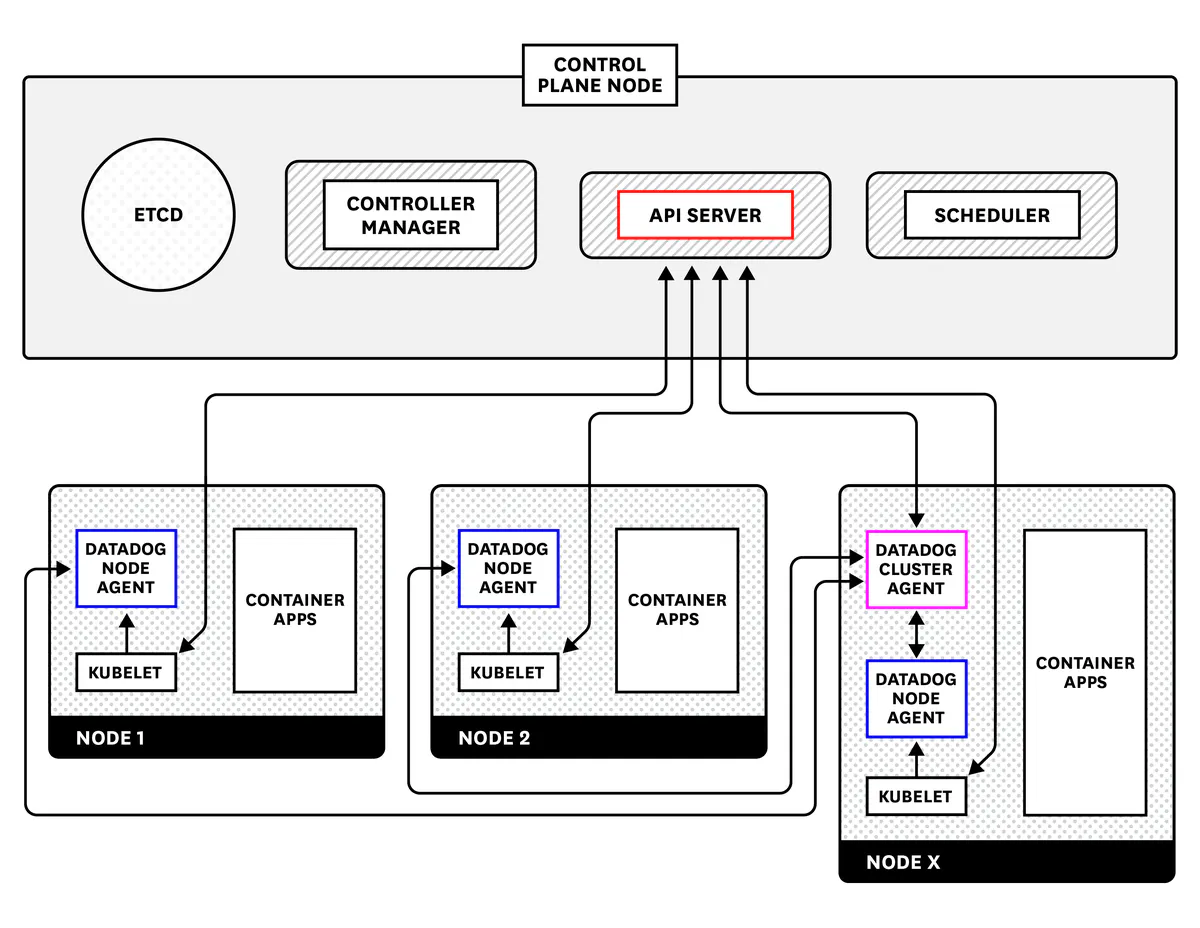
The Cluster Agent communicates with the Kubernetes API servers to collect cluster-level information, while the node-based Agents report data from each node’s kubelet.
While it is possible to deploy the Datadog Agent without the Cluster Agent, using the Cluster Agent is recommended as it offers several benefits, particularly for large-scale EKS clusters:
- It reduces overall load on the Kubernetes API by using a single Cluster Agent as a proxy for querying cluster-level metrics.
- It provides additional security because only one Agent needs the permissions required to access the API server.
- It lets you automatically scale your pods using any metric that is collected by Datadog.
You can read more about the Datadog Cluster Agent here.
Before turning to the Agent, however, make sure that you’ve deployed kube-state-metrics Recall that kube-state-metrics is an add-on service that generates cluster state metrics and exposes them to the Metrics API. After you install the service, Datadog will be able to aggregate these metrics along with other resource and application data.
Deploying the Datadog Cluster Agent
The Datadog Cluster Agent runs on a single node and serves as a proxy between the API servers and the rest of the node-based Agents in your cluster. It also makes it possible to configure Kubernetes’s Horizontal Pod Autoscaling to use any metric that Datadog collects (more on this below).
There are several steps needed to prepare your cluster for the Agent. These involve providing the appropriate permissions to the Cluster Agent and to the node-based Agents so each can access the information it needs. First, we need to configure RBAC permissions, and then create and deploy the Cluster Agent and node-based Agent manifests.
Configure RBAC permissions for the Cluster Agent and node-based Agents
EKS uses AWS IAM for user authentication and access to the cluster, but it relies on Kubernetes role-based access control (RBAC) to authorize calls by those users to the Kubernetes API. So, for both the Cluster Agent and the node-based Agents, we’ll need to set up a service account, a ClusterRole with the necessary RBAC permissions, and then a ClusterRoleBinding that links them so that the service account can use those permissions.
First, create the Cluster Agent’s RBAC file, cluster-agent-rbac.yaml:
kind: ClusterRole
apiVersion: rbac.authorization.k8s.io/v1
metadata:
  name: datadog-cluster-agent
rules:
- apiGroups:
  - ""
  resources:
  - services
  - events
  - endpoints
  - pods
  - nodes
  - componentstatuses
  verbs:
  - get
  - list
  - watch
- apiGroups:
  - "autoscaling"
  resources:
  - horizontalpodautoscalers
  verbs:
  - list
  - watch
- apiGroups:
  - ""
  resources:
  - configmaps
  resourceNames:
  - datadogtoken             # Kubernetes event collection state
  - datadog-leader-election  # Leader election token
  verbs:
  - get
  - update
- apiGroups:                 # To create the leader election token
  - ""
  resources:
  - configmaps
  verbs:
  - create
  - get
  - update
- nonResourceURLs:
  - "/version"
  - "/healthz"
  verbs:
  - get
---
apiVersion: rbac.authorization.k8s.io/v1
kind: ClusterRoleBinding
metadata:
  name: datadog-cluster-agent
roleRef:
  apiGroup: rbac.authorization.k8s.io
  kind: ClusterRole
  name: datadog-cluster-agent
subjects:
- kind: ServiceAccount
  name: datadog-cluster-agent
  namespace: default
---
kind: ServiceAccount
apiVersion: v1
metadata:
  name: datadog-cluster-agent
  namespace: default
Next, create the node-based Agent’s RBAC file, datadog-rbac.yaml:
apiVersion: rbac.authorization.k8s.io/v1
kind: ClusterRole
metadata:
  name: datadog-agent
rules:
- apiGroups:      # This is required by the agent to query the Kubelet API.
  - ""
  resources:
  - nodes/metrics
  - nodes/spec
  - nodes/proxy   # Required to get /pods
  - nodes/stats # Required to get /stats/summary
  verbs:
  - get
---
kind: ServiceAccount
apiVersion: v1
metadata:
  name: datadog-agent
  namespace: default
---
apiVersion: rbac.authorization.k8s.io/v1
kind: ClusterRoleBinding
metadata:
  name: datadog-agent
roleRef:
  apiGroup: rbac.authorization.k8s.io
  kind: ClusterRole
  name: datadog-agent
subjects:
- kind: ServiceAccount
  name: datadog-agent
  namespace: default
Deploy both of them:
$ kubectl apply -f /path/to/cluster-agent-rbac.yaml
$ kubectl apply -f /path/to/datadog-rbac.yaml
Confirm you have both ClusterRoles:
# Get a list of all ClusterRoles
$ kubectl get clusterrole
NAME                                                                   AGE
[...]
datadog-agent                                                          1h
datadog-cluster-agent                                                  1h
[...]
Secure communication between node-based Agents and the Cluster Agent
The next step is to ensure that the Cluster Agent and node-based Agents can securely communicate with each other. The best way to do this is by creating a Kubernetes secret. To generate a token to include in the secret, run the following:
echo -n '<32_CHARACTER_LONG_STRING>' | base64
Copy the resulting string. Then, create a file, dca-secret.yaml, with the following:
apiVersion: v1
kind: Secret
metadata:
  name: datadog-auth-token
type: Opaque
data:
  token: <TOKEN>
Replace <TOKEN> with the string from the previous step. Then create the secret:
$ kubectl apply -f /path/to/dca-secret.yaml
You can confirm that the secret was created with the following:
# Get a list of all secrets
$ kubectl get secret
NAME                        TYPE                                  DATA      AGE
datadog-auth-token          Opaque                                1         21h
Now that we have a secret in Kubernetes, we can include it in our Cluster Agent and node-based Agent manifests so that they can securely communicate with each other.
Create and deploy the Cluster Agent manifest
To deploy the Cluster Agent, create a manifest, datadog-cluster-agent.yaml, which creates the Datadog Cluster Agent Deployment and Service, links them to the Cluster Agent service account we deployed above, and points to the newly created secret:
datadog-cluster-agent.yaml
apiVersion: apps/v1
kind: Deployment
metadata:
  name: datadog-cluster-agent
  namespace: default
spec:
  selector:
      matchLabels:
        app: datadog-cluster-agent
  template:
    metadata:
      labels:
        app: datadog-cluster-agent
      name: datadog-agent
    spec:
      serviceAccountName: datadog-cluster-agent
      containers:
      - image: public.ecr.aws/datadog/cluster-agent:latest
        imagePullPolicy: Always
        name: datadog-cluster-agent
        env:
          - name: DD_API_KEY
            value: <YOUR_API_KEY>
          - name: DD_APP_KEY		# Optional
            value: <YOUR_APP_KEY>	# Optional
          - name: DD_COLLECT_KUBERNETES_EVENTS
            value: "true"
          - name: DD_LEADER_ELECTION
            value: "true"
          - name: DD_EXTERNAL_METRICS_PROVIDER_ENABLED
            value: "true"
          - name: DD_CLUSTER_AGENT_AUTH_TOKEN
            valueFrom:
              secretKeyRef:
                name: datadog-auth-token
                key: token
---
apiVersion: v1
kind: Service
metadata:
  name: datadog-cluster-agent
  labels:
    app: datadog-cluster-agent
spec:
  ports:
  - port: 5005 # Has to be the same as the one exposed in the DCA. Default is 5005.
    protocol: TCP
  selector:
    app: datadog-cluster-agent
Make sure to insert your Datadog API key as indicated in the manifest above. You can also include a Datadog app key. Both keys are accessible here in your Datadog account. Providing an app key is necessary if you want to autoscale your EKS applications based on any metric you’re collecting with Datadog. See below for more information on this.
The final environment variable—DD_CLUSTER_AGENT_AUTH_TOKEN—points the Cluster Agent to the datadog-auth-token secret we just created.
Note that the Datadog Cluster Agent is configured as a Deployment and Service, rather than as a DaemonSet, because we’re not installing it on every node. Deploy the Cluster Agent and Service:
$ kubectl apply -f /path/to/datadog-cluster-agent.yaml
Deploy the node-based Agent DaemonSet
The final step is to deploy the node-based Agents as a DaemonSet. We use a DaemonSet here because, unlike the Cluster Agent, we want to deploy the node-based Agent to all of our nodes, including new ones as they are launched. (You can also use nodeSelectors to install it only on a specified subset of nodes.)
Create a datadog-agent.yaml manifest file (making sure to fill in your Datadog API key):
datadog-agent.yaml
apiVersion: apps/v1
kind: DaemonSet
metadata:
  name: datadog-agent
spec:
  selector:
      matchLabels:
        app: datadog-agent
  template:
    metadata:
      labels:
        app: datadog-agent
      name: datadog-agent
    spec:
      serviceAccountName: datadog-agent
      containers:
      - image: public.ecr.aws/datadog/agent:latest
        imagePullPolicy: Always
        name: datadog-agent
        ports:
          - containerPort: 8125
            # hostPort: 8125
            name: dogstatsdport
            protocol: UDP
          - containerPort: 8126
            # hostPort: 8126
            name: traceport
            protocol: TCP
        env:
          - name: DD_API_KEY
            value: "<YOUR_API_KEY>"
          - name: DD_COLLECT_KUBERNETES_EVENTS
            value: "true"
          - name: KUBERNETES
            value: "true"
          - name: DD_KUBERNETES_KUBELET_HOST
            valueFrom:
              fieldRef:
                fieldPath: status.hostIP
          - name: DD_CLUSTER_AGENT_ENABLED
            value: "true"
          - name: DD_CLUSTER_AGENT_AUTH_TOKEN
            valueFrom:
              secretKeyRef:
                name: datadog-auth-token
                key: token
        resources:
          requests:
            memory: "256Mi"
            cpu: "200m"
          limits:
            memory: "256Mi"
            cpu: "200m"
        volumeMounts:
          - name: dockersocket
            mountPath: /var/run/docker.sock
          - name: procdir
            mountPath: /host/proc
            readOnly: true
          - name: cgroups
            mountPath: /host/sys/fs/cgroup
            readOnly: true
        livenessProbe:
          exec:
            command:
            - ./probe.sh
          initialDelaySeconds: 15
          periodSeconds: 5
      volumes:
        - hostPath:
            path: /var/run/docker.sock
          name: dockersocket
        - hostPath:
            path: /proc
          name: procdir
        - hostPath:
            path: /sys/fs/cgroup
          name: cgroups
Deploy the node-based Agent:
$ kubectl apply -f /path/to/datadog-agent.yaml
You can use the following kubectl command to verify that your Cluster Agent and node-based Agent pods are running (the -o wide flag includes more details in the output):
# Get running pods with "agent" in their name
$ kubectl get pods -o wide | grep agent
NAME                                    READY     STATUS    RESTARTS   AGE       IP                NODE
datadog-agent-44x9q                     1/1       Running   0          9d        192.168.124.130   ip-192-168-124-130.us-west-2.compute.internal
datadog-agent-8ngmb                     1/1       Running   0          9d        192.168.165.188   ip-192-168-165-188.us-west-2.compute.internal
datadog-agent-gfl98                     1/1       Running   0          9d        192.168.193.120   ip-192-168-193-120.us-west-2.compute.internal
datadog-agent-hbxqh                     1/1       Running   0          9d        192.168.182.134   ip-192-168-182-134.us-west-2.compute.internal
datadog-agent-hqbj2                     1/1       Running   0          9d        192.168.112.185   ip-192-168-112-185.us-west-2.compute.internal
datadog-agent-knd2j                     1/1       Running   0          9d        192.168.195.211   ip-192-168-195-211.us-west-2.compute.internal
datadog-cluster-agent-f797cfb54-b5qs8   1/1       Running   0          7s        192.168.248.206   ip-192-168-195-211.us-west-2.compute.internal
You should see that each node in your cluster is running a datadog-agent replica, and that one node is also running a datadog-cluster-agent pod.
Now that the Agent has been deployed to your cluster, you should see information from your EKS infrastructure automatically flowing into Datadog. This includes system-level metrics from your nodes and containers as well as metrics from Datadog’s Kubernetes and Docker integrations, which you can immediately visualize in a customizable, out-of-the-box dashboard:
Autoscale your EKS cluster with Datadog metrics
Out of the box, Kubernetes’s Horizontal Pod Autoscaler (HPA) can autoscale a controller’s replica count based on a targeted level of CPU utilization averaged across that controller’s pods. (Note that this cannot apply to a DaemonSet, as a DaemonSet automatically launches a pod on each available node.) As of version 1.10, Kubernetes also supports autoscaling based on custom metrics so long as you have configured an External Metrics Provider resource that can communicate with the Kubernetes API server. The Datadog Cluster Agent can act as an External Metrics Provider, meaning that if you are using the Cluster Agent to monitor your EKS infrastructure, you can deploy an HPA that will autoscale your pods based on any metric collected by Datadog.
In the screenshot below, we’ve deployed an HPA that will monitor requests per second to pods running NGINX across our cluster, averaged by pod. If this metric crosses a threshold, it will spin up new NGINX pods in our cluster until the average requests per second per pod falls below the threshold, or the number of running pods meets the maximum limit we defined in the HPA manifest.
Deploying HPAs can help your cluster automatically respond to dynamic workloads by spinning up new pods, for example, to add resource capacity or to distribute requests. Find more information about deploying an HPA using Datadog metrics in our blog post.
Collect, visualize, and alert on Amazon EKS metrics in minutes with Datadog.
Enable Datadog’s AWS integrations
So far, we have covered how to use Datadog to monitor Kubernetes and Docker. But as we discussed in Part 1, that’s only part of the EKS story; you will also want to monitor the performance and health of the various infrastructure components in your cluster that are provisioned from AWS services, such as EBS volumes, ELB load balancers, and others.
Datadog’s AWS integration pulls in CloudWatch metrics and events so that you can visualize and alert on them from a central platform, even if you don’t install the Datadog Agent on your nodes. Datadog automatically collects any tags that you add in AWS as well as metadata about each AWS component. For example, your EC2 metrics will be tagged with the instance type, availability zone, Auto Scaling group, etc. Having these tags in Datadog lets you easily find and drill down to the specific cluster components you are interested in.
Get access to CloudWatch
Datadog needs read-only access to your AWS account in order to query CloudWatch metrics. To do this, create a new role in the AWS IAM Console and attach a policy that has the required permissions to query the CloudWatch API for metrics. You may also need to grant additional permissions to access data from any AWS services you want to monitor. See Datadog’s documentation for detailed instructions on this process.
Configure Datadog’s AWS integration
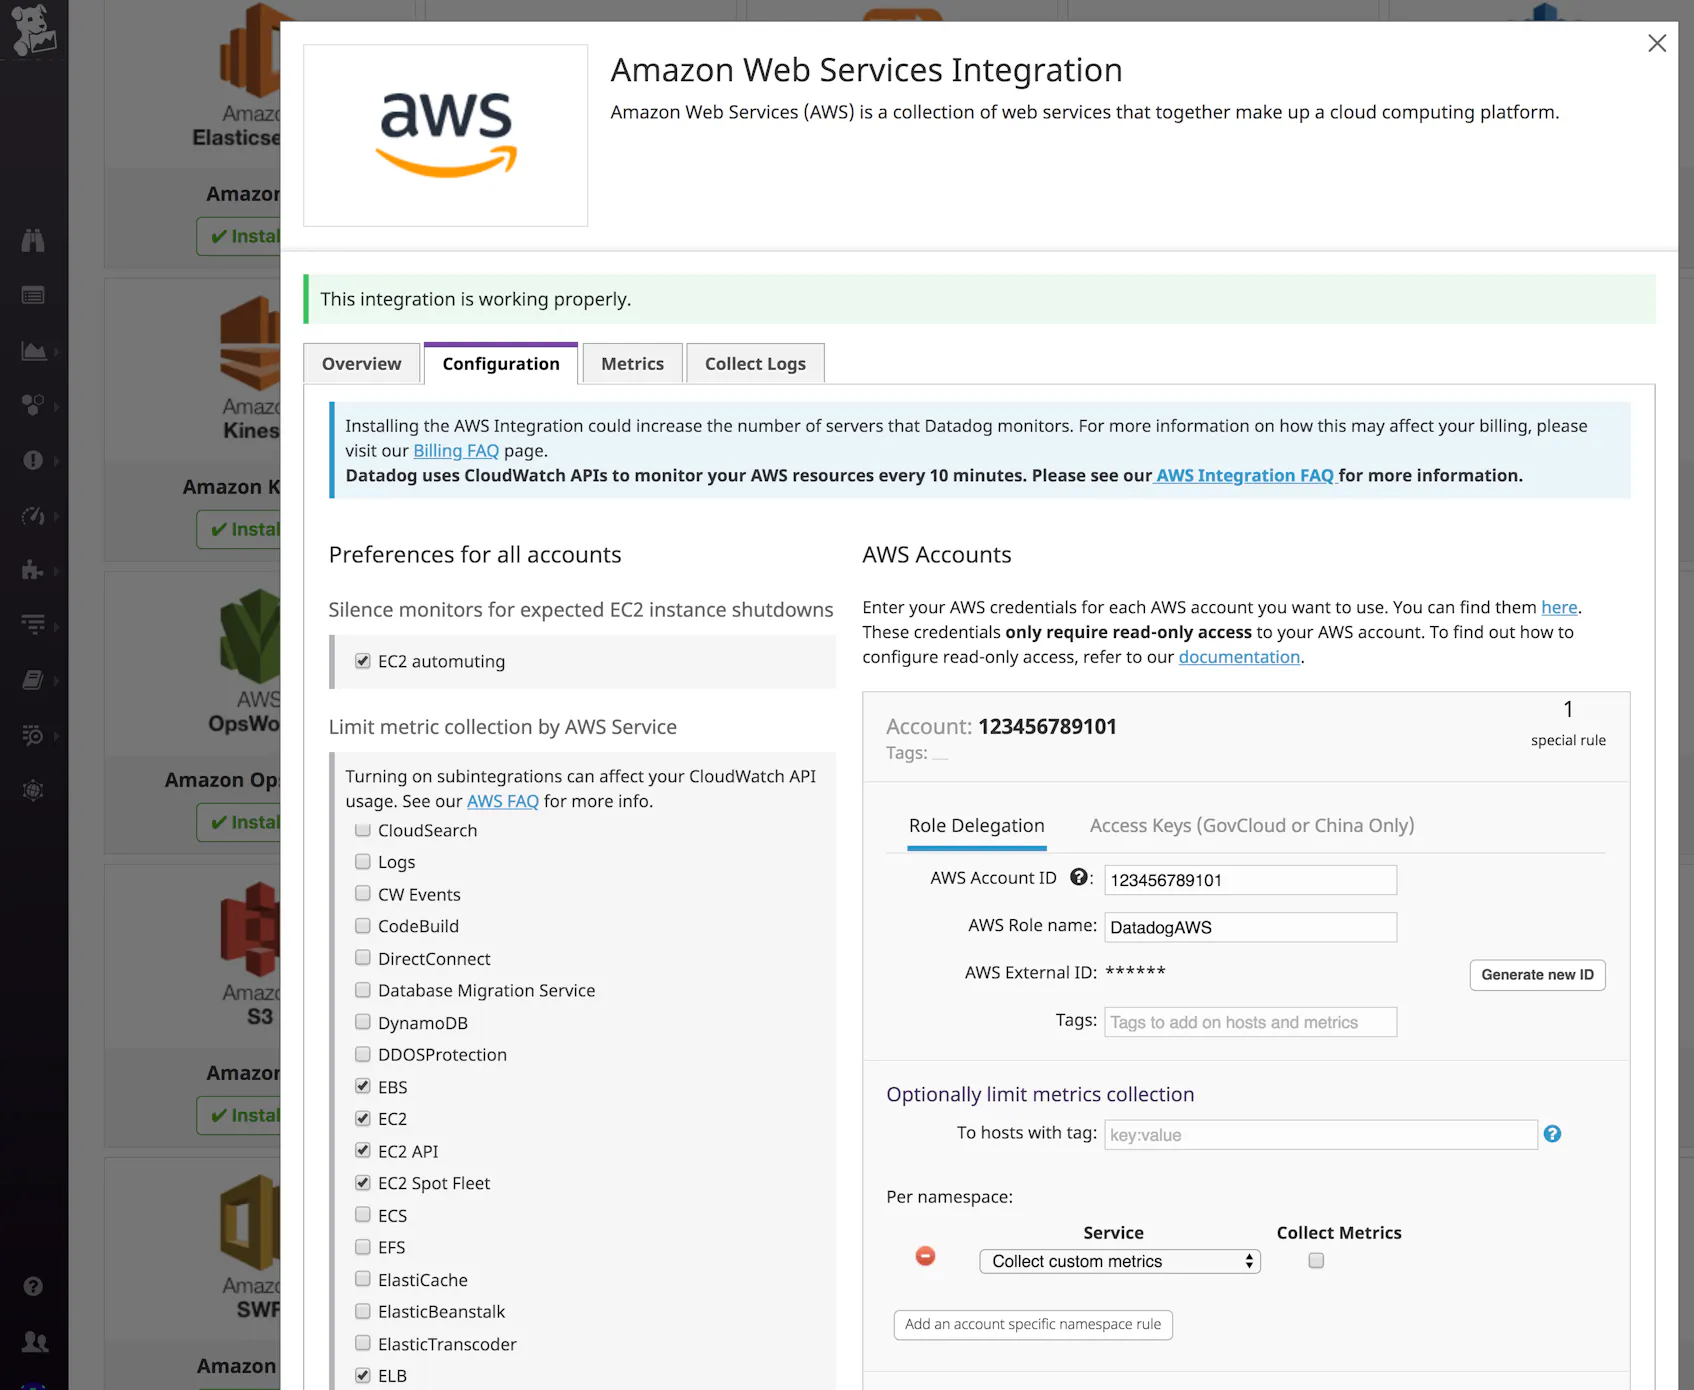
Once you’ve created the required role, go to Datadog’s AWS integration tile. Enter your AWS account ID and the name of the role you created in the previous step. Under “Limit metric collection,” check off the AWS services you want to monitor with Datadog. For our EKS cluster, we want to make sure to collect at least EC2 metrics. Here, you can see that we will also collect metrics from our EBS volumes and Elastic Load Balancers.
Once you’ve enabled the integrations for the services you want to monitor, Datadog will begin pulling in those metrics so you can view, correlate, and alert on them along with all your other data. Datadog includes customizable, out-of-the-box dashboards for many AWS services, and you can easily create your own dashboards to focus on the metrics that are most important to your organization.
Datadog will also import AWS event information for certain services. Events include, for example, scheduled maintenance for EC2 instances, or Auto-Scaling triggers for starting or terminating instances. Viewing these alongside Kubernetes events can give you a better picture of what is going on with your cluster’s infrastructure.
The full power of Datadog
With the Datadog Agent and AWS integrations working, you now have access to all of the metrics covered in Part 1 of this series. Now, we’ll go over how to use Datadog to get full visibility into your EKS cluster and the applications and services running on it. This includes:
- Detailed tagging for filtering and sorting
- Powerful visualization and real-time monitoring features
- Autodiscovery to automatically identify what’s running on your containers
- Enabling log, trace, process, and custom metric collection
- Sophisticated alerting options
The beauty of tags
Datadog automatically imports metadata from Kubernetes, Docker, AWS services, and other technologies, then creates tags from that metadata. This makes it easier to visualize and alert on your metrics, traces, and logs at a more granular level. For example, you can filter and view your resources by Kubernetes Deployment (kube_deployment) or Service (kube_service), or by Docker image (image_name). Datadog also automatically pulls in any host tags from your EC2 instances (both those attached by AWS and any custom tags), so you can view your nodes by availability zone or by EC2 instance type.
In your node-based Datadog Agent manifest, you can add custom host-level tags with the environment variable DD_TAGS followed by key:value pairs separated by spaces. For example, below we’ve added two tags that will be applied to all nodes in your cluster that the Agent is deployed on:
[...]
env:
  - name: DD_TAGS
    value: owner:maxim role:eks-demo
[...]
You can also import Kubernetes pod labels as tags. This lets you pull pod-level metadata that you define in your manifests into Datadog as tags. For example, you may label certain pods related to a specific application and then filter down in Datadog to visualize the infrastructure for that application.
Visualize your EKS cluster
Once the Datadog Agent has been deployed to your cluster, you should be able to see information about your EKS infrastructure flowing into Datadog. You should also be able to quickly drill down into specific sets of containers by using tags to sort and filter by pod, deployment, service, and more.
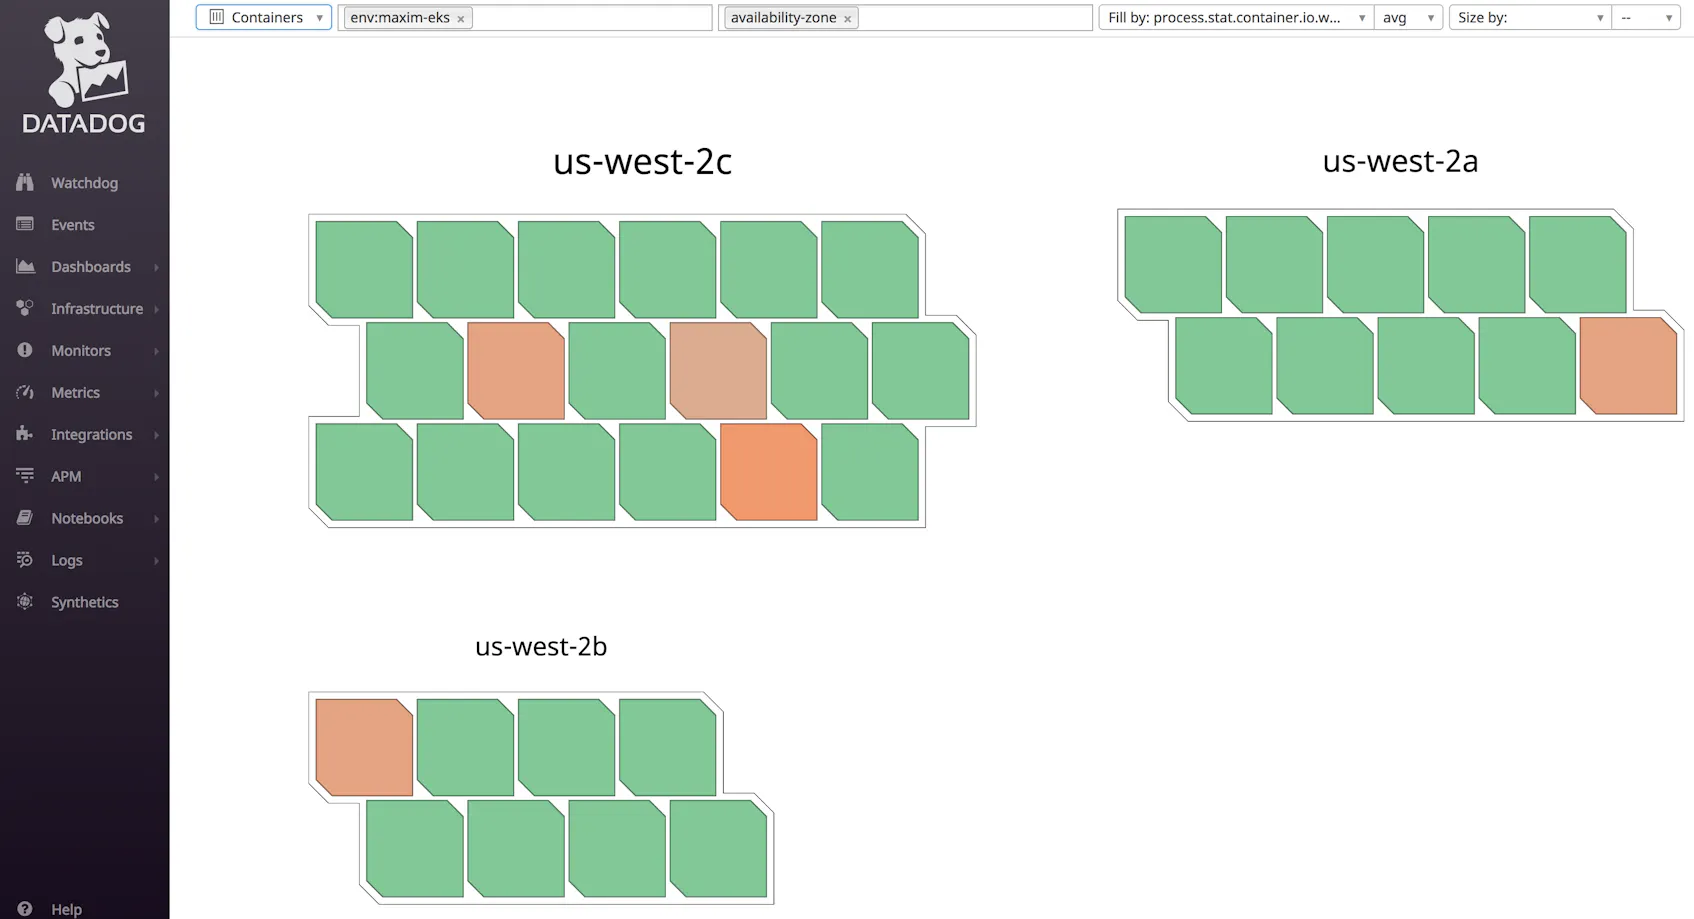
The host map gives you a high-level view of your nodes. You can group and filter your nodes by host-level tags, such as AWS availability zone or instance types, and the host map will fill them in based on the real-time value of any metric being collected on those nodes. This lets you see at a glance if, for example, one of your nodes is using higher levels of CPU than others, or if a particular zone is getting more requests than others.
Datadog’s container map view provides similar insights into your container fleet. Datadog updates the map every few seconds to reflect changes, such as containers being launched or terminated.
Similarly, Datadog’s Live Container view gives you real-time insight into the status and performance of your containers, updated every two seconds. You can also sort your containers by resource usage to quickly surface resource-heavy containers.
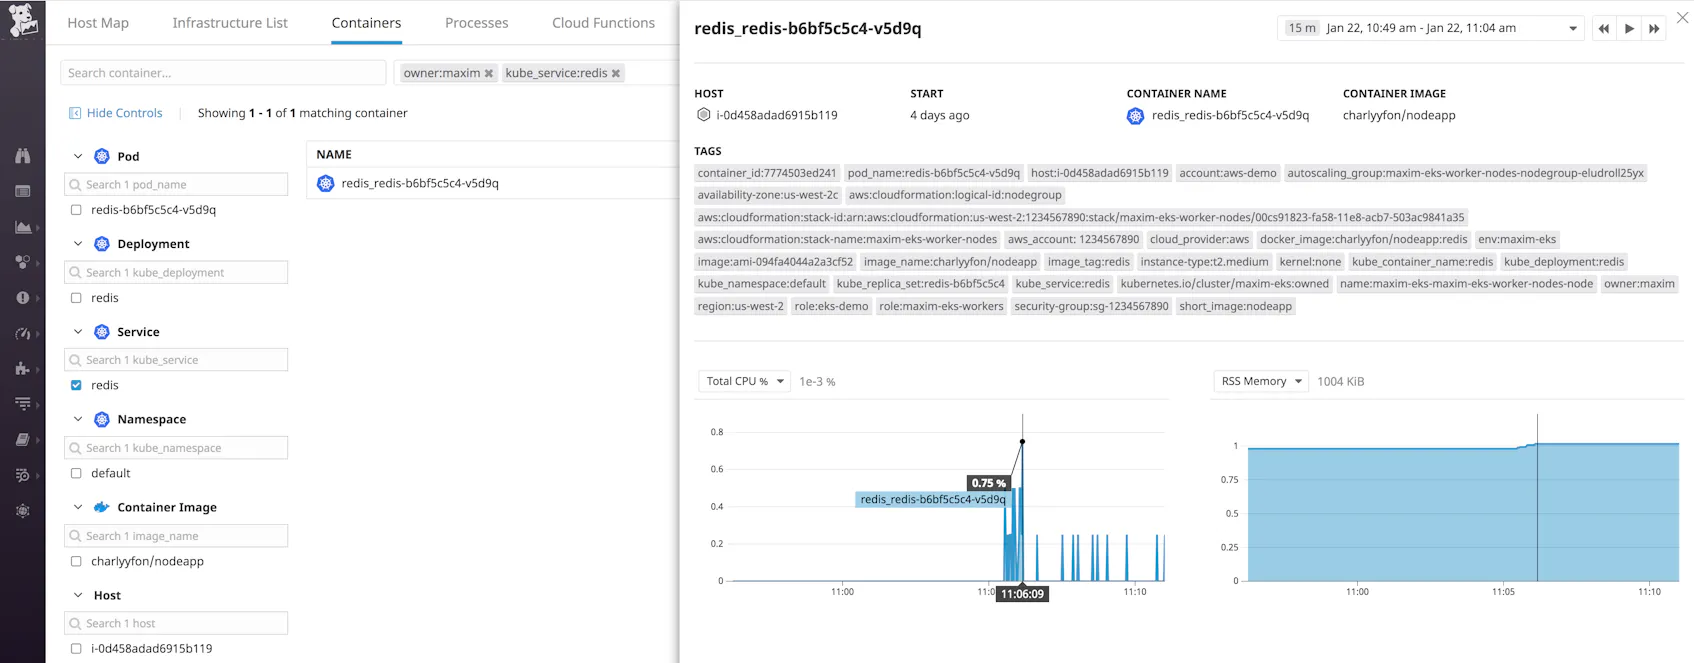
Tags let you filter for specific sets of containers—for example, Kubernetes pods, deployments, or services—to get more granular insights into your EKS cluster. Below, we have drilled down to a container by a host tag (owner:maxim) and then by the service it’s running (kube_service:redis). You can also get additional context by looking at the other tags from different sources that Datadog has automatically applied to the container.
Autodiscover your EKS cluster
Monitoring dynamic infrastructure can be difficult as containers churn—along with the applications and services running on them. The Datadog Agent’s Autodiscovery feature solves this problem by continuously listening for Docker events related to the creation and destruction of containers. When new containers are launched, the Agent identifies if they are running a service Datadog should be monitoring. If so, the Agent then automatically configures and runs the appropriate check.
Autodiscovery is active by default. When you deploy a service (e.g., Redis) to your cluster, you can include pod annotations that will provide the information Autodiscovery needs to detect and monitor that service on any containers that are launched with a specific name. These annotations all begin with the following format:
ad.datadoghq.com/<CONTAINER_IDENTIFIER>
The container identifier tells Datadog what to look for in the names of new containers. So, let’s say we want the Datadog Agent to automatically detect whenever a container is running Redis, and configure a check to start collecting Redis metrics from that container. We can add the following annotations to our Redis deployment manifest:
annotations:
  ad.datadoghq.com/redis.check_names: '["redisdb"]'
  ad.datadoghq.com/redis.init_configs: '[{}]'
  ad.datadoghq.com/redis.instances: '[{"host": "%%host%%","port":"6379"}]'
These annotations ensure that Datadog will recognize that any new containers with the container identifier redis set as their name in the deployment manifest are built from the redis image. Datadog will then enable its Redis monitoring check (redisdb) and query port 6379 of that container’s local host IP for metrics.
For information that may change often in a containerized environment, like host IPs and container ports, it’s helpful to use template variables so that the Agent can dynamically detect and communicate this information. In this case, the template variable, %%host%%, will auto-detect the host IP. Note that if a container is named something other than redis, Autodiscovery will not include it in this check, even if it is built from the same image. See the documentation for more information on configuring Autodiscovery.
Processes and logs and traces and custom metrics (oh my)
Datadog’s Agent will automatically collect metrics from your nodes and containers. To get even more insight into your cluster, you can also have Datadog collect process-level data from your containers, as well as logs, request traces, and custom metrics from the applications on your cluster.
These features are not configured by default, but you can easily enable them by adding a few more configurations to your Datadog Agent manifest (not the Cluster Agent manifest if you are using the Cluster Agent). We will cover how to collect:
Monitor your processes in real time
With Datadog’s Process Monitoring, you can get real-time, granular insight into the individual processes running on your hosts and containers. To enable it, you’ll need to make a few updates to your node-based Datadog Agent manifest (datadog-agent.yaml).
Under env, include:
env:
  [...]
  - name: DD_PROCESS_AGENT_ENABLED
    value: "true"
Then, add the required volume mount and volume:
volumeMounts:
  [...]
  - name: passwd
    mountPath: /etc/passwd
    readOnly: true
  [...]
volumes:
  [...]
  - hostPath:
      path: /etc/passwd
    name: passwd
Deploy the changes:
$ kubectl apply -f /path/to/datadog-agent.yaml
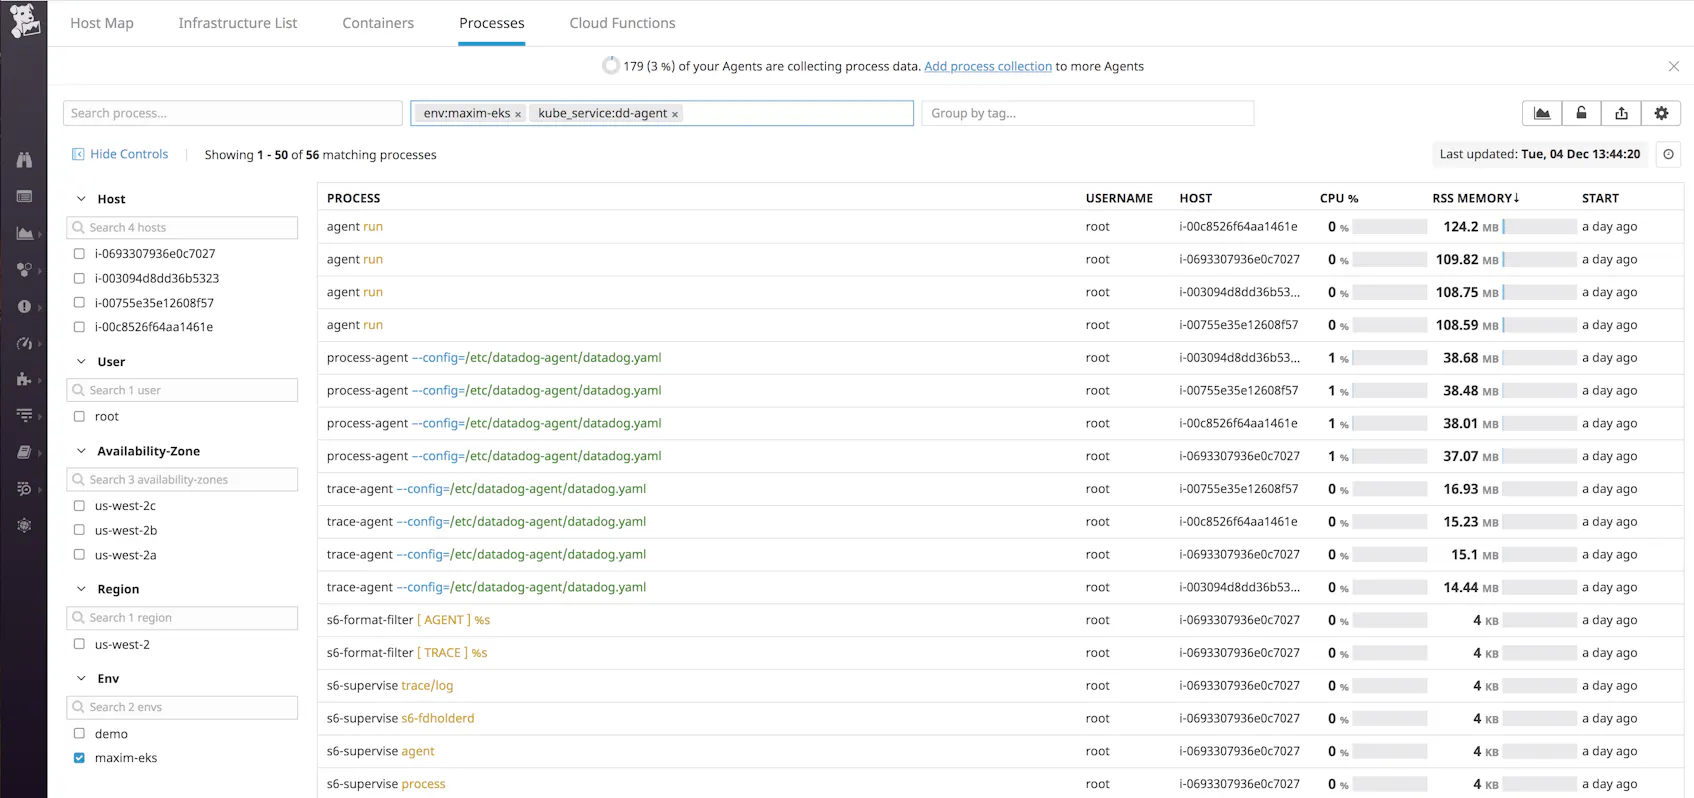
With Process Monitoring enabled, you can navigate to Datadog’s Live Process view to visualize all running processes in your cluster. You can use tags to easily filter, search, and drill down to see the exact data you need. For example, in the screenshot below, we’re looking at process information for the dd-agent Kubernetes service across any nodes or pods that are in the maxim-eks environment.
See our documentation for more details on using Live Process Monitoring.
Collect and analyze EKS logs
Datadog can automatically collect logs for Docker, many AWS services, and other technologies you may be running on your EKS cluster. Logs can be invaluable for troubleshooting problems, identifying errors, and giving you greater insight into the behavior of your infrastructure and applications.
In order to enable log collection from your containers, add the following environment variables:
env:
  [...]
  - name: DD_LOGS_ENABLED
    value: "true"
  - name: DD_LOGS_CONFIG_CONTAINER_COLLECT_ALL
    value: "true"
Then, add the following to volumeMounts and volumes:
volumeMounts:
  [...]
  - name: pointerdir
    mountPath: /opt/datadog-agent/run
  [...]
volumes:
  [...]
  - hostPath:
      path: /opt/datadog-agent/run
    name: pointerdir
Deploy (or redeploy) the manifest:
$ kubectl apply -f /path/to/datadog-agent.yaml
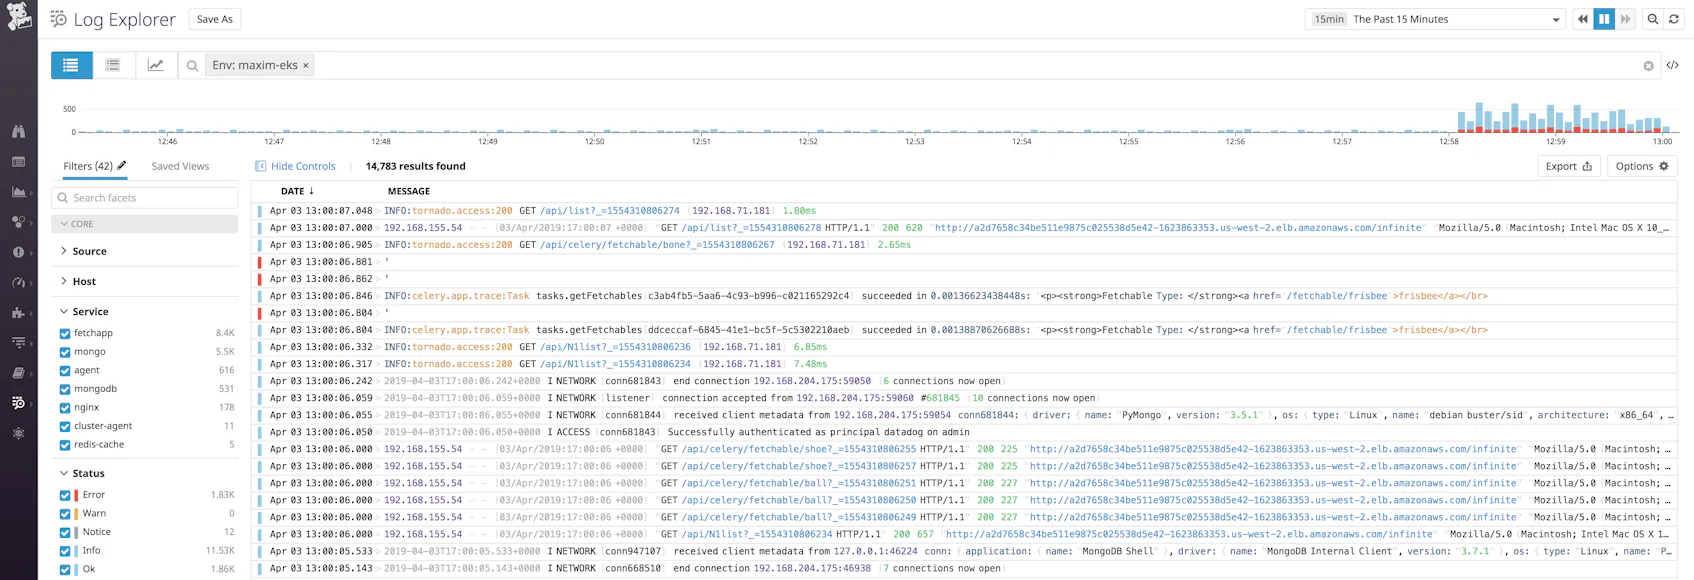
With log collection enabled, you should start seeing logs flowing into the Log Explorer.
With Datadog’s log integrations, you can automatically ingest, process, and parse logs from a variety of technologies for analysis and visualization. It’s particularly useful to ensure your logs have a source tag and a service tag attached to your logs. The source sets the context for the log, letting you pivot from metrics to related logs. It also tells Datadog which log processing pipeline to use to properly parse key attributes from your logs, such as the timestamp and the severity.
Likewise, if you have Datadog APM enabled, the service tag lets you pivot seamlessly from logs to application-level metrics and request traces from the same service, for more detailed troubleshooting. As of the Datadog Agent version 6.8, Datadog will attempt to automatically generate these tags for your logs from the image name. For example, logs from our Redis containers will be tagged source:redis and service:redis. You can also provide custom values by including the following Kubernetes annotation in the manifest for the service you are deploying to your cluster:
annotations:
  ad.datadoghq.com/<CONTAINER_IDENTIFIER>.logs: '[{"source":"<SOURCE>","service":"<SERVICE>"}]'
For example, let’s say our application uses a service, redis-cache. When we deploy Redis to our cluster, we can tell Datadog to ingest Redis logs from pods running that service using the following annotation:
ad.datadoghq.com/redis.logs: '[{"source": "redis","service":"redis-cache"}]'
This tells Datadog’s Autodiscovery to look for containers identified by redis and tag logs coming from them with source:redis and service:redis-cache.
Track application performance
Datadog APM traces individual requests as they propagate across your nodes, containers, and services. You can then use Datadog to visualize the full lifespan of these requests, end to end. This gives you deep visibility into your services, endpoints, and database queries and quickly surfaces errors and latency issues.
Datadog APM includes support for auto-instrumenting applications; consult the documentation for supported languages and details on how to get started.
First, enable tracing in the Datadog Agent by adding the following environment variable to your Datadog Agent manifest:
env:
  [...]
  - name: DD_APM_ENABLED
    value: "true"
Then, uncomment the hostPort for the Trace Agent so that your manifest includes:
ports:
  - containerPort: 8126
    hostPort: 8126
    name: traceport
    protocol: TCP
Apply the changes:
$ kubectl apply -f /path/to/datadog-agent.yaml
Next, we have to ensure that our application containers send traces only to the Datadog Agent instance running on the same node. This means configuring the application’s Deployment manifest to provide the host node’s IP as an environment variable using Kubernetes’s Downward API. We can do this with the DATADOG_TRACE_AGENT_HOSTNAME environment variable, which tells the Datadog tracer in your instrumented application which host to send traces to.
In the Deployment manifest for your application containers, ensure you have the following in your container specs:
spec:
      containers:
      - name: <CONTAINER_NAME>
        image: <CONTAINER_IMAGE>:<TAG>
        env:
          - name: DATADOG_TRACE_AGENT_HOSTNAME
            valueFrom:
              fieldRef:
                fieldPath: status.hostIP
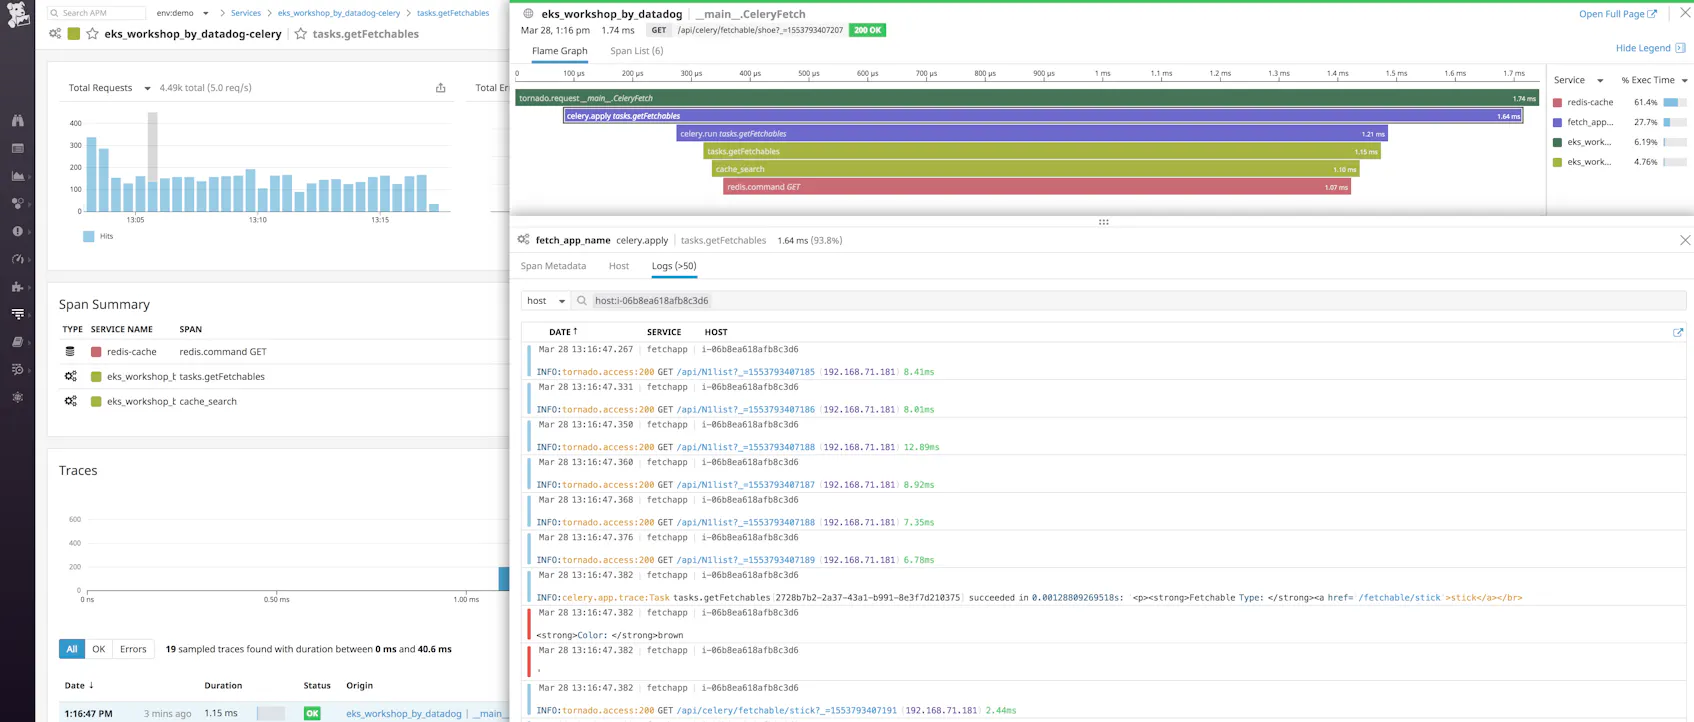
When you deploy your instrumented application, it will automatically begin sending traces to Datadog. From the APM tab of your Datadog account, you can see a breakdown of key performance indicators for each of your instrumented services, with information about request throughput, latency, and errors.
Dive into an individual trace to inspect a flame graph that breaks that traced request down into spans. Spans represent each individual database query, function call, or operation executed over the lifetime of the request. If you select a span, you can view system metrics as well as relevant logs from the host that executed that span of work, scoped to the same timeframe.
Report custom metrics
In addition to the metrics that you get through Datadog’s integrations, you can send custom metrics from your applications running on your EKS cluster to Datadog using the DogStatsD protocol. Datadog provides or supports a number of libraries you can use to emit custom metrics from your applications.
The Agent DaemonSet manifest in our deployment steps above includes a hostPort, 8125, which is the default port that DogStatsD listens on. Uncomment that line so that your manifest has the following:
ports:
  - containerPort: 8125
    hostPort: 8125
    name: dogstatsdport
    protocol: UDP
Deploy or redeploy the Agent:
$ kubectl apply -f /path/to/datadog-agent.yaml
You can now instrument your applications to send custom metrics on port 8125 of the node they are running on.
Be alert(ed)
Datadog provides a number of powerful alerts so that you can detect possible issues before they cause serious problems for your infrastructure and its users, all without needing to constantly monitor your cluster. These alerts can apply to any of the metrics, logs, or APM data that Datadog collects. This means that you can set alerts not just on the EKS cluster itself but also on the applications and services running on it. Using tags, you can set different alerts that are targeted to specific resources.
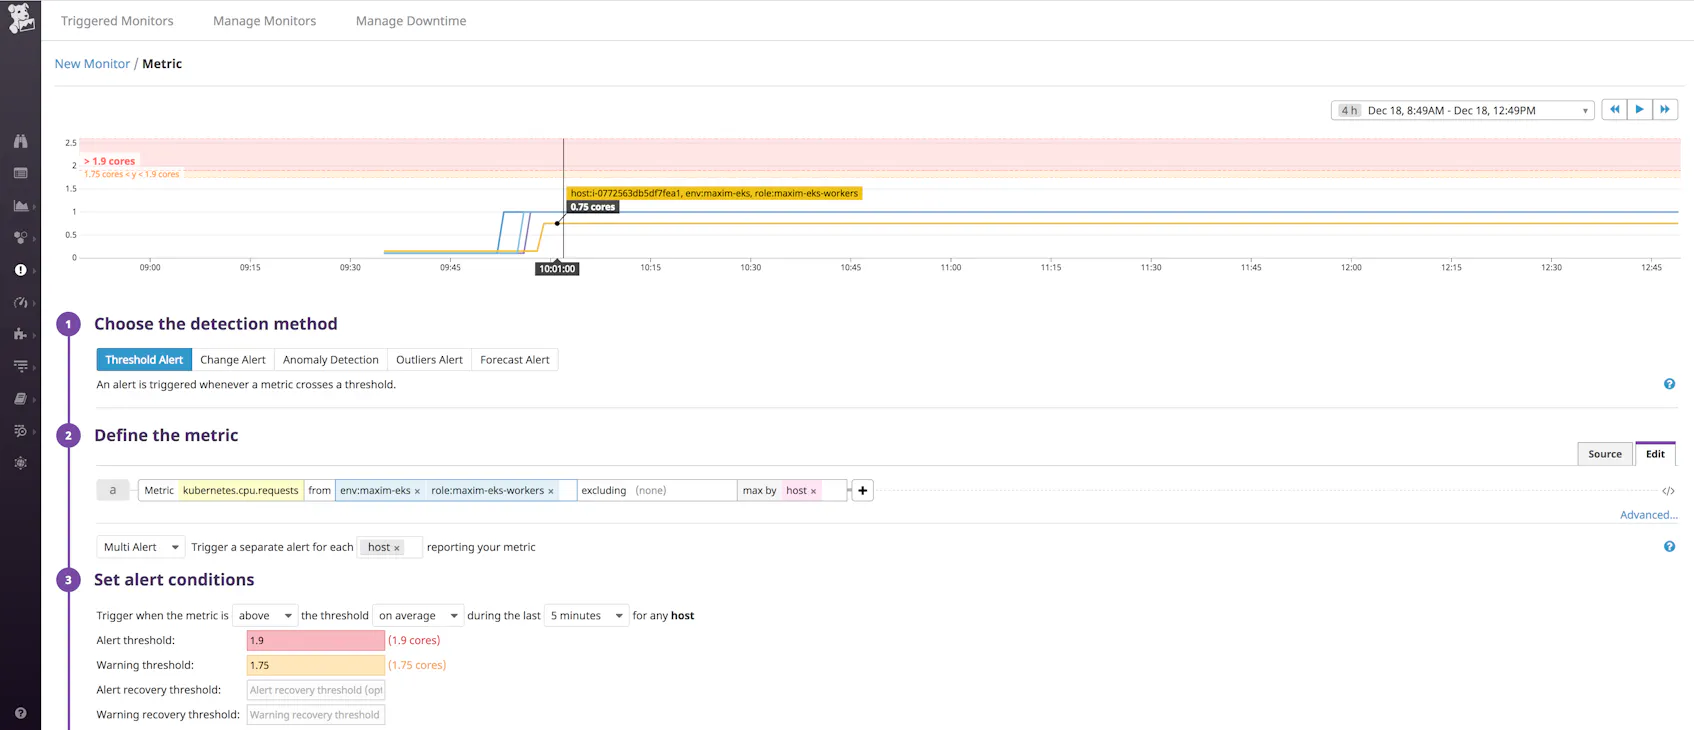
As an example, below we’re setting a threshold alert that monitors a Kubernetes metric, CPU requests, measured per node. We’re also limiting this alert to nodes in our cluster that are tagged as being maxim-eks-workers and that are part of the maxim-eks environment. We know that the instance type for these nodes has a maximum CPU capacity of two vCPUs, or two cores, so we can set the alert thresholds to notify us when the total CPU requests on any single node begin to approach that limit. If we get alerted, this will give us enough time to see if we need to spin up more nodes to avoid problems launching new pods.
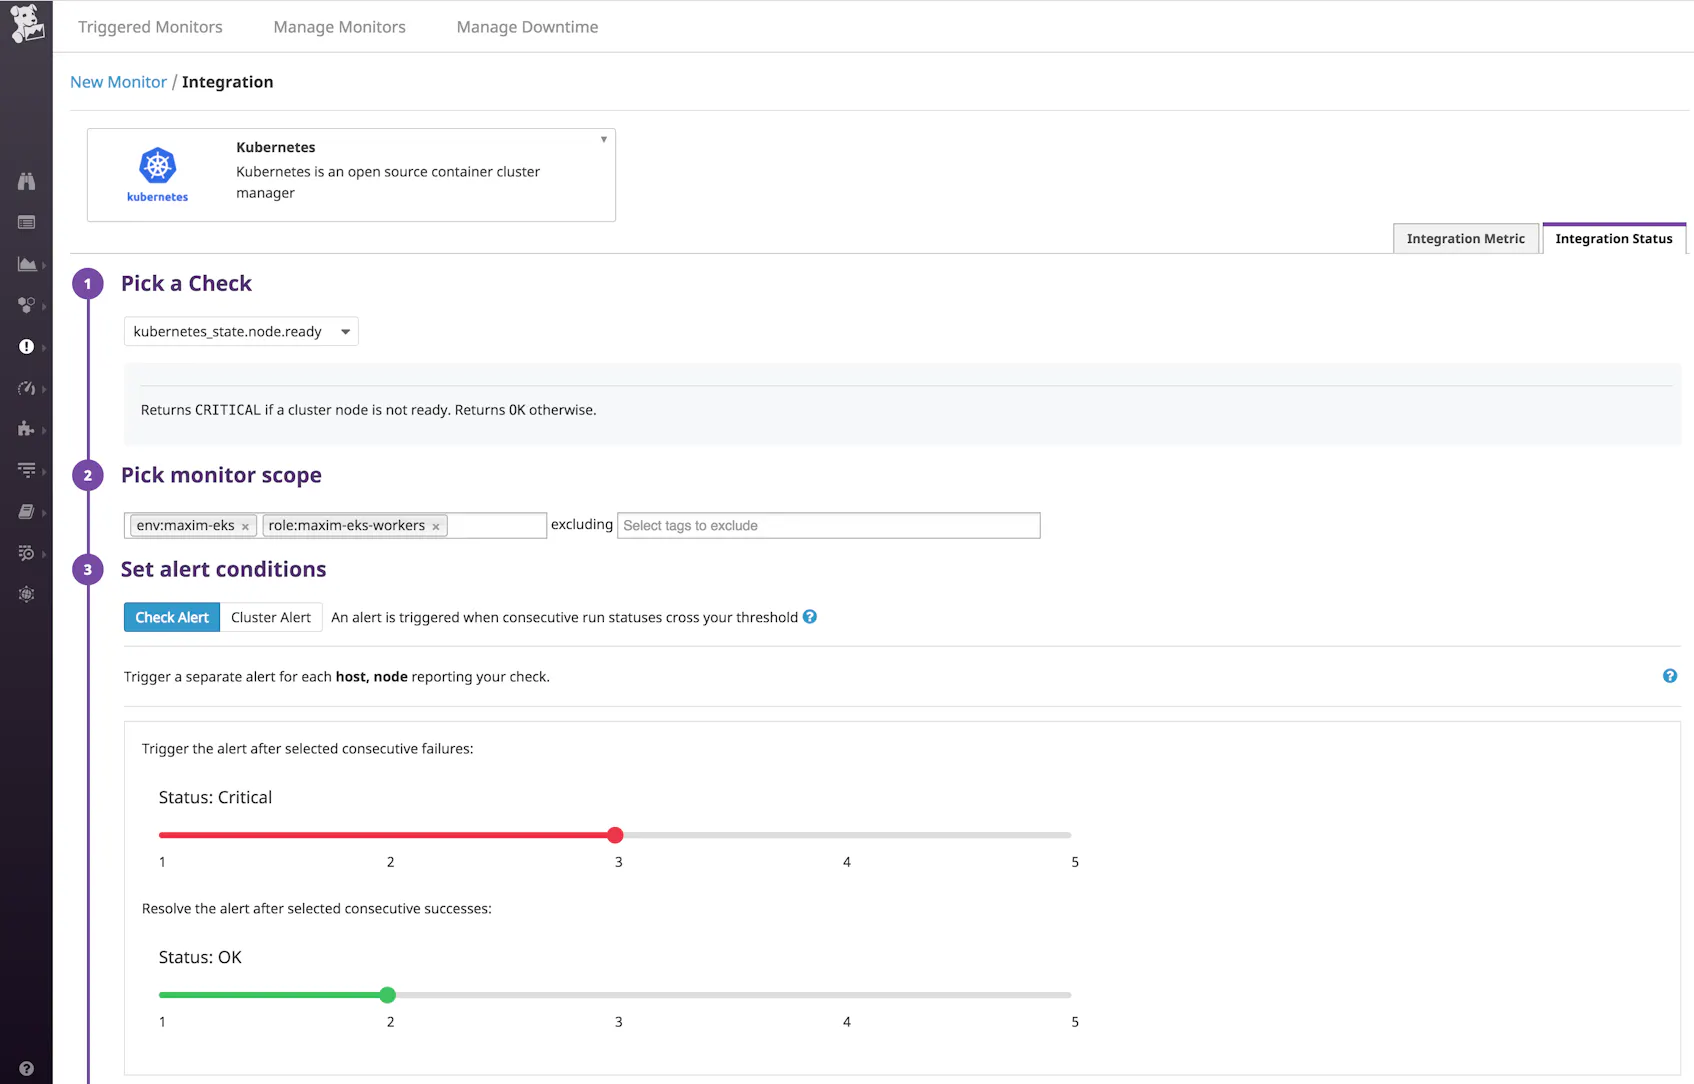
Datadog includes a number of checks based on Kubernetes indicators, such as node status, which you can also use to define alerts. So for example, below we’re looking at the same group of nodes as before, but this time we’re setting an alert to notify us when any of the nodes in that group fails the check three consecutive times (to give EKS a chance to reload the nodes if possible). The alert will automatically resolve if the same node passes the check two consecutive times.
Add smarts to your alerts
In addition to threshold alerts tied to specific metrics, you can also create machine-learning-driven alerts. For example, forecasting tracks metric trends in order to predict and reveal possible future problems. You can create a forecast alert to predict when, based on historical data, available disk space on a PersistentVolume will fall below a certain threshold, providing ample time to add resources before you actually run out of disk space.
Datadog’s Watchdog automatically detects anomalies in your application performance metrics without any manual configuration, surfacing abnormal behavior in services across your infrastructure.
Datadog alerts integrate with notification services like PagerDuty and Slack, letting you easily notify the right teams. You can read more about how to use Datadog’s alerts in our documentation.
Dive deeper into your EKS cluster
In this post, we’ve gone over how to use Datadog to gain deep visibility into your EKS cluster and the applications running on it. The Datadog Agent aggregates Kubernetes state metrics and host- and container-level resource metrics from all of the nodes in your cluster. Enabling Datadog’s AWS integrations lets you pull in CloudWatch metrics and events across your AWS services. These together with Datadog’s Autodiscovery allow you to monitor, visualize, and alert on all of the key EKS metrics as well as logs, distributed request traces, and other data across a dynamic, containerized environment.
If you don’t yet have a Datadog account, you can sign up for a 14-day free trial and start monitoring your EKS clusters today.
Acknowledgment
We wish to thank our friends at AWS for their technical review of this series.
Source Markdown for this post is available on GitHub. Questions, corrections, additions, etc.? Please let us know.


