Guy Arbitman
Monitoring HTTP sessions offers a potentially powerful way to gain visibility into your web servers, but in practice, doing so can be complex and resource-intensive. Extended Berkeley Packet Filter (eBPF) technology allows you to overcome these challenges, giving you a simple and efficient way to process application-layer traffic for your troubleshooting needs.
In this post, we’ll cover:
- The challenges of monitoring HTTP sessions with typical network capture tools such as tcpdump
- What eBPF is and how it overcomes these challenges
- How you can build an eBPF-based protocol tracer to capture production traffic with minimal difficulty and low overhead
Challenges with monitoring HTTP sessions
When you notice that an HTTP server is behaving unexpectedly, it’s not always easy to determine what’s causing the problem. You might typically begin troubleshooting by reviewing configuration settings or sifting through log entries for insights. But if these initial investigations do not shed sufficient light on the issue, you might next start thinking about how you can inspect HTTP traffic to gather more information.
Reviewing the details within request-and-response threads that make up HTTP sessions can indeed provide crucial information about the problems affecting your HTTP server. But in practice, analyzing HTTP session data is complicated, and the most common methods for capturing network traffic are of limited use for this purpose.
Tcpdump, for example, is one of the most common solutions for capturing traffic in production. But instead of neatly displaying HTTP sessions for you to analyze, tcpdump merely gives you hundreds of megabytes (or even gigabytes) of separate packets that you then need to comb through and piece together as sessions.
An alternative to using tcpdump would be to add an algorithm to your source code that automatically sorts and displays information about HTTP sessions. However, this method would require you to instrument your production code, and processing all HTTP traffic in this way would cause a significant performance hit.
This is precisely where eBPF comes in. Released in 2014, eBPF is a mechanism for Linux applications to execute code in the Linux kernel space. With eBPF, you can create a powerful traffic capturing tool with capabilities that go far beyond those of standard tools. More specifically, eBPF allows you to add multiple filtering layers and to capture traffic directly from the kernel. These capabilities restrict output to relevant data only, enabling you to process and filter your application traffic with only a limited effect on performance, even when throughput is high.
What exactly is eBPF?
To better understand eBPF, it helps to know a little about the original or classic Berkeley Packet Filter (BPF). BPF defines a type of packet filter, implemented as a virtual machine, that can run in the Linux kernel. Before BPF, packet filters ran only in user space, which was much more CPU-intensive than kernel-level filtering. BPF has typically been used for programs that need to capture and analyze packets efficiently. It is what allows tcpdump, for example, to filter out irrelevant packets very quickly.
Note, however, that BPF’s (and therefore tcpdump’s) ability to handle packets very quickly is not sufficient for handling HTTP sessions. BPF allows you to inspect the payload of individual packets. An HTTP session, on the other hand, is generally composed of multiple TCP packets, so it requires more complex processing of traffic at layer 7 (the application layer). BPF doesn’t provide a way to handle this type of filtering.
The eBPF extension to BPF was created for this very purpose. This newer technology lets you add hooks to kernel system calls (syscalls) and functions, including network-related functions, to provide visibility into traffic payloads and function results (success/failure). As a result, with eBPF, you can enable complex functionality and processing of network traffic, including layer-7 filtering, independently of the application sending data to the kernel. Thanks to eBPF, in fact, many companies can now offer security and observability features without even requiring you to instrument your server-side code—or know much about that code at all. For more information about eBPF, you can visit the project’s page at ebpf.io.
Now that we have covered what eBPF is and what it enables us to do, we can get started on building an eBPF protocol tracer.
Building an eBPF-based traffic capturer
In this walkthrough, we will use eBPF to capture the network traffic processed by a REST API server written in Go. As is typical with eBPF code, our capture tool will include a kernel agent that performs the hooking of syscalls and a user-mode agent that handles the events being sent from the kernel via the hooks.
Note
The walkthrough is inspired by Pixie Lab’s eBPF-based data collector, and the example code snippets are taken from the Pixie tracer public repo. The full code for the walkthrough can be found here. The code snippets below represent key sections only, for simplicity.
To perform this walkthrough, we’ll need a machine running any basic Linux distro, such as Ubuntu or Debian, with the following components installed:
- The BPF Compiler Collection (BCC) toolkit. Follow the installation guide here.
- Golang version 1.16+. Follow the installation guide here.
For simplicity, we have created a Docker container (Debian-based) with the dependencies above. Check out the repo for running instructions.
Starting the web server
The following is an example of an HTTP web server that receives a single POST request and responds with a randomly generated payload.
package main
...
const ( defaultPort = "8080" maxPayloadSize = 10 * 1024 * 1024 // 10 MB letterBytes = "abcdefghijklmnopqrstuvwxyzABCDEFGHIJKLMNOPQRSTUVWXYZ1234567890")
...
// customResponse holds the requested size for the response payload.type customResponse struct { Size int `json:"size"`}
func postCustomResponse(context *gin.Context) {
var customResp customResponse
if err := context.BindJSON(&customResp); err != nil { _ = context.AbortWithError(http.StatusBadRequest, err) return } if customResp.Size > maxPayloadSize { _ = context.AbortWithError(http.StatusBadRequest, fmt.Errorf("requested size %d is bigger than max allowed %d", customResp, maxPayloadSize)) return }
context.JSON(http.StatusOK, map[string]string{"answer": randStringBytes(customResp.Size)})}
func main() { engine := gin.New()
engine.Use(gin.Recovery()) engine.POST("/customResponse", postCustomResponse)
port := os.Getenv("PORT")
if port == "" { port = defaultPort }
fmt.Printf("listening on 0.0.0.0:%s\n", port)
if err := engine.Run(fmt.Sprintf("0.0.0.0:%s", port)); err != nil { log.Fatal(err) }}We can run this server by using the following command:
go run server.goNext, we can use the following command to trigger output from the server and verify that the server is working:
curl -X POST http://localhost:8080/customResponse -d '{"size": 100}'Finding the syscalls to track
Once the web server is up and running, the first thing we need to do before we build our tracer is determine which syscalls are being used for HTTP communication. We will use the strace tool for this task.
More specifically, we can run the server with strace and use the -f option to capture syscalls from the threads of the server. Through the -o option, we can write all output to a text file that we can name syscalls_dump.txt. To do so, we run the following command:
sudo strace -f -o syscalls_dump.txt go run server.goNext, if we re-run the above curl command and check the syscalls_dump.txt, we can observe the following:
38988 accept4(3, <unfinished ...>38987 nanosleep({tv_sec=0, tv_nsec=20000}, <unfinished ...>38988 <... accept4 resumed>{sa_family=AF_INET, sin_port=htons(57594), sin_addr=inet_addr("127.0.0.1")}, [112->16], SOCK_CLOEXEC|SOCK_NONBLOCK) = 7...38988 read(7, <unfinished ...>38987 nanosleep({tv_sec=0, tv_nsec=20000}, <unfinished ...>38988 <... read resumed>"POST /customResponse HTTP/1.1\r\nH"..., 4096) = 175...38988 write(7, "HTTP/1.1 200 OK\r\nContent-Type: a"..., 237 <unfinished ...>...38989 close(7)We can see that, at first, the server used the accept4 syscall to accept a new connection. We can also see that the file descriptor (FD) for the new socket is 7 (the return code of the syscall). Furthermore, we can see that for every other syscall, the first argument (which is the FD) is 7, so all the operations are happening on the same socket.
Here is the flow:
- Accept the new connection by using the
accept4syscall. - Read the content from the socket by using the
readsyscall on the socket file descriptor. - Write the response to the socket by using the
writesyscall on the socket file descriptor. - And finally, close the file descriptor by using the
closesyscall.
Now that we understand how the server is working, we can move on to building our HTTP capture tool.
Building the kernel agent (eBPF hooks)
BCC and libbpf are the two main development frameworks that can be used to create the kernel agent for BPF and eBPF. For simplicity, we will use the BCC framework in this walkthrough because it is more common today. (In general, however, we suggest working with libbpf. For more information about these frameworks, see this article.)
To build the kernel agent, we will implement eight hooks (entry and exit hooks for accept4, read, write, and close syscalls). The hooks reside in the kernel and are written in C language. We need the combination of all these hooks to perform the full capturing process. As we create the kernel agent, we will also use helper structs and maps to store the arguments of the syscalls. We will explain the basics about each of these elements below, but for more information, you can also review the entire kernel code in our repo.
Hooking the accept4 syscall
To start, we need to hook the accept4 syscall. In eBPF, we can place a hook for each syscall upon its entry and exit (in other words, just before and after the code has run). The entry is useful for getting the input arguments of the syscall, and the return is useful for learning whether the syscall worked as expected.
In the following snippet, we declare a struct to save the input arguments in the entry of the accept4 syscall. We then use this information in the exit of the syscall, where we can determine whether the syscall has succeeded.
// Copyright (c) 2018 The Pixie Authors.// Licensed under the Apache License, Version 2.0 (the "License")// Original source: https://github.com/pixie-io/pixie/blob/main/src/stirling/source%5C_connectors/socket%5C_tracer/bcc%5C_bpf/socket%5C_trace.c
// A helper struct that holds the addr argument of the syscall.struct accept_args_t { struct sockaddr_in* addr;};
// A helper map that will help us cache the input arguments of the accept syscall// between the entry hook and the return hook.BPF_HASH(active_accept_args_map, uint64_t, struct accept_args_t);
// Hooking the entry of accept4// the signature of the syscall is int accept(int sockfd, struct sockaddr *addr, socklen_t *addrlen);int syscall__probe_entry_accept4(struct pt_regs* ctx, int sockfd, struct sockaddr* addr, socklen_t* addrlen) { // Getting a unique ID for the relevant thread in the relevant pid. // That way we can link different calls from the same thread.
uint64_t id = bpf_get_current_pid_tgid();
// Keep the addr in a map to use during the accept4 exit hook. struct accept_args_t accept_args = {}; accept_args.addr = (struct sockaddr_in *)addr; active_accept_args_map.update(&id, &accept_args);
return 0;}
// Hooking the exit of accept4int syscall__probe_ret_accept4(struct pt_regs* ctx) { uint64_t id = bpf_get_current_pid_tgid();
// Pulling the addr from the map. struct accept_args_t* accept_args = active_accept_args_map.lookup(&id); // If the id exist in the map, we will get a non empty pointer that holds // the input address argument from the entry of the syscall. if (accept_args != NULL) { process_syscall_accept(ctx, id, accept_args); }
// Anyway, in the end clean the map. active_accept_args_map.delete(&id);
return 0;}The code snippet above shows us the minimum piece of code for hooking both the entry and exit of the syscall and the method for saving the input arguments in the entry of the syscall to be later used in the exit of the syscall.
Why do we do this? Since we cannot know if a syscall will succeed during its entry, and we cannot access the input arguments during its exit, we need to store the arguments until we know for sure that the syscall managed to succeed. Only then can we perform our logic.
Our special logic is in process_syscall_accept, which checks that the syscall finished successfully. Then, we save the connection info in a global map so that we can use it in other syscalls (read, write, and close).
In the following snippet, we create a function (process_syscall_accept) used by the accept4 hooks and register any new connection made to the server in our own mapping. Then, in the last section of the snippet, we alert the user-mode agent about new connections accepted by the server.
// Copyright (c) 2018 The Pixie Authors.// Licensed under the Apache License, Version 2.0 (the "License")// Original source: https://github.com/pixie-io/pixie/blob/main/src/stirling/source%5C_connectors/socket%5C_tracer/bcc%5C_bpf/socket%5C_trace.c
// A struct representing a unique ID that is composed of the pid, the file// descriptor and the creation time of the struct.struct conn_id_t { // Process ID uint32_t pid;
// The file descriptor to the opened network connection. int32_t fd;
// Timestamp at the initialization of the struct. uint64_t tsid;};
// This struct contains information collected when a connection is established,// via an accept4() syscall.struct conn_info_t { // Connection identifier. struct conn_id_t conn_id;
// The number of bytes written/read on this connection. int64_t wr_bytes; int64_t rd_bytes;
// A flag indicating we identified the connection as HTTP. bool is_http;};
// A struct describing the event that we send to the user mode upon a new connection.struct socket_open_event_t { // The time of the event. uint64_t timestamp_ns;
// A unique ID for the connection. struct conn_id_t conn_id;
// The address of the client. struct sockaddr_in addr;};
// A map of the active connections. The name of the map is conn_info_map// the key is of type uint64_t, the value is of type struct conn_info_t,// and the map won't be bigger than 128KB.BPF_HASH(conn_info_map, uint64_t, struct conn_info_t, 131072);
// A perf buffer that allows us send events from kernel to user mode.// This perf buffer is dedicated for special type of events - open events.BPF_PERF_OUTPUT(socket_open_events);
// A helper function that checks if the syscall finished successfully and if it did// saves the new connection in a dedicated map of connectionsstatic __inline void process_syscall_accept(struct pt_regs* ctx, uint64_t id, const struct accept_args_t* args) { // Extracting the return code, and checking if it represent a failure, // if it does, we abort as we have nothing to do. int ret_fd = PT_REGS_RC(ctx);
if (ret_fd <= 0) { return; }
struct conn_info_t conn_info = {}; uint32_t pid = id >> 32; conn_info.conn_id.pid = pid; conn_info.conn_id.fd = ret_fd; conn_info.conn_id.tsid = bpf_ktime_get_ns();
uint64_t pid_fd = ((uint64_t)pid << 32) | (uint32_t)ret_fd; // Saving the connection info in a global map, so in the other syscalls // (read, write and close) we will be able to know that we have seen // the connection conn_info_map.update(&pid_fd, &conn_info);
// Sending an open event to the user mode, to let the user mode know that we // have identified a new connection. struct socket_open_event_t open_event = {}; open_event.timestamp_ns = bpf_ktime_get_ns(); open_event.conn_id = conn_info.conn_id; bpf_probe_read(&open_event.addr, sizeof(open_event.addr), args->addr);
socket_open_events.perf_submit(ctx, &open_event, sizeof(struct socket_open_event_t));}Hooking the read and write syscalls
In the following snippet, we create the hooks for the read syscall. You can see similarities between the first hook that we wrote (for accept4) and this new hook. The following code uses a similar helper struct and map and defines the same overall sequence of actions (hooking the entry and exit, validating exit code, and processing the payload).
// Copyright (c) 2018 The Pixie Authors.// Licensed under the Apache License, Version 2.0 (the "License")// Original source: https://github.com/pixie-io/pixie/blob/main/src/stirling/source%5C_connectors/socket%5C_tracer/bcc%5C_bpf/socket%5C_trace.c
// A helper struct to cache input argument of read/write syscalls between the// entry hook and the exit hook.struct data_args_t { int32_t fd; const char* buf;};
// Helper map to store read syscall arguments between entry and exit hooks.BPF_HASH(active_read_args_map, uint64_t, struct data_args_t);
// original signature: ssize_t read(int fd, void *buf, size_t count);int syscall__probe_entry_read(struct pt_regs* ctx, int fd, char* buf, size_t count) { uint64_t id = bpf_get_current_pid_tgid();
// Stash arguments. struct data_args_t read_args = {}; read_args.fd = fd; read_args.buf = buf; active_read_args_map.update(&id, &read_args);
return 0;}
int syscall__probe_ret_read(struct pt_regs* ctx) { uint64_t id = bpf_get_current_pid_tgid();
// The return code the syscall is the number of bytes read as well. ssize_t bytes_count = PT_REGS_RC(ctx); struct data_args_t* read_args = active_read_args_map.lookup(&id); if (read_args != NULL) { // kIngress is an enum value that allows the process_data function // to know whether the input buffer is incoming or outgoing. process_data(ctx, id, kIngress, read_args, bytes_count); }
active_read_args_map.delete(&id); return 0;}In the following snippet, we create the helper functions to process the read syscall. Our helper function determines whether the read syscall has finished successfully by checking the number of read bytes. Then it checks if the data being read is describing HTTP. If so, we send it to the user mode as an event.
// Copyright (c) 2018 The Pixie Authors.// Licensed under the Apache License, Version 2.0 (the "License")// Original source: https://github.com/pixie-io/pixie/blob/main/src/stirling/source%5C_connectors/socket%5C_tracer/bcc%5C_bpf/socket%5C_trace.c
// Data buffer message size. BPF can submit at most this amount of data to a perf buffer.// Kernel size limit is 32KiB. See for more details.#define MAX_MSG_SIZE 30720 // 30KiB
struct socket_data_event_t { // We split attributes into a separate struct, because BPF gets upset if you do lots of // size arithmetic. This makes it so that its attributes are followed by a message. struct attr_t { // The timestamp when syscall completed (return probe was triggered). uint64_t timestamp_ns;
// Connection identifier (PID, FD, etc.). struct conn_id_t conn_id;
// The type of the actual data that the msg field encodes, which is used by the caller // to determine how to interpret the data. enum traffic_direction_t direction;
// The size of the original message. We use this to truncate msg field to minimize the amount // of data being transferred. uint32_t msg_size;
// A 0-based position number for this event on the connection, in terms of byte position. // The position is for the first byte of this message. uint64_t pos; } attr;
char msg[MAX_MSG_SIZE];};
// Perf buffer to send to the user-mode the data events.BPF_PERF_OUTPUT(socket_data_events);
...
// A helper function that handles read/write syscalls.static inline __attribute__((__always_inline__)) void process_data(struct pt_regs* ctx, uint64_t id, enum traffic_direction_t direction, const struct data_args_t* args, ssize_t bytes_count) { // Always check access to pointers before accessing them. if (args->buf == NULL) { return; }
// For read and write syscall, the return code is the number of bytes written or read, so zero means nothing // was written or read, and negative means that the syscall failed. Anyhow, we have nothing to do with that syscall. if (bytes_count <= 0) { return; }
uint32_t pid = id >> 32; uint64_t pid_fd = ((uint64_t)pid << 32) | (uint32_t)args->fd; struct conn_info_t* conn_info = conn_info_map.lookup(&pid_fd); if (conn_info == NULL) { // The FD being read/written does not represent an IPv4 socket FD. return; }
// Check if the connection is already HTTP, or check if that's a new connection, check protocol and return true if that's HTTP. if (is_http_connection(conn_info, args->buf, bytes_count)) { // allocate a new event. uint32_t kZero = 0; struct socket_data_event_t* event = socket_data_event_buffer_heap.lookup(&kZero); if (event == NULL) { return; }
// Fill the metadata of the data event. event->attr.timestamp_ns = bpf_ktime_get_ns(); event->attr.direction = direction; event->attr.conn_id = conn_info->conn_id;
// Another helper function that splits the given buffer to chunks if it is too large. perf_submit_wrapper(ctx, direction, args->buf, bytes_count, conn_info, event); }
// Update the conn_info total written/read bytes. switch (direction) { case kEgress: conn_info->wr_bytes += bytes_count; break; case kIngress: conn_info->rd_bytes += bytes_count; break; }}Next we can build the write syscall, which is very similar to the read syscall hooks. (As a reminder, you can review the relevant code in our repo.)
Hooking the close syscall
At this point, we just need to handle the close syscall, and we are done. Here as well, the hooks are very similar to the other hooks. See our repository for details.
Building the user-mode agent
The user-mode agent is written in Go by using the gobpf library. This agent reads the kernel code from a file and compiles the source code at runtime by using the Clang tool during the start-up of the client user-mode agent.
The section below describes only its main aspects. For the full code, see the repository for this walkthrough.
The first step will be to compile the code:
bpfModule := bcc.NewModule(string(bpfSourceCodeContent), nil)defer bpfModule.Close()Then, we create a connection factory responsible for holding all connection instances, printing ready connections, and deleting inactive or malformed ones.
// Create connection factory and set 1m as the inactivity threshold// Meaning connections that didn't get any event within the last minute are being closed.connectionFactory := connections.NewFactory(time.Minute)// A go routine that runs every 10 seconds and prints ready connections// And deletes inactive or malformed connections.go func() { for { connectionFactory.HandleReadyConnections() time.Sleep(10 * time.Second) }}()Next, we load the perf buffer handlers, which receive the output from our kernel hooks and process them:
if err := bpfwrapper.LaunchPerfBufferConsumers(bpfModule, connectionFactory); err != nil { log.Panic(err)}Note that each perf buffer handler gets the events over a channel (inputChan), and each event is of type byte array ([]byte). We will convert each event to a Golang representation of the struct.
// ConnID is a conversion of the following C-Struct into GO.// struct conn_id_t {// uint32_t pid;// int32_t fd;// uint64_t tsid;// };.type ConnID struct { PID uint32 FD int32 TsID uint64}
...We next need to fix the timestamp of the event because the kernel mode returns a monotonic clock instead of a real-time clock. Then, we update the connection object fields with the new event.
func socketCloseEventCallback(inputChan chan []byte, connectionFactory *connections.Factory) { for data := range inputChan { if data == nil { return }
var event structs.SocketCloseEvent if err := binary.Read(bytes.NewReader(data), bpf.GetHostByteOrder(), &event); err != nil { log.Printf("Failed to decode received data: %+v", err) continue } event.TimestampNano += settings.GetRealTimeOffset() connectionFactory.GetOrCreate(event.ConnID).AddCloseEvent(event) }}For the final part, we attach the hooks.
if err := bpfwrapper.AttachKprobes(bpfModule); err != nil { log.Panic(err)}Testing the tracer
To test the new tracer, first send a client curl request to the HTTP server:

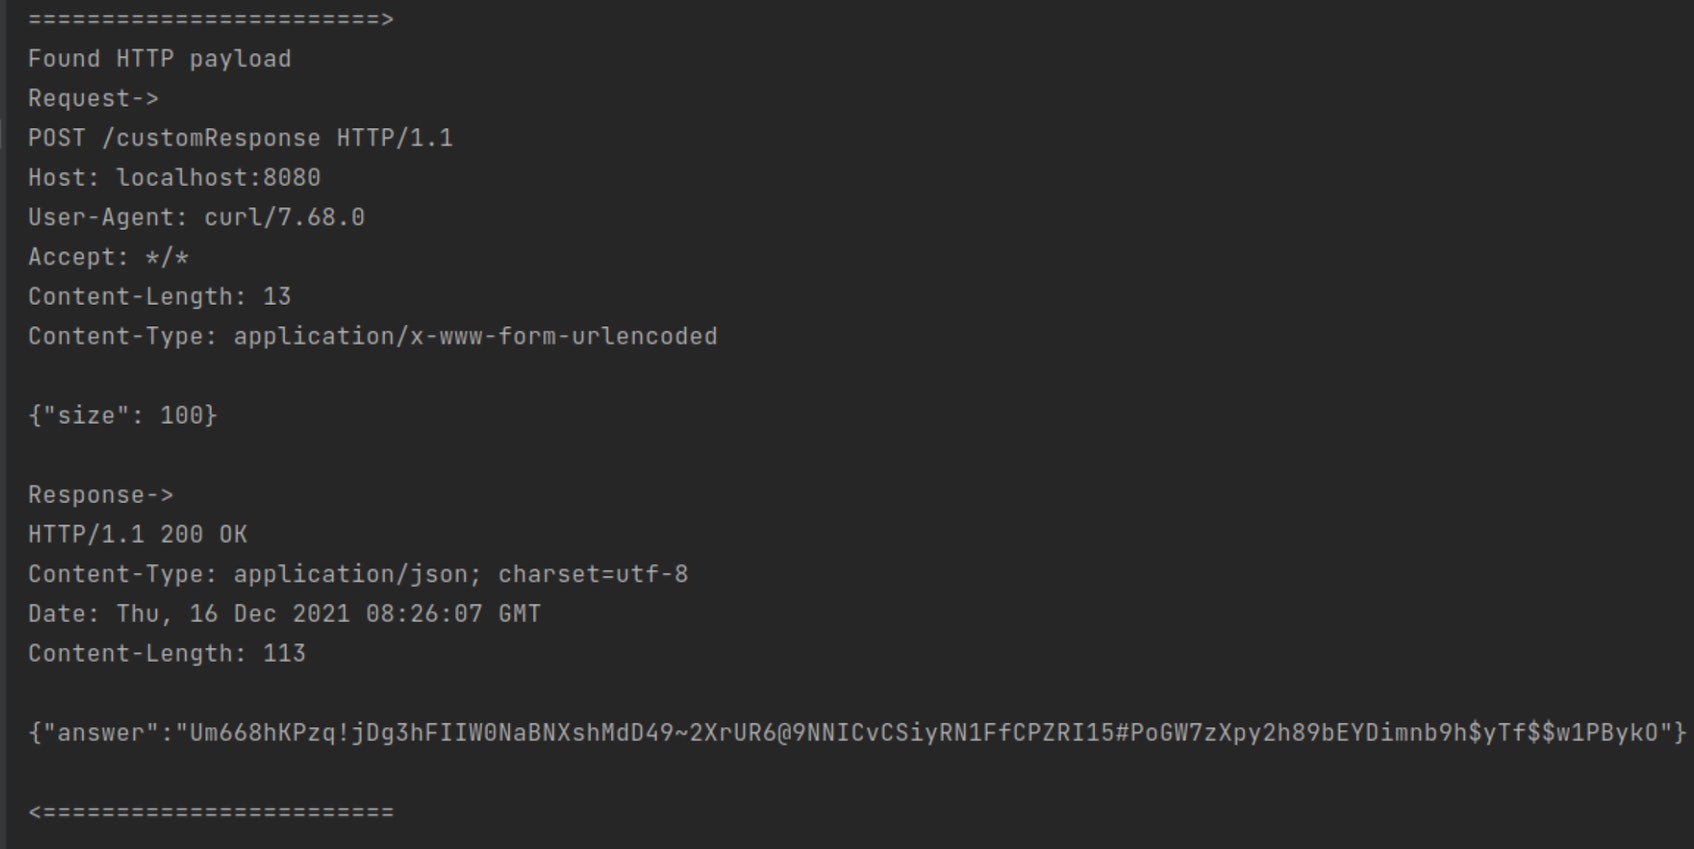
The sniffer captures the following information from the curl request:

As we can see, we were able to capture both the HTTP request and response, although there is no HTTP-related function in the kernel. We have managed to retrieve the full payload—including the bodies of the request and the response—merely by using eBPF to hook the syscalls associated with HTTP communication.
Summary
We have gone through the process of creating an eBPF-based protocol tracer for HTTP session traffic. As you can see, understanding the syscalls and implementing the first hooks for them were the hardest part. Once you learn how to implement your first syscall hook, writing other similar hooks becomes much easier.
Beyond HTTP session monitoring, teams can use eBPF to monitor any type of application-level traffic. Datadog in fact uses these capabilities of eBPF to give you visibility into more aspects of your environment without requiring you to instrument any code. For example, Datadog recently drew upon eBPF to build Universal Service Monitoring, which, merely by monitoring application level traffic, enables teams to detect all services running in their infrastructure. In August 2022, Datadog also announced its acquisition of Seekret, whose technology leverages eBPF to let organizations easily discover and manage APIs across their environments. Datadog plans to incorporate these capabilities into its platform and use eBPF to build additional powerful features that transform the way teams can manage the health, availability, and security of their resources.
For more in-depth information about how eBPF works and how Datadog uses it, you can watch our Datadog on eBPF video. And to get started with Datadog, you can sign up for our 14-day free trial.
References
- GitHub - pixie-io/pixie: Instant Kubernetes-Native Application Observability - Open source observability tool for Kubernetes applications
- eBPF - Introduction, Tutorials & Community Resources
- A Gentle Introduction to eBPF


