Out-of-memory (OOM) errors take place when the Linux kernel can’t provide enough memory to run all of its user-space processes, causing at least one process to exit without warning. Without a comprehensive monitoring solution, OOM errors can be tricky to diagnose.
In this post, you will learn how to use Datadog to diagnose OOM errors on Linux systems by:
- Analyzing different types of OOM error logs
- Using Datadog’s OOM kill check to send metrics to Datadog when the kernel terminates a memory-intensive process
- Choosing the most revealing metrics to explain low-memory situations on your hosts
- Using a profiler to understand memory-heavy processes
- Setting up automated alerts to troubleshoot OOM error messages more easily
Identify the error message
OOM error logs are normally available in your host’s syslog (in the file /var/log/syslog). In a dynamic environment with a large number of ephemeral hosts, it’s not realistic to comb through system logs manually—you should forward your logs to Datadog for search and analysis. Datadog will parse these logs so you can query them and set automated alerts.
OOM errors fall into two categories:
- Error messages from user-space processes that handle OOM errors themselves
- Error messages from the kernel-space OOM Killer
We’ll show you how to identify these logs, then explain how to use Datadog to collect OOM logs automatically for visualization, analysis, and alerting.
Error messages from user-space processes
User-space processes receive access to system memory by making requests to the kernel, which returns a set of memory addresses (virtual memory) that the kernel will later assign to pages in physical RAM. When a user-space process first requests a virtual memory mapping, the kernel usually grants the request regardless of how many free pages are available. The kernel only allocates free pages to that mapping when it attempts to access memory with no corresponding page in RAM.
When an application fails to obtain a virtual memory mapping from the kernel, it will often handle the OOM error itself, emit a log message, then exit. If you know that certain hosts will be dedicated to memory-intensive processes, you should determine in advance what OOM logs these processes output, then set up alerts on these logs. Consider running game days to see what logs your system generates when it runs out of memory, and consult the documentation or source of your critical applications to ensure that Datadog can ingest and parse OOM logs. (We’ll show you how to configure Datadog to collect your OOM logs later.)
The information you can obtain from error logs differs by application. For example, if a Go program attempts to request more memory than is available on the system, it will print a log that resembles the following, print a stack trace, then exit.
fatal error: runtime: out of memoryIn this case, the log prints a detailed stack trace for each goroutine running at the time of the error, enabling you to figure out what the process was attempting to do before exiting. In this stack trace, we can see that our demo application was requesting memory while calling the *ImageProcessor.IdentifyImage() method.
goroutine 1 [running]:
runtime.systemstack_switch()
        /usr/local/go/src/runtime/asm_amd64.s:330 fp=0xc0000b9d10 sp=0xc0000b9d08 pc=0x461570
runtime.mallocgc(0x278f3774, 0x695400, 0x1, 0xc00007e070)
        /usr/local/go/src/runtime/malloc.go:1046 +0x895 fp=0xc0000b9db0 sp=0xc0000b9d10 pc=0x40c575
runtime.makeslice(0x695400, 0x278f3774, 0x278f3774, 0x38)
        /usr/local/go/src/runtime/slice.go:49 +0x6c fp=0xc0000b9de0 sp=0xc0000b9db0 pc=0x44a9ec
demo_app/imageproc.(*ImageProcessor).IdentifyImage(0xc00000c320, 0x278f3774, 0xc0278f3774)
        demo_app/imageproc/imageproc.go:36 +0xb5 fp=0xc0000b9e38 sp=0xc0000b9de0 pc=0x5163f5
demo_app/imageproc.(*ImageProcessor).IdentifyImage-fm(0x278f3774, 0x36710769)
        demo_app/imageproc/imageproc.go:34 +0x34 fp=0xc0000b9e60 sp=0xc0000b9e38 pc=0x5168b4
demo_app/imageproc.(*ImageProcessor).Activate(0xc00000c320, 0x36710769, 0xc000064f68, 0x1)
        demo_app/imageproc/imageproc.go:88 +0x169 fp=0xc0000b9ee8 sp=0xc0000b9e60 pc=0x516779
main.main()
        demo_app/main.go:39 +0x270 fp=0xc0000b9f88 sp=0xc0000b9ee8 pc=0x66cd50
runtime.main()
        /usr/local/go/src/runtime/proc.go:203 +0x212 fp=0xc0000b9fe0 sp=0xc0000b9f88 pc=0x435e72
runtime.goexit()
        /usr/local/go/src/runtime/asm_amd64.s:1373 +0x1 fp=0xc0000b9fe8 sp=0xc0000b9fe0 pc=0x463501
Since this behavior is baked into the Go runtime, Go-based infrastructure tools like Consul and Docker will output similar messages in low-memory conditions.
In addition to error messages from user-space processes, you’ll want to watch for OOM messages produced by the Linux kernel’s OOM Killer.
Error messages from the OOM Killer
If a Linux machine is seriously low on memory, the kernel invokes the OOM Killer to terminate a process. As with user-space OOM error logs, you should treat OOM Killer logs as indications of overall memory saturation.
How the OOM Killer works
To understand when the kernel produces OOM errors, it helps to know how the OOM Killer works. The OOM Killer terminates a process using heuristics. It assigns each process on your system an OOM score between 0 and 1000, based on its memory consumption as well as a user-configurable adjustment score. It then terminates the process with the highest score. This means that, by default, the OOM Killer may end up killing processes you don’t expect. (You will see different behavior if you configure the kernel to panic on OOM without invoking the OOM Killer, or to always kill the task that invoked the OOM Killer instead of assigning OOM scores.)
The kernel invokes the OOM Killer when it tries—but fails—to allocate free pages. When the kernel fails to retrieve a page from any memory-zone in the system, it attempts to obtain free pages by other means, including memory compaction, direct reclaim, and searching again for free pages in case the OOM Killer had terminated a process during the initial search. If no free pages are available, the kernel triggers the OOM Killer. In other words, the kernel does not “see” that there are too few pages to satisfy a memory mapping until it is too late.
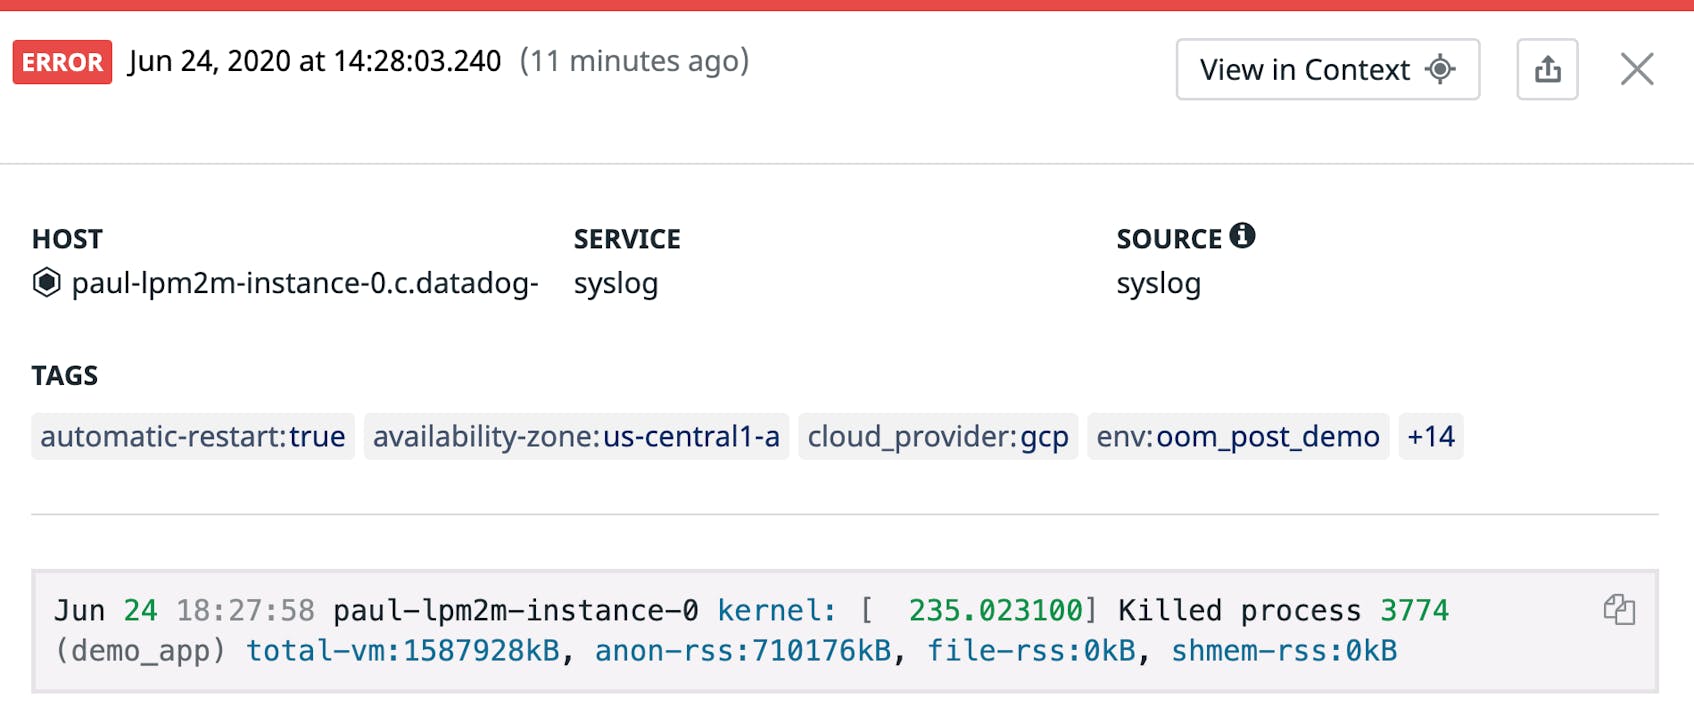
OOM Killer logs
You can use the OOM Killer logs both to identify which hosts in your system have run out of memory and to get detailed information on how much memory different processes were using at the time of the error. You can find an annotated example in the git commit that added this logging information to the Linux kernel. For example, the OOM Killer logs provide data on the system’s memory conditions at the time of the error.
Mem-Info:
active_anon:895388 inactive_anon:43 isolated_anon:0
 active_file:13 inactive_file:9 isolated_file:1
 unevictable:0 dirty:0 writeback:0 unstable:0
 slab_reclaimable:4352 slab_unreclaimable:7352
 mapped:4 shmem:226 pagetables:3101 bounce:0
 free:21196 free_pcp:150 free_cma:0
As you can see, the system had 21,196 pages of free memory when it threw the OOM error. With each page on the system holding up to 4 kB of memory, we can assume that the kernel needed to allocate at least 84.784 MB of physical memory to meet the requirements of currently running processes.
Send your OOM logs to Datadog for more context
OOM logs are particularly useful for indicating when, and in which parts of your infrastructure, your hosts are raising OOM errors. You can answer these questions quickly by sending your OOM logs to Datadog for analysis.
Collect OOM logs from your system
The Datadog Agent is open source software (GitHub) that collects metrics, traces, and logs from your hosts. In this section, we’ll show you how to configure the Agent to tail log files from your applications and the Linux kernel, detect OOM errors, and sends the logs to Datadog.
We’ll configure the Datadog Agent to collect OOM logs by identifying a single log line for it to look for. We’ll do this because there is often no way to group all of the lines within the log output of an OOM error for parsing. OOM Killer logs are a series of calls to the Linux kernel logger, rather than a single multi-line log (e.g., as you can see when it outputs system memory statistics). Any kernel logs in syslog will show the standard syslog header for every single line of your OOM log. Meanwhile, the Go runtime will print logs directly to stderr without adding a prefix (such as a timestamp) that can be used to group log lines. You should check whether your application’s OOM logs will do the same.
To capture OOM logs from the OOM Killer, create the following configuration file in /etc/datadog-agent/conf.d/kernel-oom.d/conf.yaml on Linux hosts that run the Datadog Agent. (You’ll need to create the kernel-oom.d directory.)
/etc/datadog-agent/conf.d/kernel-oom.d/conf.yaml
logs:
  - type: file
    path: "/var/log/syslog"
    service: "syslog"
    source: "syslog"
    log_processing_rules:
      - type: include_at_match
        name: catch_oom_logs
        pattern: Killed process \d+ \(\w+\) total-vm:\d+kB, anon-rss:\d+kB, file-rss:\d+kB, shmem-rss:\d+kB
Once you restart the Datadog Agent, the Agent will tail the file /var/log/syslog and send any OOM logs matching our pattern to Datadog. When defining a pattern, make sure it matches the OOM logs that your version of Linux emits.
To catch OOM error logs emitted by the Go runtime, create the golang-oom.d directory inside /etc/datadog-agent/conf.d, then add the following file. This configuration assumes that your application writes logs to the file in <LOG_FILE_PATH>.
/etc/datadog-agent/conf.d/golang-oom.d/conf.yaml
logs:
  - type: file
    path: "<LOG_FILE_PATH>"
    service: "<APP_NAME>"
    source: "<APP_NAME>"
    log_processing_rules:
      - type: include_at_match
        name: catch_oom_logs
        pattern: "fatal error: runtime: out of memory"
Parse your OOM logs for analysis
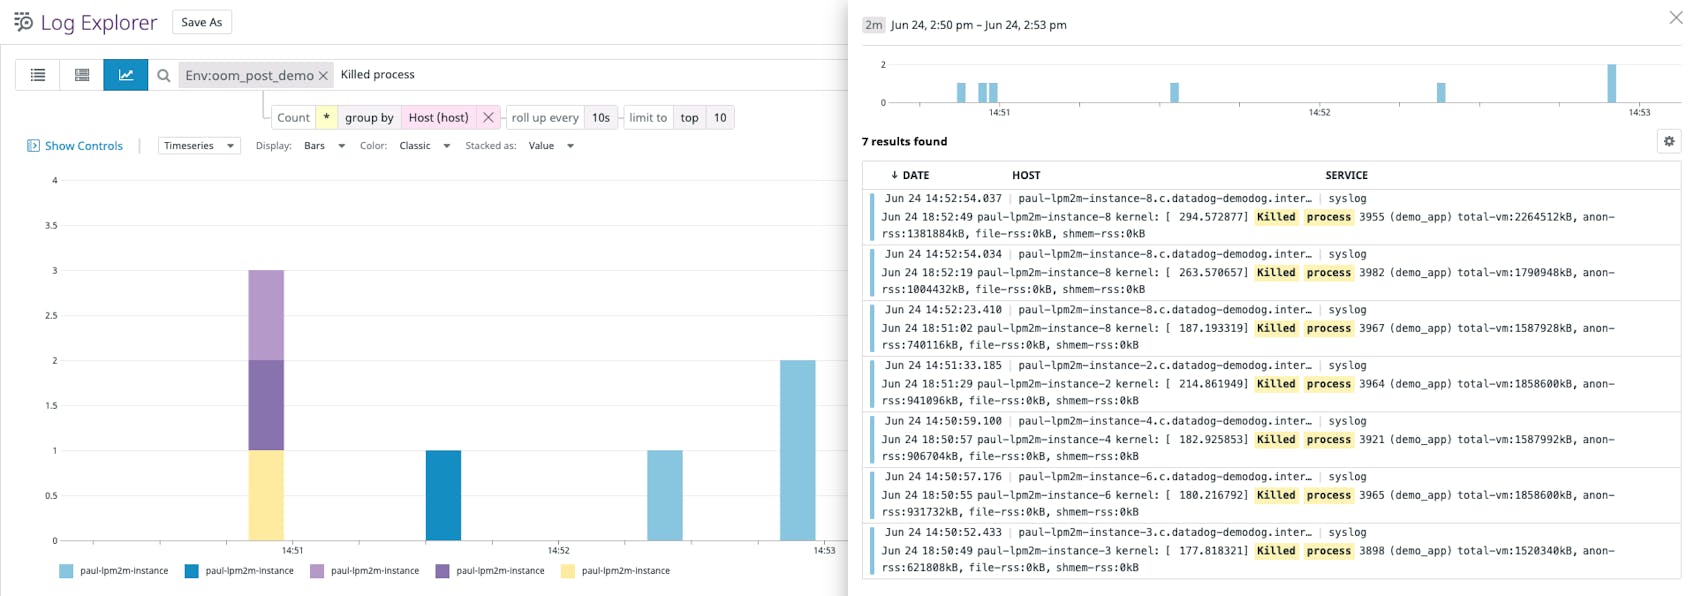
You can use Datadog to understand when and how often OOM logs appear within your systems. Datadog automatically tags your logs with metadata from your infrastructure, which you can use to see the extent to which low memory conditions are a problem for a single host, all hosts running an application, or your deployment in general. In Datadog’s Log Analytics view, you can track the frequency of OOM logs as a timeseries graph. You can add this graph to your dashboards or use the count of OOM logs to create alerts.
Get OOM data directly from the kernel
You can also find out how frequently your systems are producing kernel OOM errors by using Datadog’s OOM kill check. This method generates tagged metrics to help you visualize OOM errors in context, making it easier to scope low-memory issues for troubleshooting. (For application-level OOM errors, you should set up log collection as we explained earlier.)
The Datadog Agent safely gathers data whenever the kernel invokes the OOM Killer, using the Datadog system probe. The system probe initializes an eBPF program and attaches it to oom_kill_process, the function that the kernel uses to trigger an OOM kill event. The Datadog Agent then queries a local Unix socket for data from the probe.
The OOM kill check generates the oom_kill.oom_process.count metric, which indicates the number of OOM errors that have taken place in a particular interval. The metric includes three tags, so you can quickly determine which parts of your infrastructure are running low on memory, and why OOM errors may have taken place:
trigger_type: Whether a control group (cgroup) triggered the OOM Killer, or whether the kernel invoked the OOM Killer directly (system).trigger_process_name: The name of the process that invoked the OOM Killer.process_name: The name of the process terminated by the OOM Killer.
For example, you can group the oom_kill.oom_process.count metric by process_name to see which processes have been most susceptible to OOM kills, or in other words, tend to have the highest OOM score (as shown in the graph below). In this case, a high rate of OOM kills could explain losses in availability for the demo_app application.
To enable the OOM kill check, first make sure that you have installed the kernel headers for your system. The Datadog Agent uses these to compile the eBPF program at runtime.
Next, create two configuration files within each host you want to monitor for OOM kill events. First, enable the system probe by creating a file called system-probe.yaml at the root of the Datadog configuration directory, /etc/datadog-agent/, with the content below.
/etc/datadog-agent/system-probe.yaml
system_probe_config:
  enabled: true
  enable_oom_kill: true
Next, configure the Agent to gather OOM data from the system probe by creating a file in the directory /etc/datadog-agent/conf.d/oom_kill.d called conf.yaml with the content below.
/etc/datadog-agent/conf.d/oom_kill.d/conf.yaml
init_config:

instances:
  - collect_oom_kill: true
Finally, restart the Datadog Agent. To verify that the OOM kill check is enabled, run the datadog-agent status command. You should see an oom_kill section appear in the output:
$ datadog-agent status

[...]

 oom_kill
--------
  Instance ID: oom_kill [OK]
  Configuration Source: file:/etc/datadog-agent/conf.d/oom_kill.d/conf.yaml
  Total Runs: 8
  Metric Samples: Last Run: 0, Total: 0
  Events: Last Run: 0, Total: 0
  Service Checks: Last Run: 0, Total: 0
  Average Execution Time : 228ms
  Last Execution Date : 2020-09-01 15:36:55.000000 UTC
  Last Successful Execution Date : 2020-09-01 15:36:55.000000 UTC
Understand the problem
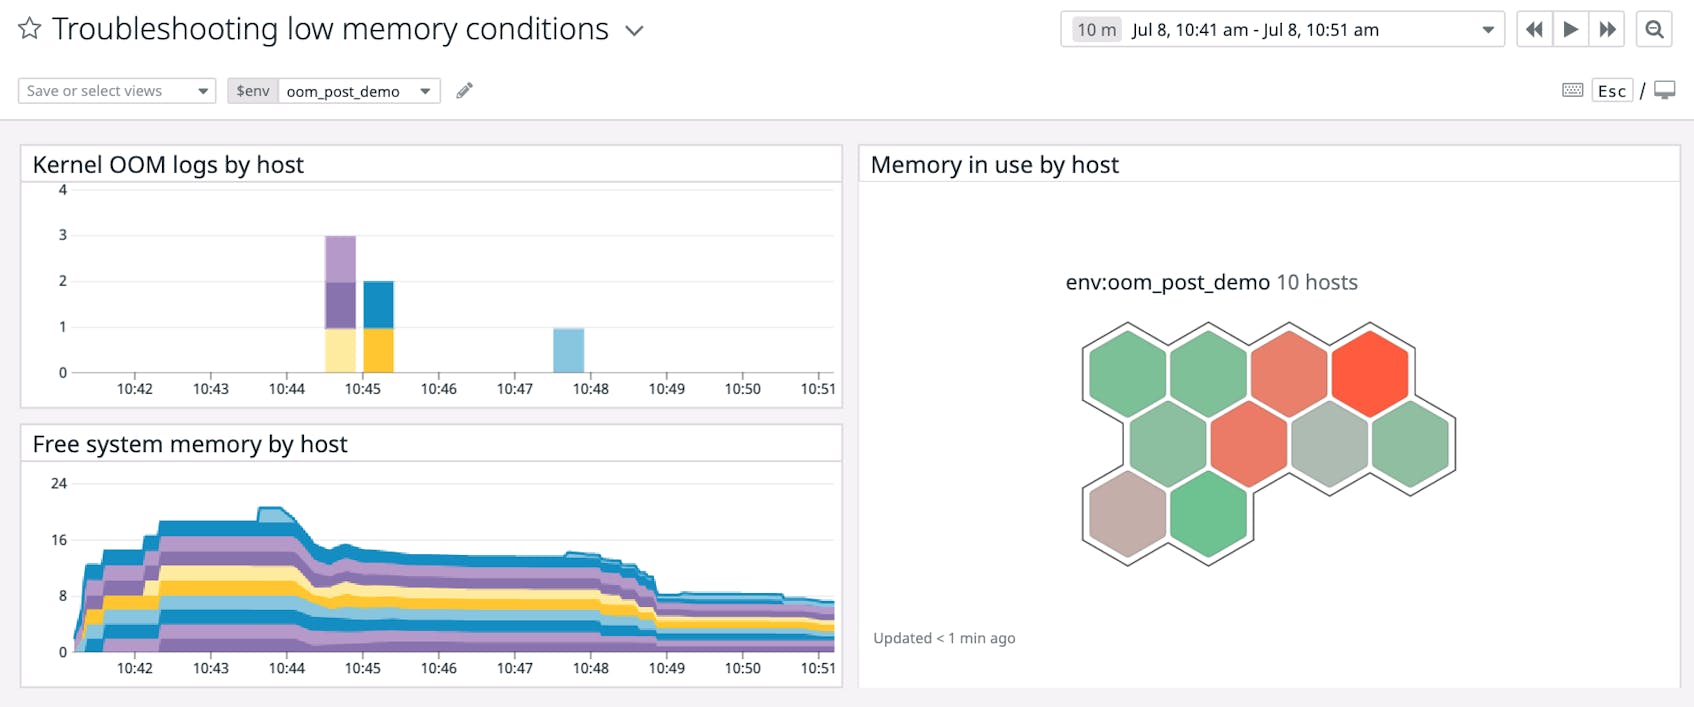
Using tags within Datadog, you should be able to tell from a spike in oom_kill.oom_process.count or the number of OOM error logs which hosts are facing critically low memory conditions. The next step is to understand how frequently your hosts reach these conditions—and when memory utilization has spiked anomalously—by monitoring system memory metrics. In this section, we’ll review some key memory metrics and how to get more context around OOM errors.
Get the best views from Datadog
Datadog provides three ways to analyze system memory utilization metrics. The system check tracks system-wide resource utilization, such as the total size of the available system RAM (system.mem.free). This helps you grasp the overall memory conditions on your hosts.
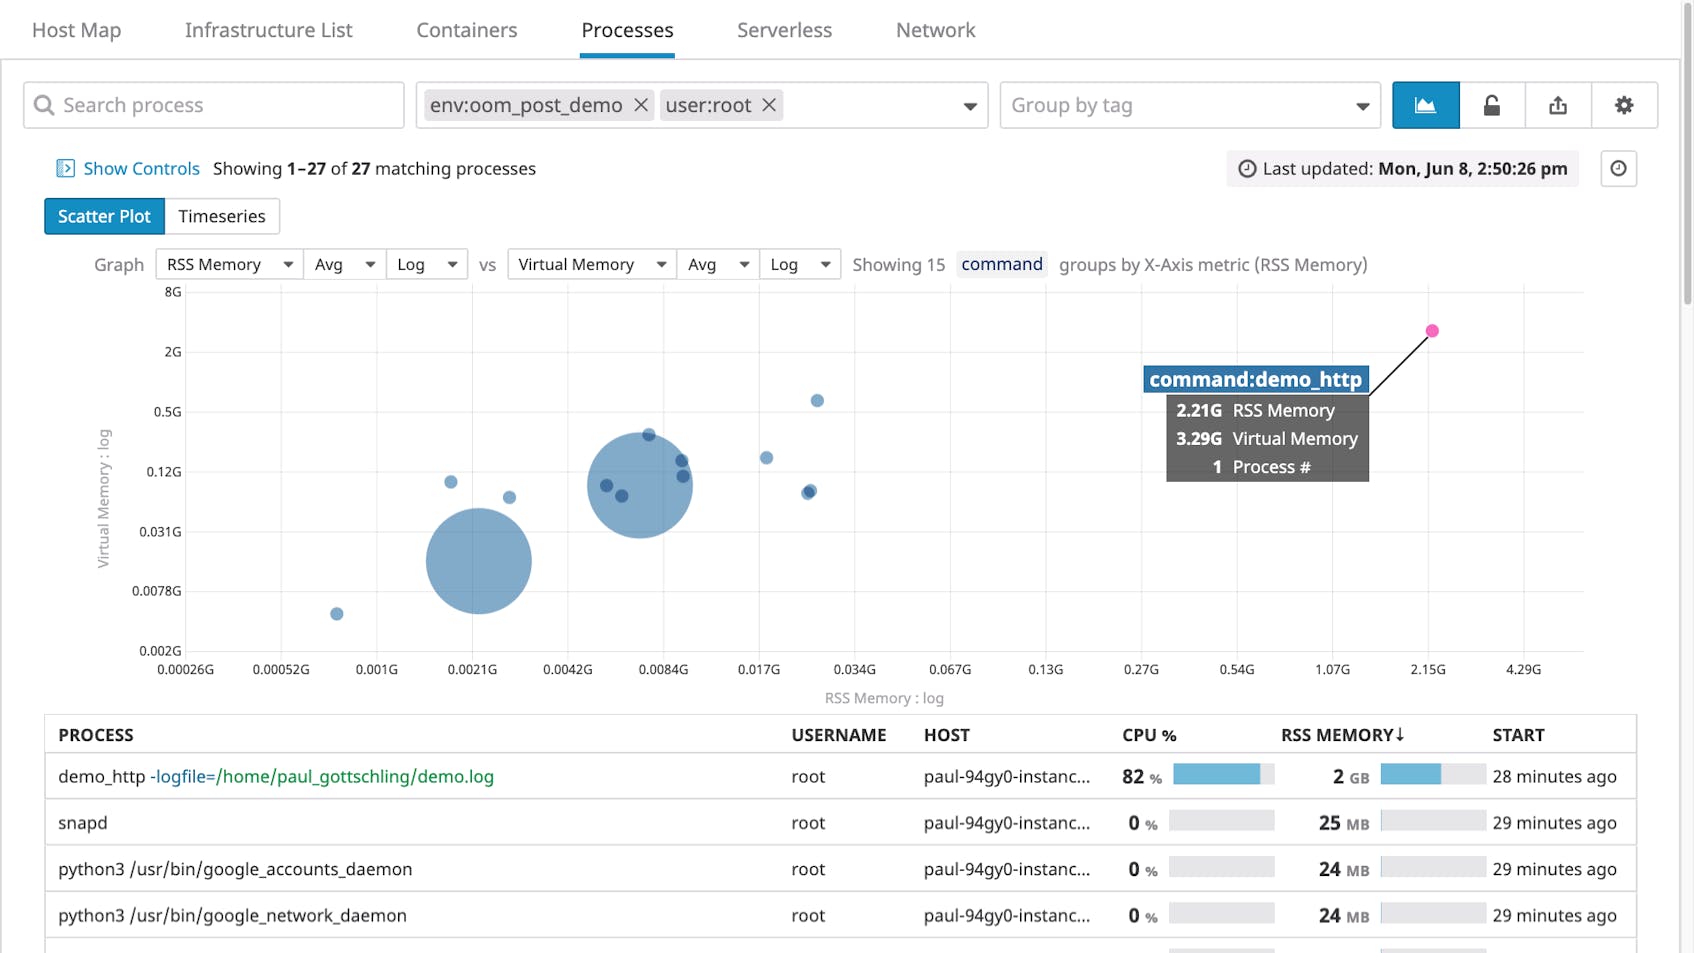
Once you know which hosts are using a lot of memory, you can drill down to see how different processes contribute. In the Live Process view, you can track per-process memory usage in real time, filtering down to only those processes that match tags of your choice, such as host, command, and user. You can then sort by RSS memory utilization to determine which processes you should investigate further.
Finally, Datadog’s process check gives you more context around a single process’s memory utilization by collecting detailed resource utilization metrics from processes of your choice. Since you can group process check metrics by tag within timeseries graphs, you can compare memory utilization for the same command across multiple hosts, availability zones, clusters, and other scopes, and see where in your infrastructure high memory utilization is an issue.
Choose the right metrics
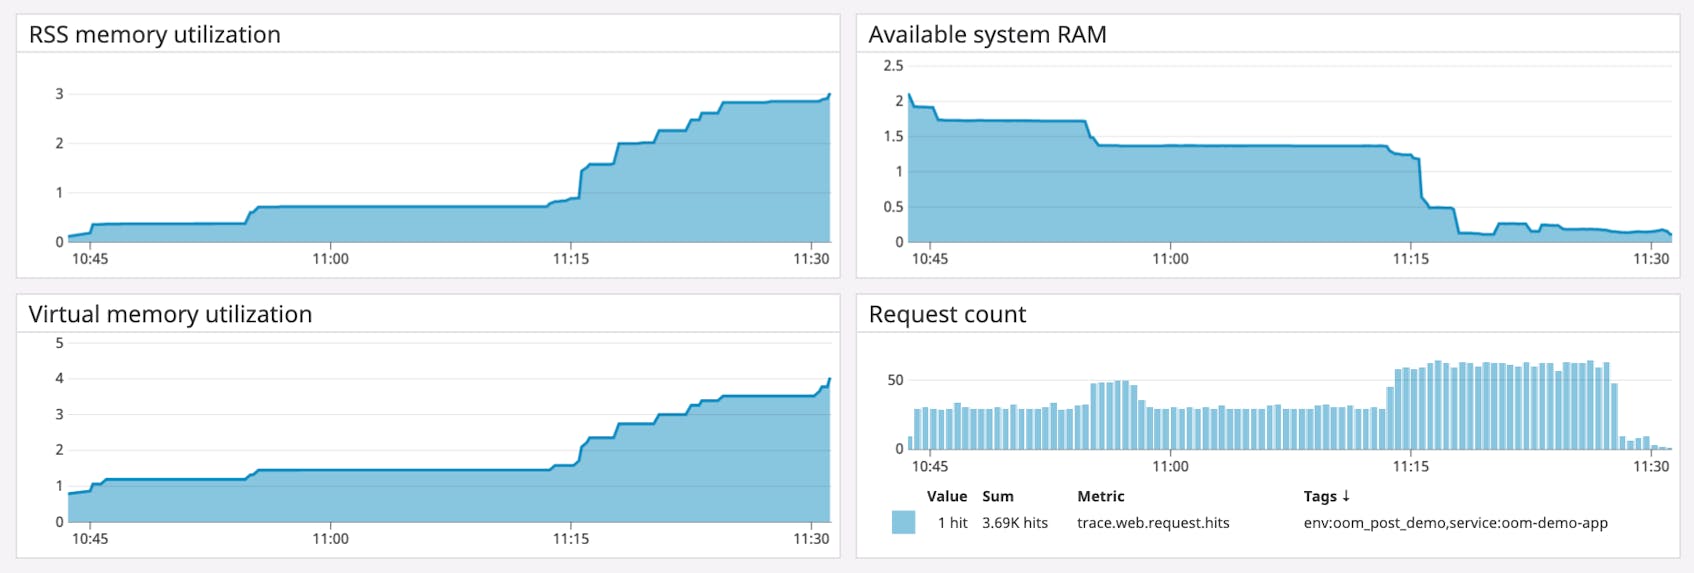
As we’ve seen, it’s difficult for the Linux kernel to determine when low-memory conditions will produce OOM errors. To make matters worse, the kernel is notoriously imprecise at measuring its own memory utilization, as a process can be allocated virtual memory but not actually use the physical RAM that those addresses map to. Since absolute measures of memory utilization can be unreliable, you should use another approach: determine what levels of memory utilization correlate with OOM errors in your hosts and what levels indicate a healthy baseline (e.g., by running game days).
When monitoring overall memory utilization in relation to a healthy baseline, you should track both how much virtual memory the kernel has mapped for your processes and how much physical memory your processes are using (called the resident set size). You can track these metrics both using the Live Process view and the system process metrics—check the former to see which processes are particularly memory-heavy, then configure the latter to group those processes by tag and get a more refined understanding of their scope.
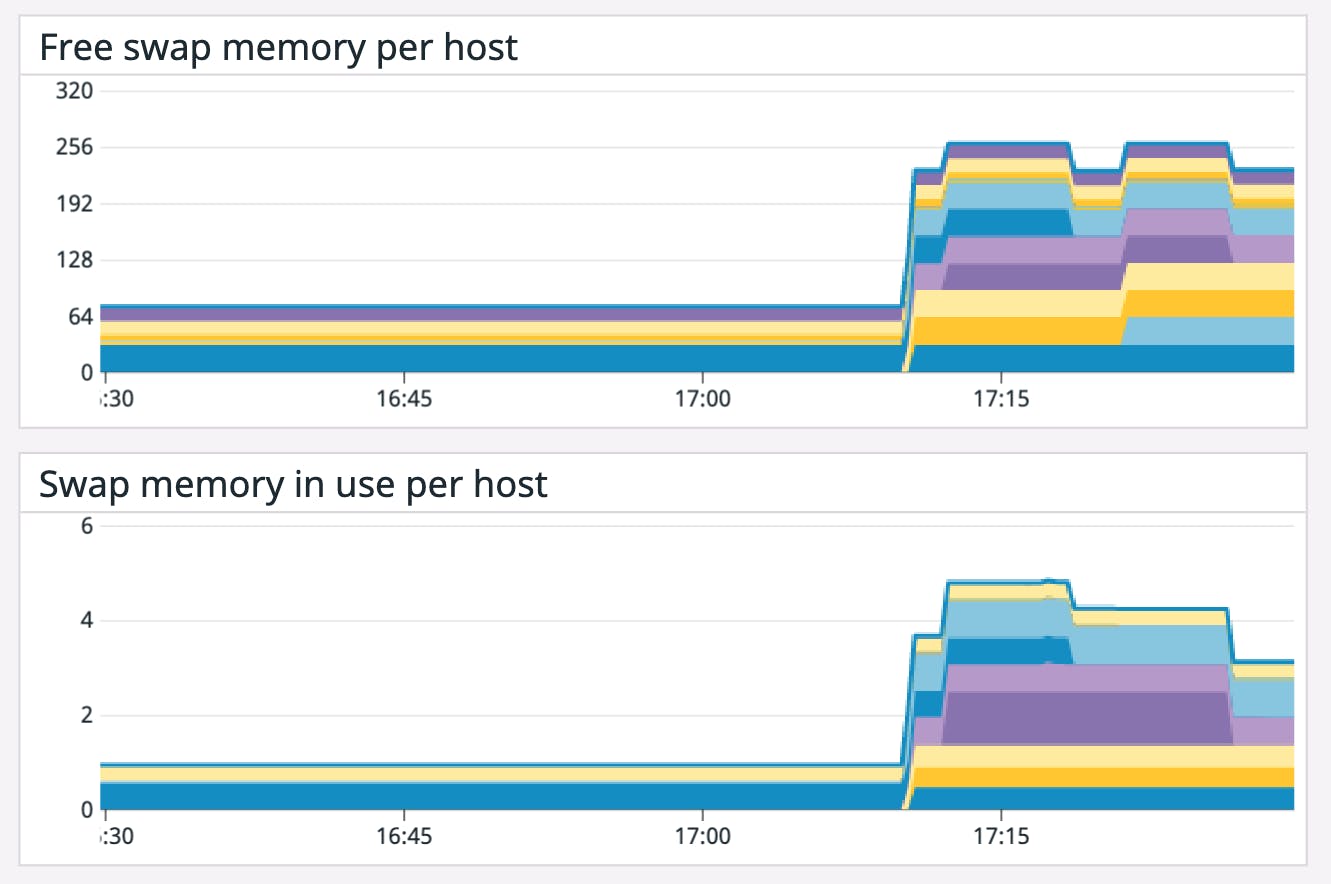
If you’ve configured your system to use a significant amount of swap space—space on disk where the kernel stores inactive pages—you can also track this in order to monitor total memory utilization across your system. Datadog’s system check tracks the total amount of swap memory available (system.swap.free) and in use (system.swap.used) on your system.
Determine the scope
Datadog will tag your memory metrics with useful metadata about where those metrics came from, including the name of the associated host and process. You can use these tags to filter your dashboards and the Live Process view to see which parts of your system have been using more memory than usual.
For example, you can use the host tag to determine if any one host is consuming an unusual amount of memory, whether in comparison to other hosts or to its baseline memory consumption. You can also group and filter your timeseries data either by process within a single host, or across all hosts in a cluster. This will help you determine whether any one executable is using an unusual amount of memory regardless of its local environment.
Finally, since Datadog retains system process check metrics at full granularity for 15 months, you can see how recent changes in per-process memory utilization compare to long-term trends. If an application has been emitting OOM errors regularly, yet still serves customers in line with your SLAs, you can consider giving the issue less importance. But if you’re seeing anomalously high memory utilization, you should investigate your system in more depth.
Find aggravating factors
If certain processes seem unusually memory-intensive, you’ll want to investigate them further by tracking metrics for other parts of your system that may be contributing to the issue.
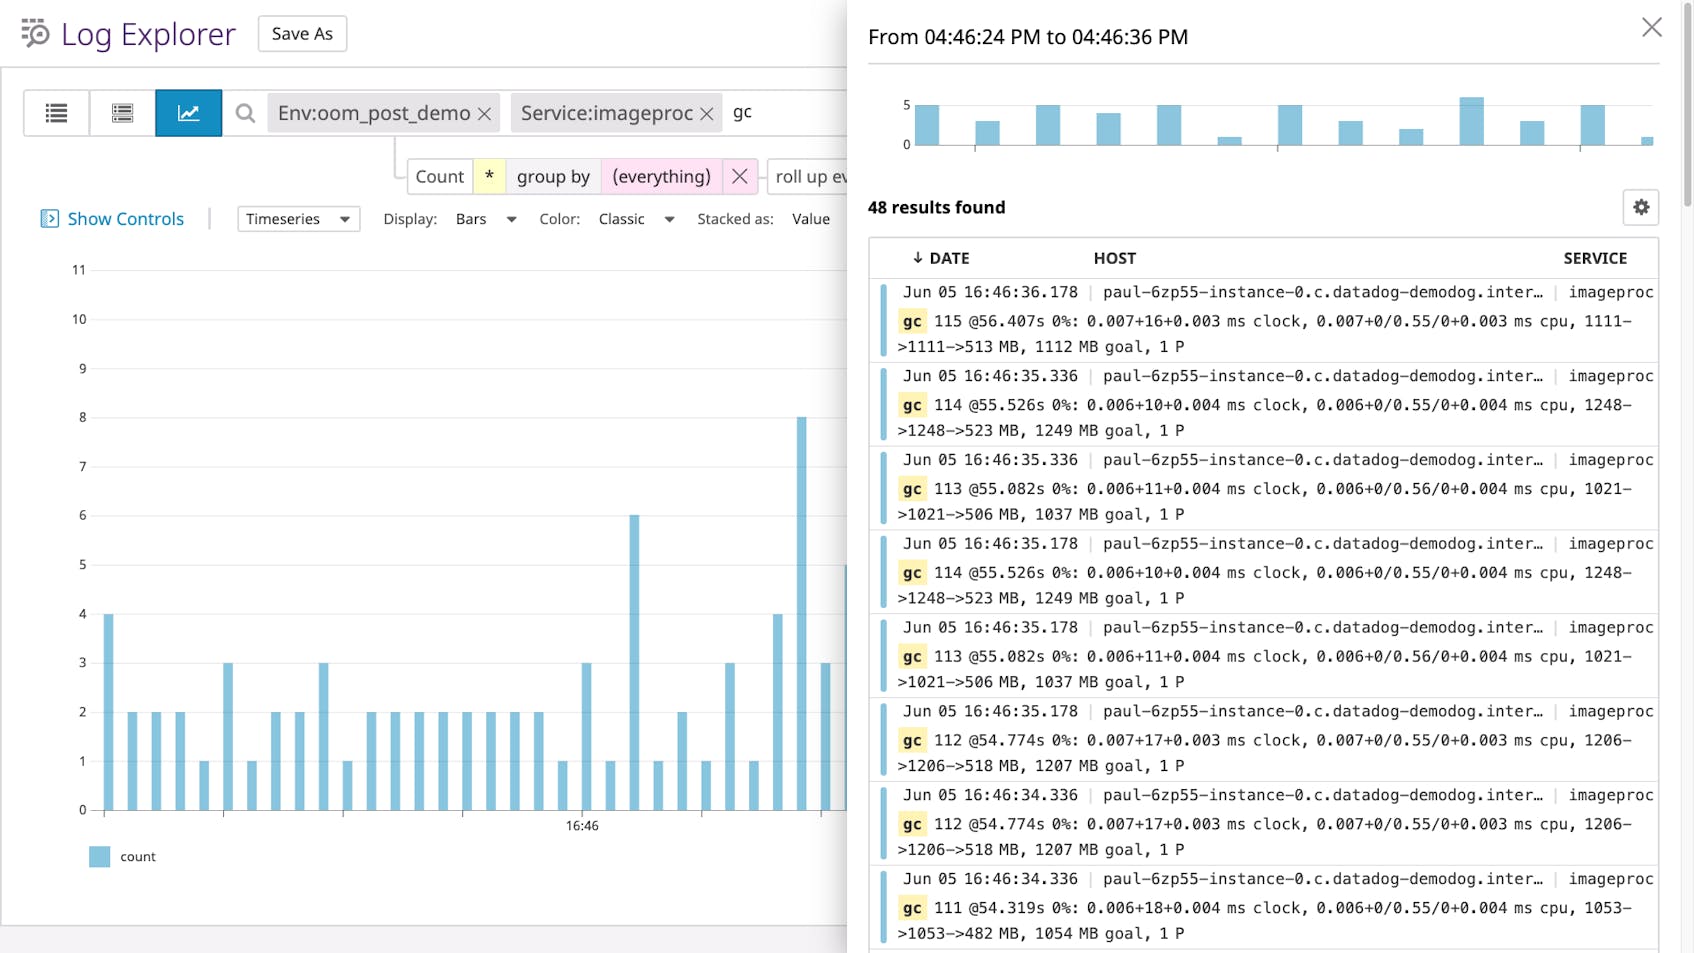
For processes with garbage-collected runtimes, you can investigate garbage collection as one source of higher-than-usual memory utilization. On a timeseries graph of heap memory utilization for a single process, garbage collection forms a sawtooth pattern (e.g., the JVM)—if the sawtooth does not return to a steady baseline, you likely have a memory leak. To see if your process’s runtime is garbage collecting as expected, graph the count of garbage collection events alongside heap memory usage.
Alternatively, you can search your logs for messages accompanying the “cliffs” of the sawtooth pattern. If you run a Go program with the GODEBUG environment variable assigned to gctrace=1, for example, the Go runtime will output a log every time it runs a garbage collection. (The screenshot below shows a graph of garbage collection log frequency over time, plus a list of garbage collection logs.)
Another factor has to do with the work that a process is performing. If an application is managing memory in a healthy way (i.e., without memory leaks) but still using more than expected, the application may be handling unusual levels of work. You’ll want to graph work metrics for memory-heavy applications, such as request rates for a web application, query throughput for a database, and so on.
Find unnecessary allocations
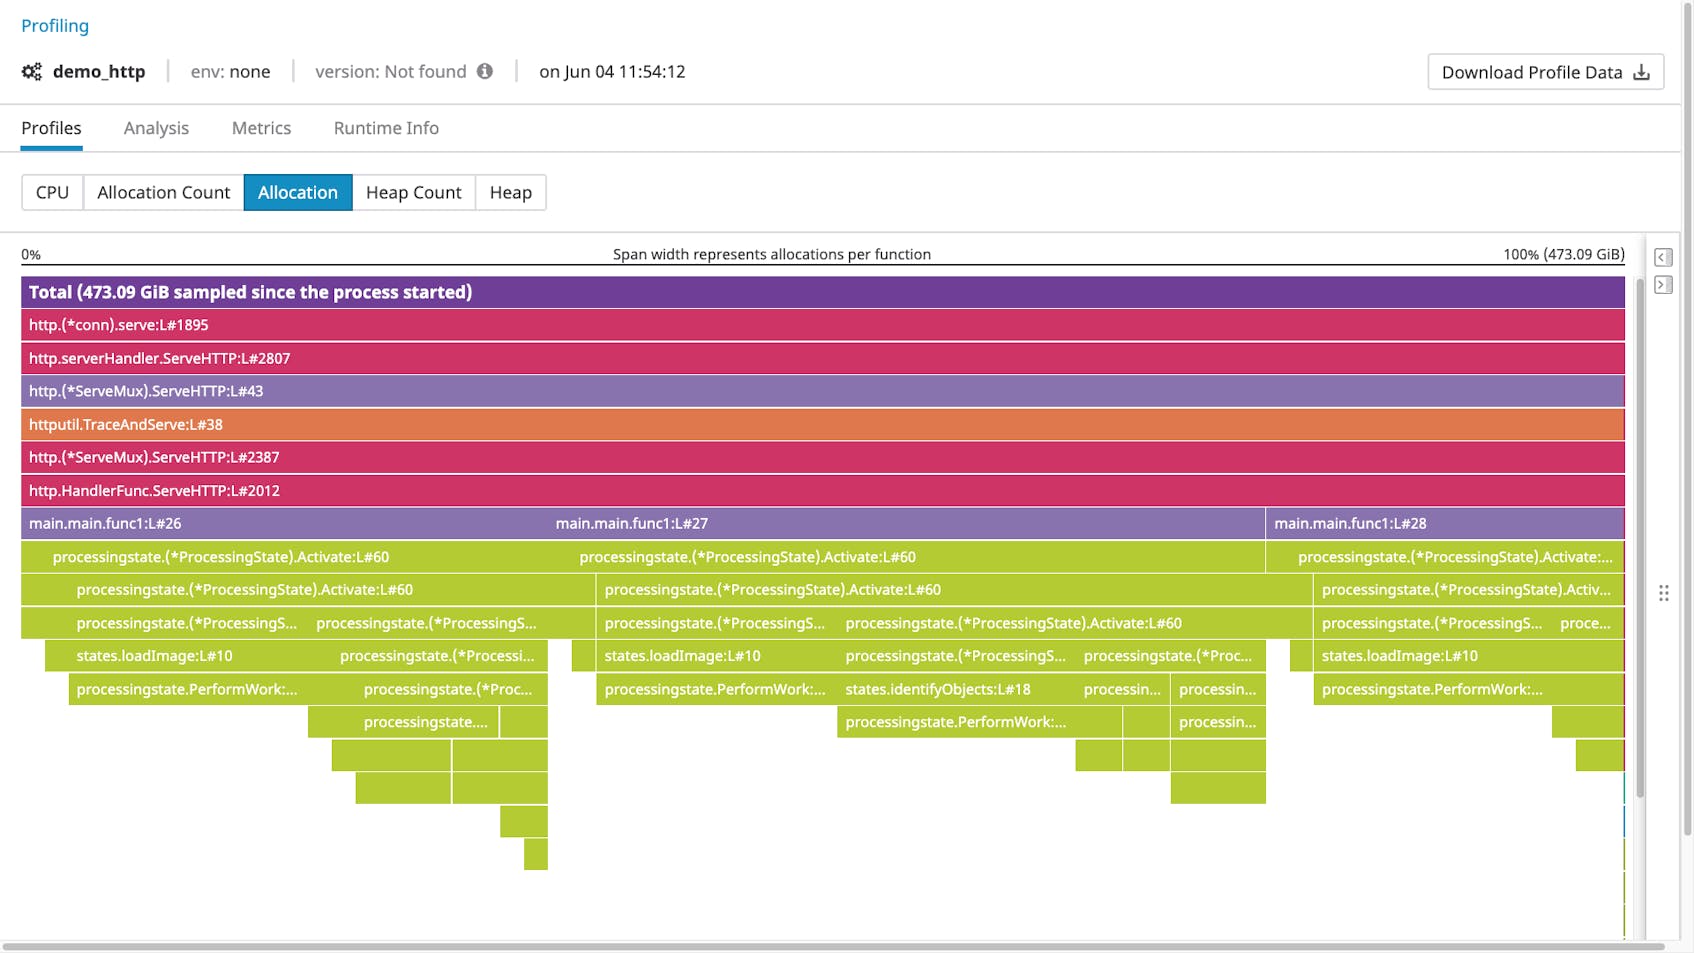
If a process doesn’t seem to be subject to any aggravating factors, it’s likely that the process is requesting more memory than you anticipate. Profiles help you identify particularly memory-intensive requests by visualizing both the order of function calls within a call stack and how much heap memory each function call allocates. By examining the parents and children of a particular function call, you can determine why a heavy allocation is taking place. For example, a profile could include a memory-intensive code path introduced by a recent feature release, suggesting that you should optimize the new code for memory utilization.
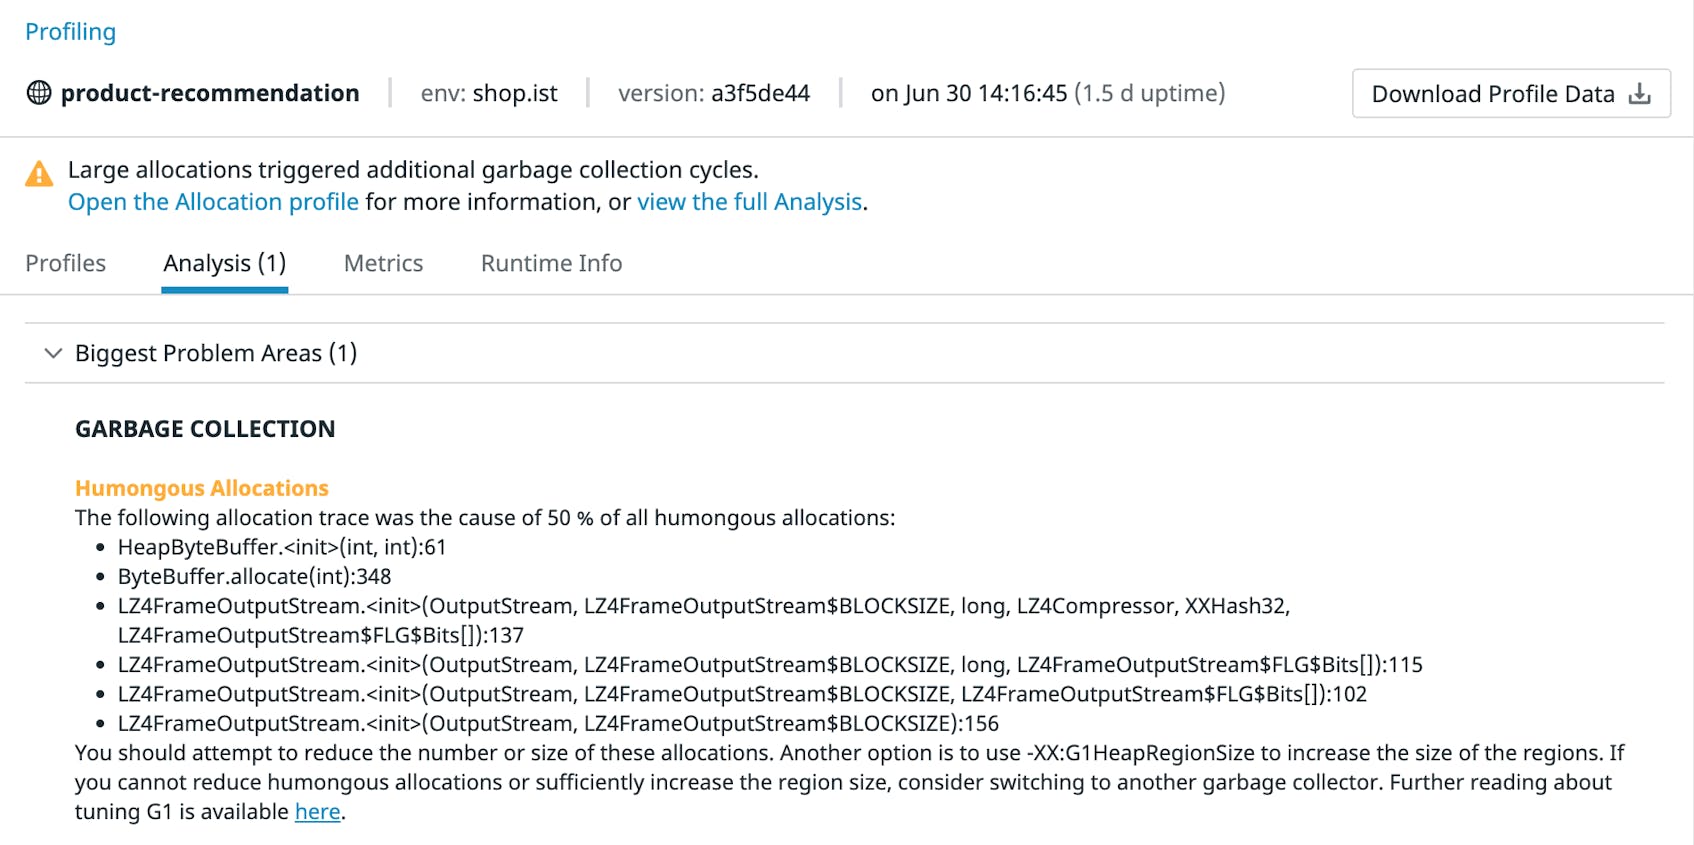
Datadog Continuous Profiling enables you to gather memory profiles from your code automatically—even in production. And for applications written in Java, an “Analysis” tab (below) will indicate possible sources of especially high memory utilization, such as humongous allocations, potential memory leaks, and stalled garbage collections.
Get notified
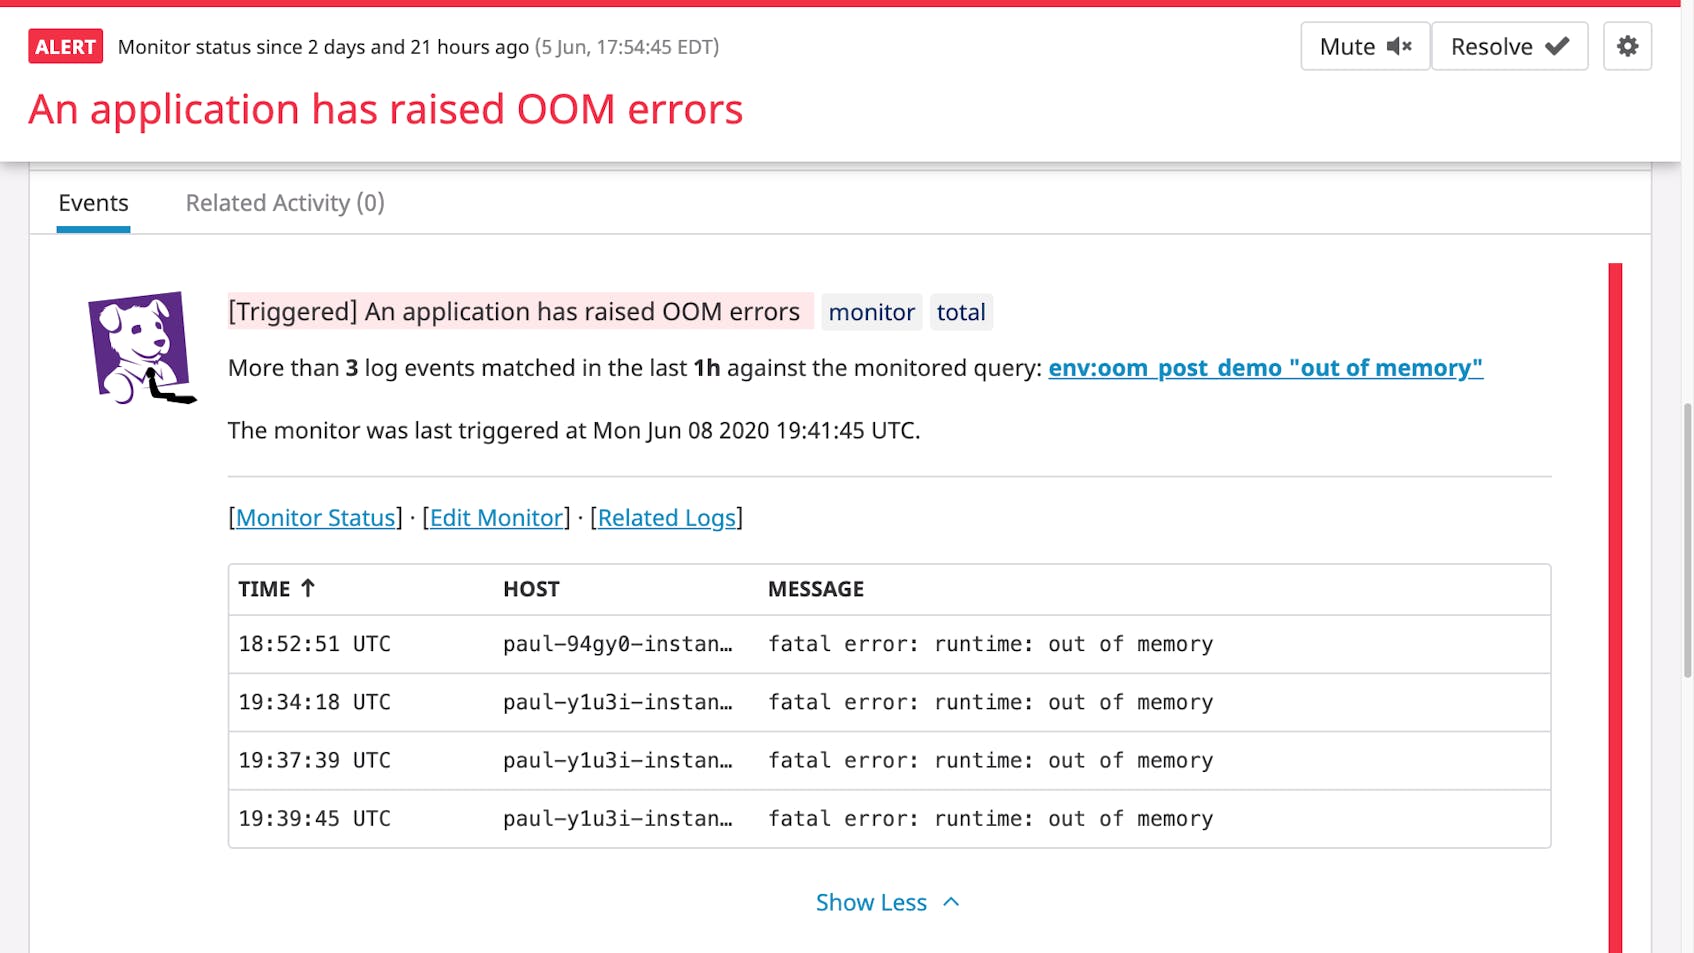
The most direct way to find out about OOM errors is to set alerts on OOM log messages: whenever your system detects a certain number of OOM errors in a particular interval, Datadog can alert your team. But to prevent OOM errors from impacting your system, you’ll want to be notified before OOM errors begin to terminate processes. Here again, knowing the healthy baseline usage of virtual memory and RSS utilization allows you to set alerts when memory utilization approaches unhealthy levels. You can use Datadog to forecast resource usage and alert your team based on expected trends, and flag anomalies in system metrics automatically.
Investigate OOM errors in a single platform
OOM errors cause processes to exit unexpectedly, threatening the availability of your applications and infrastructure. Without a monitoring platform that gives you visibility into OOM errors, a terminated process might be your only sign that something is wrong. Since the Linux kernel provides an imprecise view of its own memory usage and relies on page allocation failures to raise OOM errors, you need to monitor a combination of OOM error logs, memory utilization metrics, and memory profiles.
Datadog unifies all of these sources of data in a single platform, so you get comprehensive visibility into your system’s memory usage—whether at the level of individual processes or across every host in your environment. To stay on top of memory saturation issues, you can also set up alerts to automatically notify you about OOM logs or projected memory usage. By getting notified before OOM errors are likely to occur, you’ll know which parts of your system you need to investigate to prevent application downtime. If you’re curious about using Datadog to monitor your infrastructure and applications, sign up for a free trial.


