Bowen Chen
When your organization relies on hundreds or thousands of hosts, it can be difficult to ensure that each is equipped with the proper tools and configurations. Configuration management tools like Ansible are designed to help you automatically deploy, manage, and configure hosts across your on-prem and cloud infrastructure. In this post, we’ll show you how to use Ansible to automate the installation of the Datadog Agent on a dynamic inventory of Windows hosts. We’ll also show you how to get deep visibility into your environment by using Ansible to configure Datadog’s Windows Event Logs and SQL Server integrations, as well as Live Process monitoring.
In this guide, we will run Ansible on Amazon EC2 instances, but you can apply a similar workflow to other tools and cloud platforms. Datadog integrates with other configuration management tools such as Chef, SaltStack, and Puppet, so you can select the option that best suits your use case.
How to use Ansible to install the Datadog Agent in your Windows environment
Ansible is an automation tool that enables you to deploy and manage hosts at scale. Ansible is installed on a central control node that controls a fleet of managed nodes (also referred to as hosts). Building Ansible inventories enables you to uniformly configure and manage groups of hosts with playbooks. A playbook assigns a list of repeatable operations—such as installing software, running command scripts, and creating Windows users and groups—to execute on managed hosts within an inventory.
Before getting started, make sure that you have met the following prerequisites:
- Your managed hosts are running a Windows OS version that is supported by the Datadog Agent and by Ansible.
- Your managed hosts are running PowerShell 3.0+ and .NET 4.0+.
- Your control node is running an up-to-date version of Ansible (2.14 at the time of publication). Note: Ansible manages Windows hosts from a Linux-based control node that uses dedicated Windows modules.
- Your control node is running a version of Python supported by your Ansible version.
- You have created and activated a WinRM listener on each of your managed Windows hosts.
- You have configured an AWS IAM user or assumed an IAM role that has been granted the
AmazonEC2FullAccesspermission.
Build an inventory of hosts
You can verify that Ansible is installed on your control node by checking for a default ansible.cfg configuration file, typically located in your /etc/ansible directory. This file can be modified to enable plugins, set inventory paths, and more; see the documentation for details.
Next, you’ll need to create an Ansible inventory, which specifies the hosts that your control node is able to manage. You can build your inventory with a combination of static and dynamic sources, such as inventory plugins, scripts, or a list of hosts. In this guide, we’ll use Ansible’s Amazon EC2 plugin to compile a dynamic inventory of hosts that are filtered with EC2 tags.
By default, Ansible will look for a hosts.yaml file in /etc/ansible/ to use as its primary inventory source. You can also create a hosts subdirectory that enables you to compile an inventory using a mix of static and dynamic sources. In our example, we’ll create an inventory_windows_aws_ec2.yaml file in our /etc/ansible/host subdirectory, shown below. Note: your inventory file must end in aws_ec2.{yml|yaml} in order to be parsed by the EC2 plugin.
plugin: aws_ec2regions: - us-east-1filters: platform: "windows"keyed_groups: - prefix: tag key: tagsaws_access_key_id: <AWS_ACCESS_KEY>aws_secret_access_key: <AWS_SECRET_KEY>This example shows how you can use the filters parameter to select only the EC2 instances running on a Windows platform. (AWS will automatically set an instance’s platform type based on its AMI.) This enables you to create a dynamic inventory that automatically scales to include new Windows EC2 instances as they come online. Similarly, you can limit your Ansible inventory to EC2 instances within a specific region using the regions parameter.
The keyed_groups parameter enables you to reference groups of hosts within this filtered selection. keyed_groups will generate groups of managed hosts based on a key value (EC2 tags in our example, but you can customize this field to use any EC2 filter).
Ansible will generate and declare groups by combining the prefix string with each key:value pair of the declared key, separated by underscores. You can then use these group names within playbooks to allow Ansible to manage subsets of nodes. For example, a group of EC2 instances tagged with datadog:yes with a prefix of tag will be referenced as tag_datadog_yes in the Ansible playbook we’ll create later in this post.
Before moving on, make sure Ansible has secure access to your AWS access keys. For the purpose of this tutorial, we’ve included the keys in the example file, but in production, you can use a solution like Ansible Vault to encrypt your access key variables or the file they’re stored in.
Next, install Ansible’s EC2 plugin on your control node:
ansible-galaxy collection install amazon.awsThe EC2 plugin relies on the Boto3 SDK to help manage AWS services. You can install it on your control node using the following command:
python3 -m pip install --user botocore boto3Now you can test your inventory configuration on your control node:
ansible-inventory —-graphThis should output your EC2 Windows hosts separated by your designated tags keyed groups as such:
|--@tag_datadog_yes:| |--ec2-54-162-104-59.compute-1.amazonaws.com| |--ec2-54-165-50-204.compute-1.amazonaws.comAnsible also supports other platforms such as GCP, Kubernetes, and Azure. Refer to the documentation to learn more about dynamic inventories.
Connect the control node to your managed hosts
To allow your control node to communicate with your managed Windows nodes via HTTP/HTTPS, you’ll need to configure WinRM. You can begin by installing the pywinrm package on your control node:
pip install "pywinrm>=0.3.0"Before proceeding, make sure you’ve set up a WinRM listener on each managed host, using the configuration method of your choice. In order for the listener to receive requests, you’ll also need to configure a mode of authentication. You can declare your authentication settings along with other variables to apply to a keyed group in a separate variable file within a /group_vars directory, as shown below.
ansible_user: "ansible_user"ansible_password: "securepassword123$"ansible_port: 5986ansible_connection: winrmansible_winrm_transport: basicansible_winrm_server_cert_validation: ignoreansible_become: noWhen running playbooks, Ansible will automatically detect variable files in this directory and pair it with the appropriate host group (e.g., EC2 instances tagged with datadog:yes) based on the file name (e.g., tag_datadog_yes). In our variables file, we’ve included the credentials for a Windows domain user with admin privileges that will execute commands on each managed host, alongside the WinRM listening port and authentication method. For demonstration purposes, we are using basic authentication; however, HTTP encrypted options such as Kerberos and CredSSP are also supported.
To verify that the control node is able to communicate with your managed hosts, run the following ping module command from your control node:
ansible -i <INVENTORY_PATH> -m ansible.windows.win_ping <HOST_GROUP>You should see the following ping:pong output in your terminal:
[ec2-user@ip-xxx-xx-xxx-xx ~]$ansible -i /etc/ansible/hosts/windows_inventory_aws_ec2.yaml -m ansible.windows.win_ping tag_datadog_yes
ec2-xx-xx-xx-xxx.compute-1.amazonaws.com | SUCCESS => { "changed": false, "ping": "pong"}
ec2-xx-xxx-xxx-xxx.compute-1.amazonaws.com | SUCCESS => { "changed": false, "ping": "pong"}Install Datadog’s Ansible role and configure your playbook
Once you’ve built your inventory, it’s time to create a playbook to automatically install the Datadog Agent on a group of managed hosts. You can get started by installing the Windows collection on your control node:
ansible-galaxy collection install ansible.windowsYou’ll also need to install Datadog’s Ansible role:
ansible-galaxy install datadog.datadogRoles enable you to load files, libraries, and other related variables into your playbook so you can immediately get started without having to build your Ansible workflow from scratch. By assigning the Datadog role to your playbook, you’ll provide Ansible with the necessary code to install the Agent on your designated group of hosts. Our role also enables you to easily modify your Agent configuration by using variables such as datadog_config, as shown in the playbook below.
Create a datadog_playbook.yaml file in your project directory with the following configuration:
- name: Install Datadog Agent on Windows hosts hosts: tag_datadog_yes roles: - { role: datadog.datadog} vars: datadog_api_key: <DATADOG_API_KEY> datadog_config: tags: - env:devBelow, we’ll walk through each parameter included in this playbook.
The name parameter is fully customizable and should be used to specify the function of the playbook.
name: Install Datadog Agent on Windows hostsThe hosts parameter specifies the group of managed hosts that the playbook will run on. Previously, when we built our inventory, we used the keyed_groups parameter to create groups based on tags. Now, we can run our playbook on all Windows EC2 instances tagged with datadog:yes using the tag_datadog_yes host group. You can replace datadog:yes with any key:value tag that applies to your managed hosts.
hosts: tag_datadog_yesThe roles parameter applies the previously installed Datadog role that contains the necessary modules to download and install the Datadog Agent on your managed hosts.
roles: - { role: datadog.datadog}Under the vars parameter, you’ll need to insert your Datadog API key, which you can find or generate in your account’s API settings. We recommend encrypting this variable with Ansible Vault or placing it in a separate file alongside your other secure credentials.
vars: datadog_api_key: <DATADOG_API_KEY>The datadog_config parameter enables you to specify various Datadog Agent configuration options. This example shows how you can configure the Agent to apply an env:dev tag to any data it collects and forwards to Datadog.
datadog_config: tags: - env:devFinally, it’s time to run your playbook to install the Datadog Agent on your Windows hosts:
ansible-playbook -i <INVENTORY_PATH> datadog_playbook.yamlYou can verify that your hosts are running the Agent and connected to our platform using Datadog’s infrastructure list:
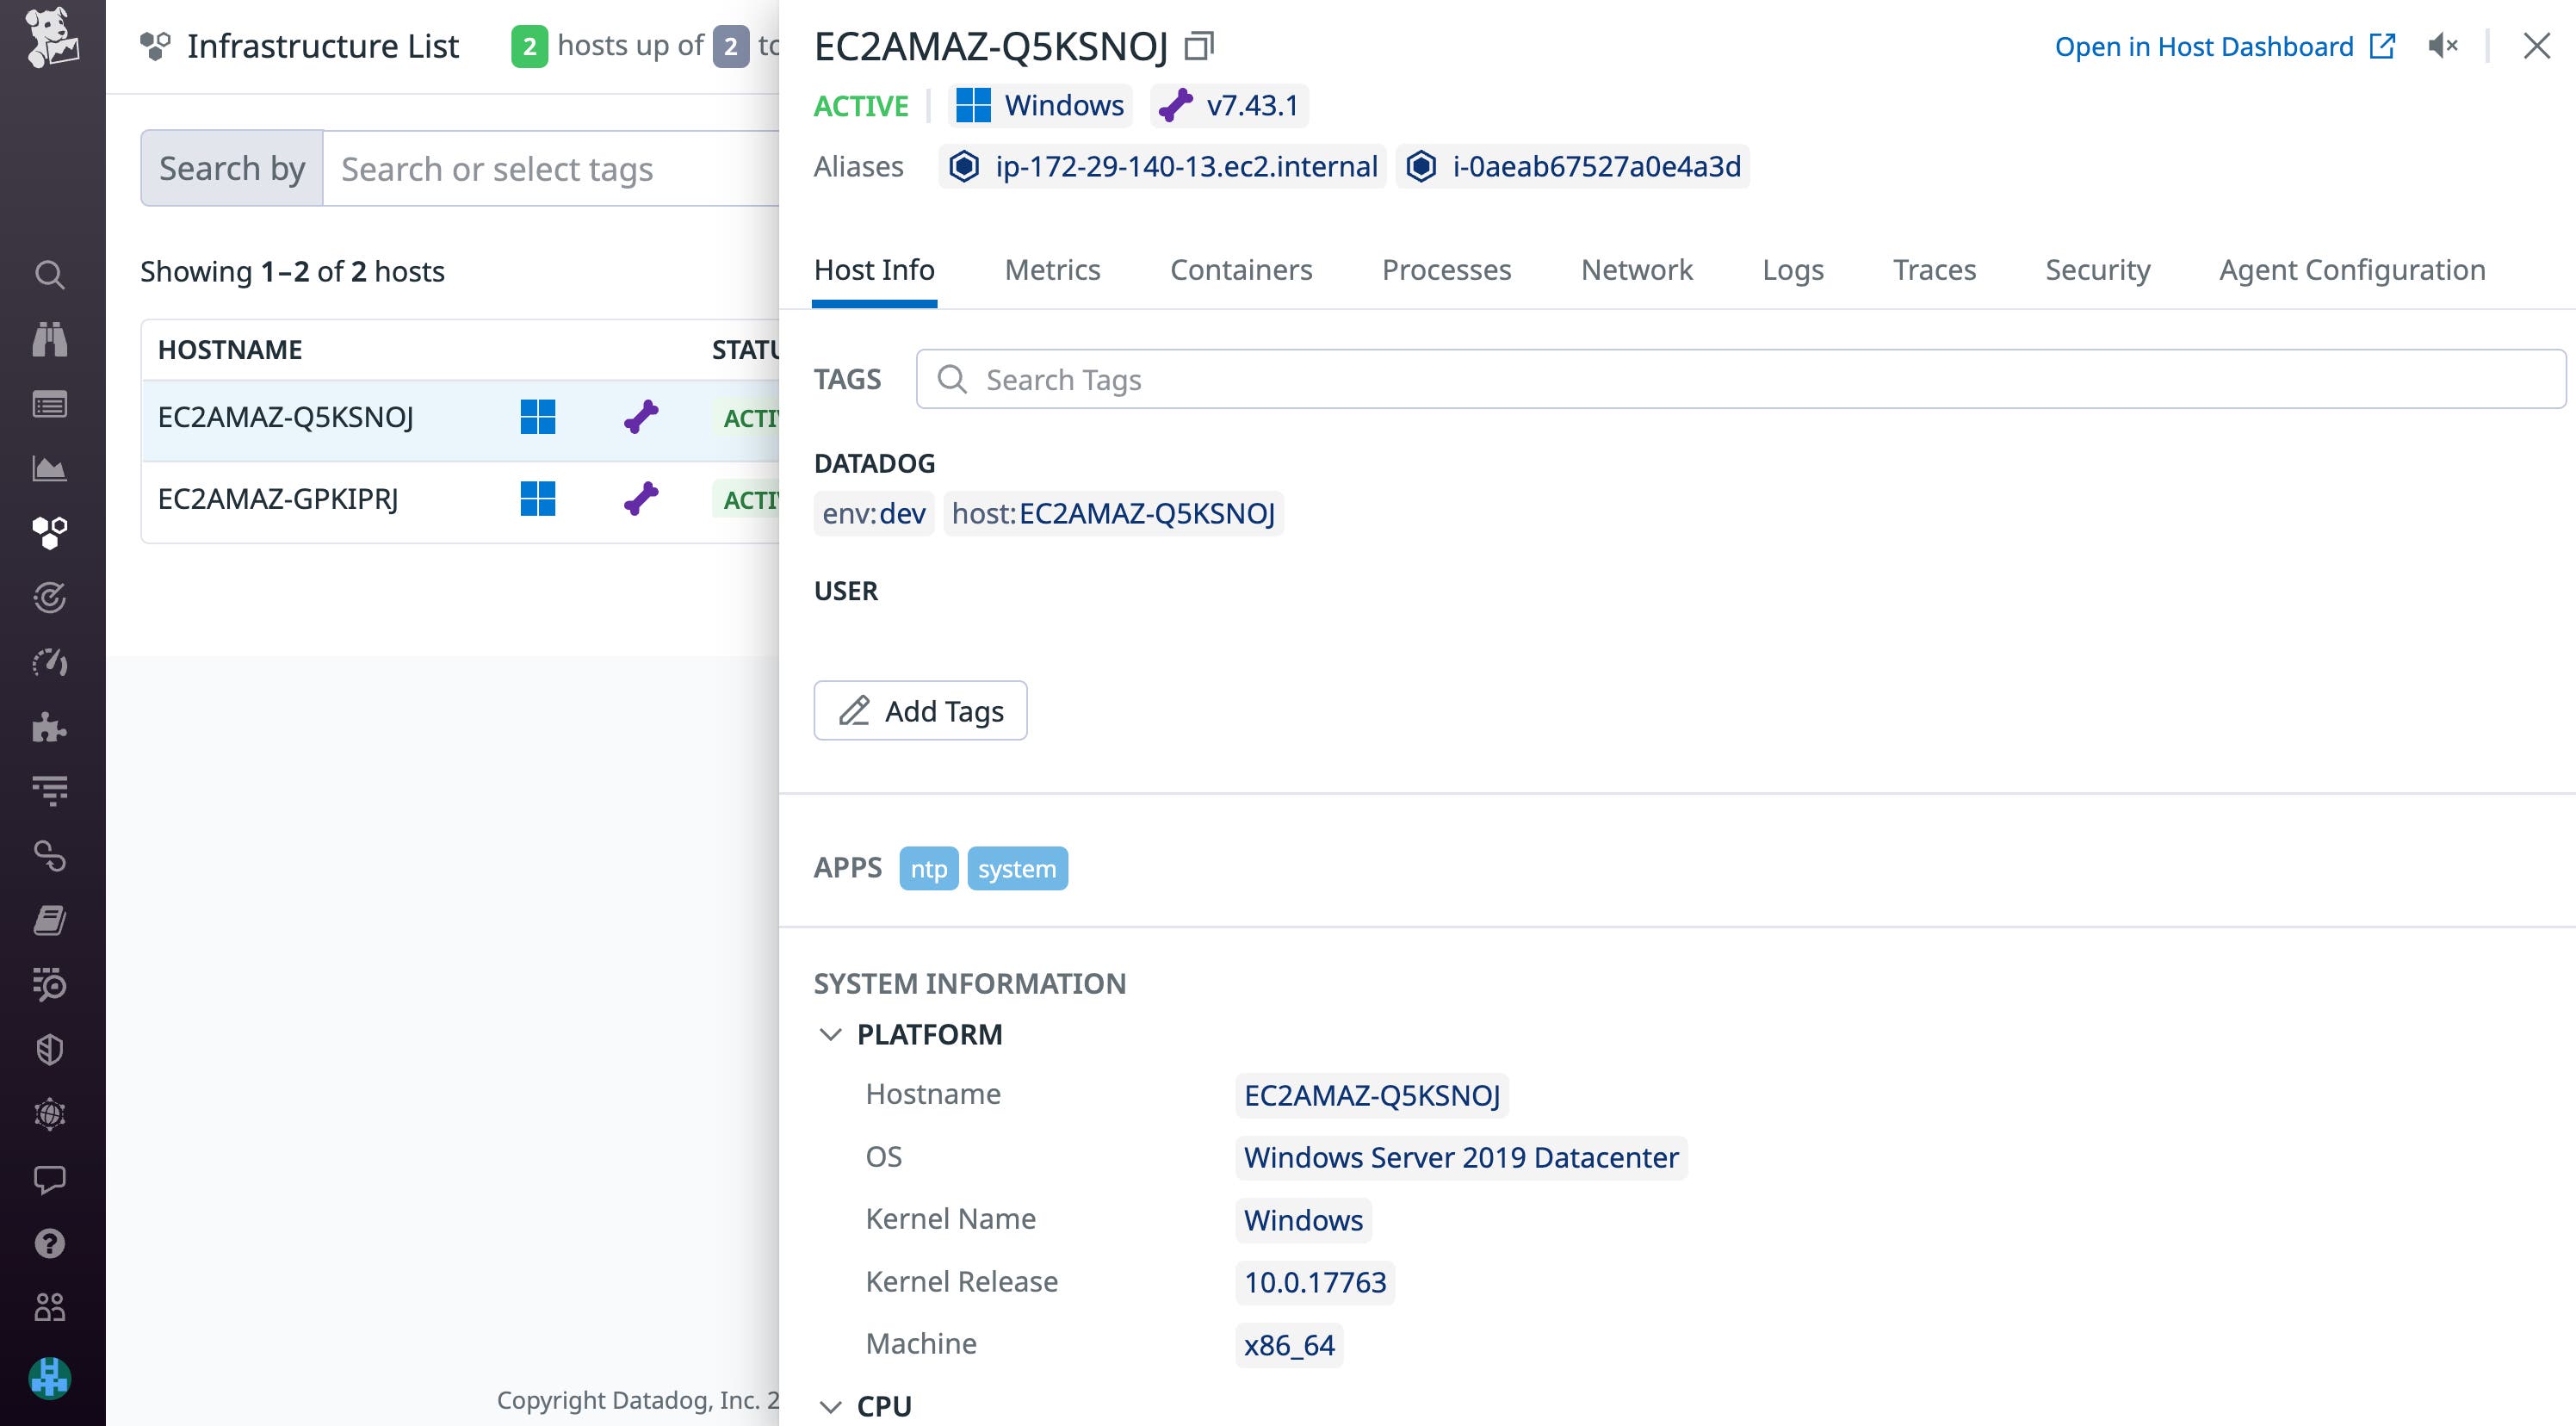
If you want to make any further configuration changes to the Datadog Agent after it’s been installed, you can do so by modifying and running your existing playbook. The Datadog role will automatically verify whether the Agent has been installed and apply any new integrations you’ve enabled to your managed hosts. See our documentation for a full list of configuration options for the Datadog role.
Configure Datadog integrations and Live Process monitoring
Once you’ve deployed the Agent on your Windows hosts, they will automatically begin sending system metrics to Datadog, such as CPU, disk, and memory. You may also want to collect and monitor additional data from your applications and infrastructure. In this section, we’ll show you how you can use Ansible to enable Datadog’s SQL Server and Windows Event Logs integrations, as well as Live Process monitoring.
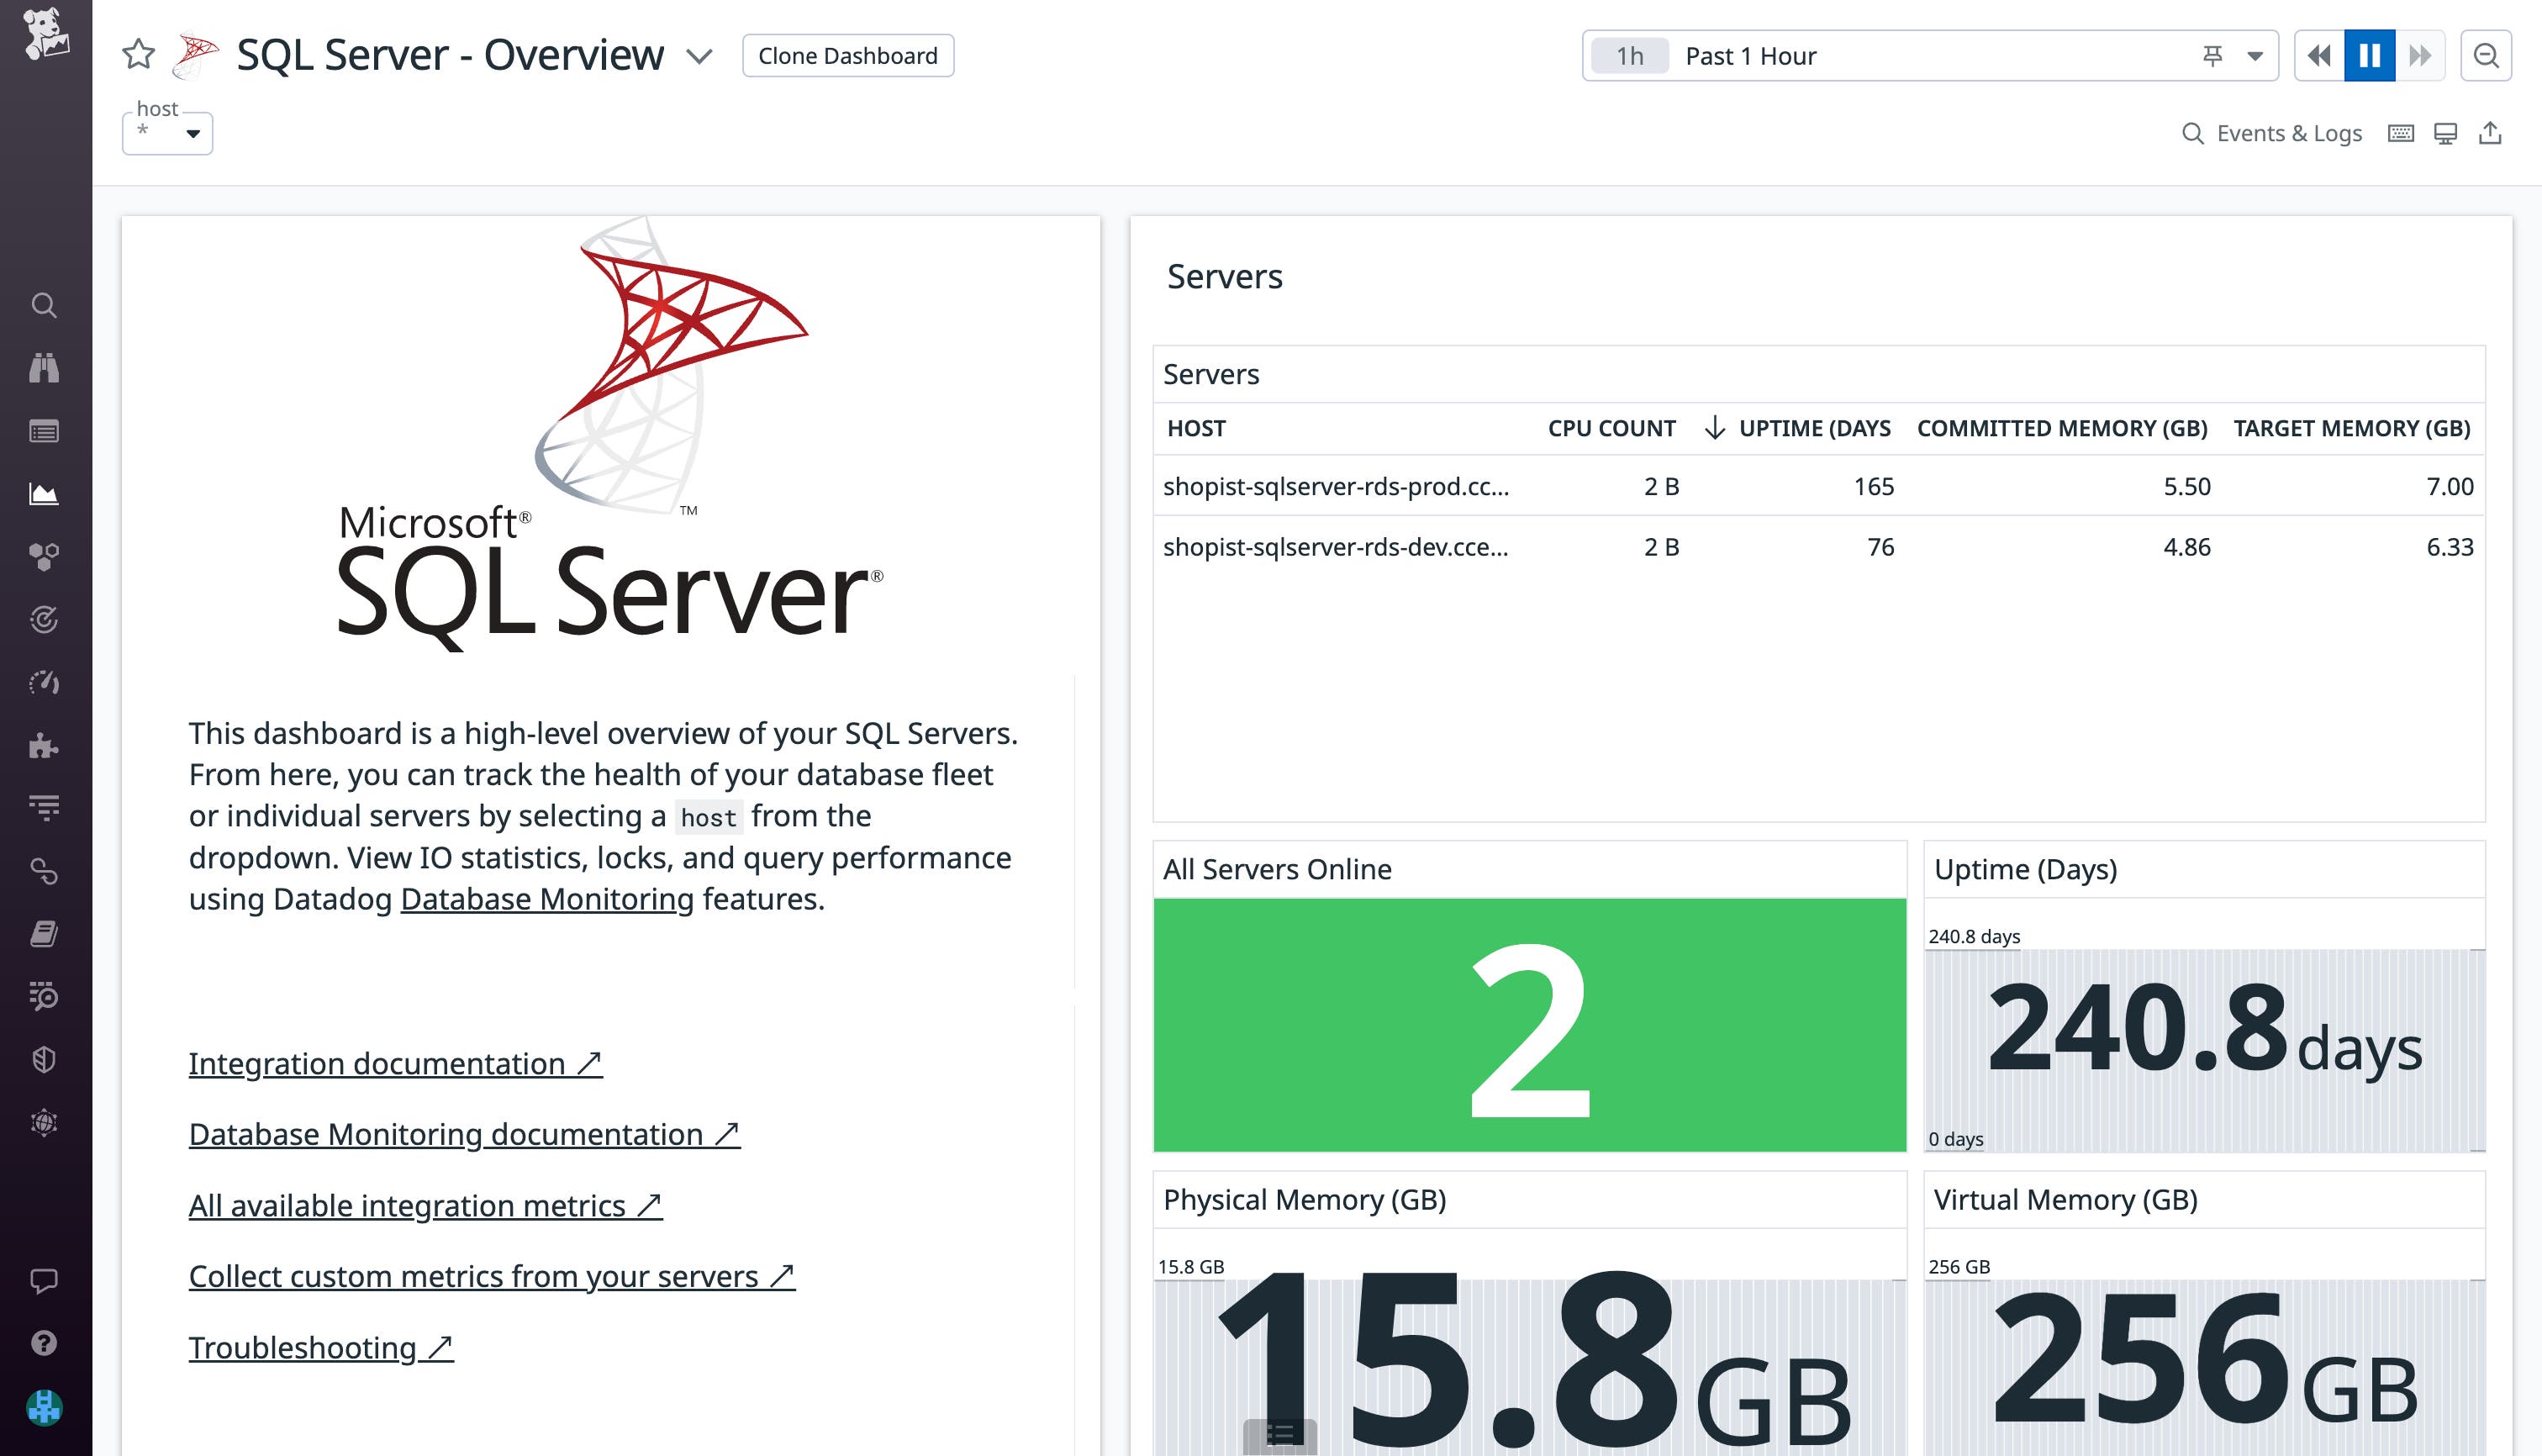
Configure Datadog’s SQL Server integration
Datadog’s SQL Server integration includes an out-of-the-box dashboard, enabling you to immediately monitor key metrics from your SQL Server instance, such as batch requests and user connections.
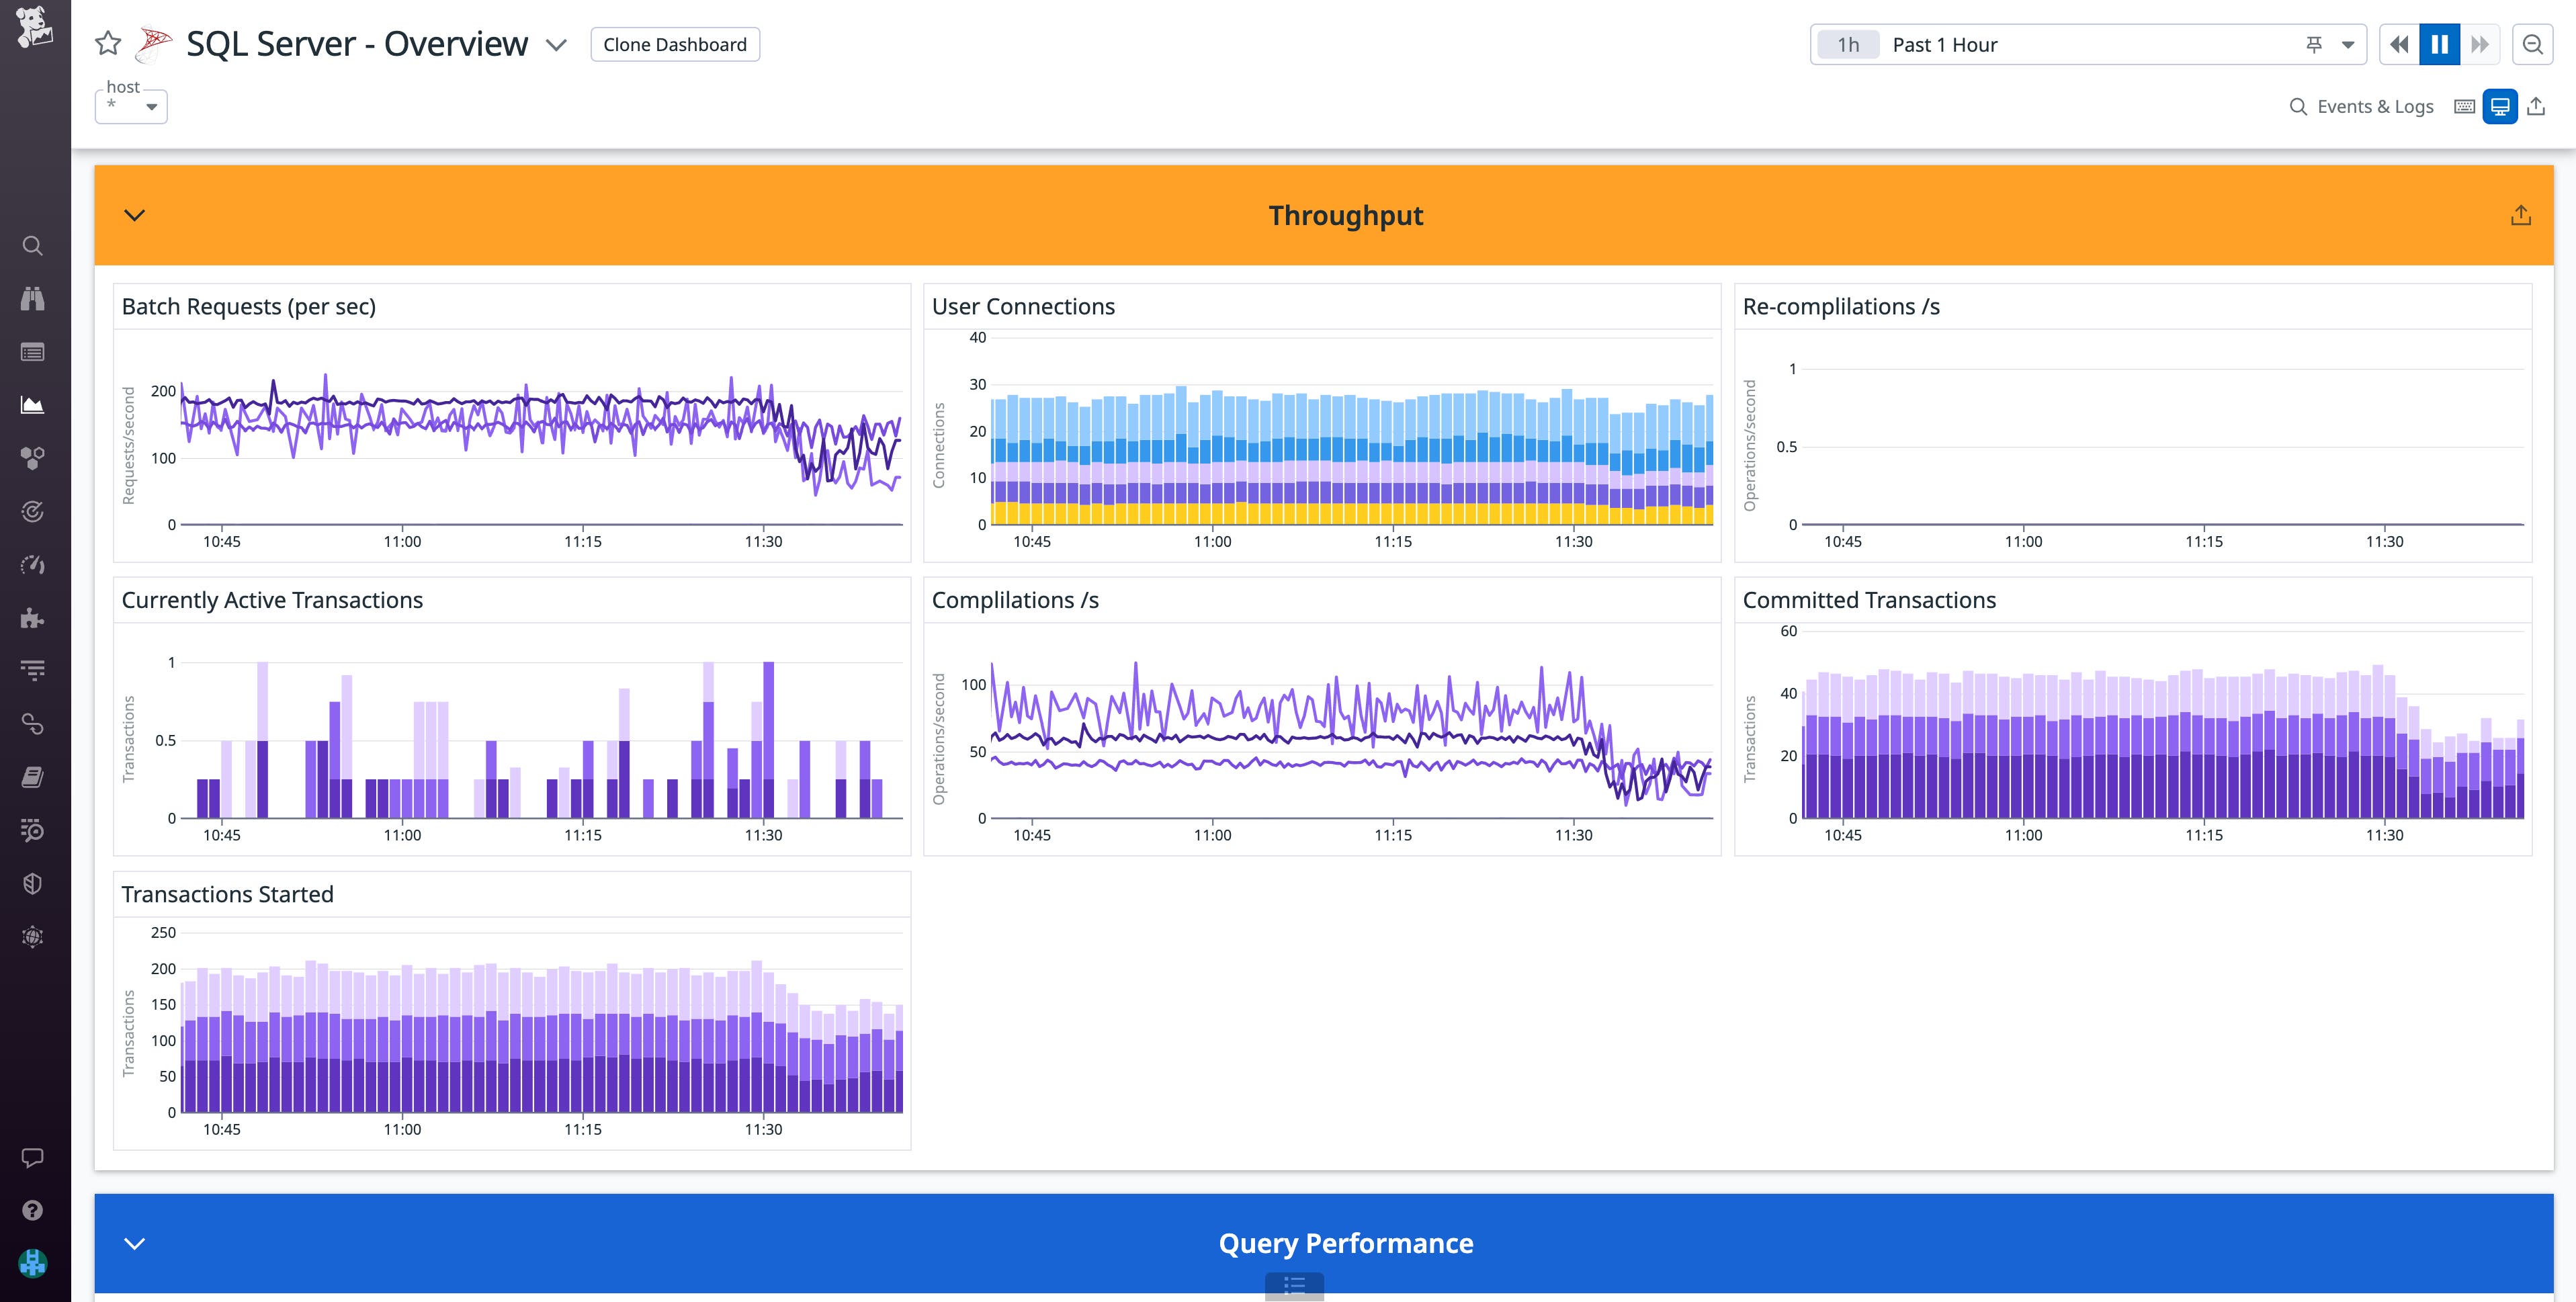
To enable the integration, you will need to configure a datadog user with the proper permissions to access your database, as described in our documentation. You can then configure the SQL Server integration within the datadog_checks parameter, as shown below. To avoid storing your password as plaintext, you can use Ansible Vault or Datadog’s secrets management package to encrypt your credentials.
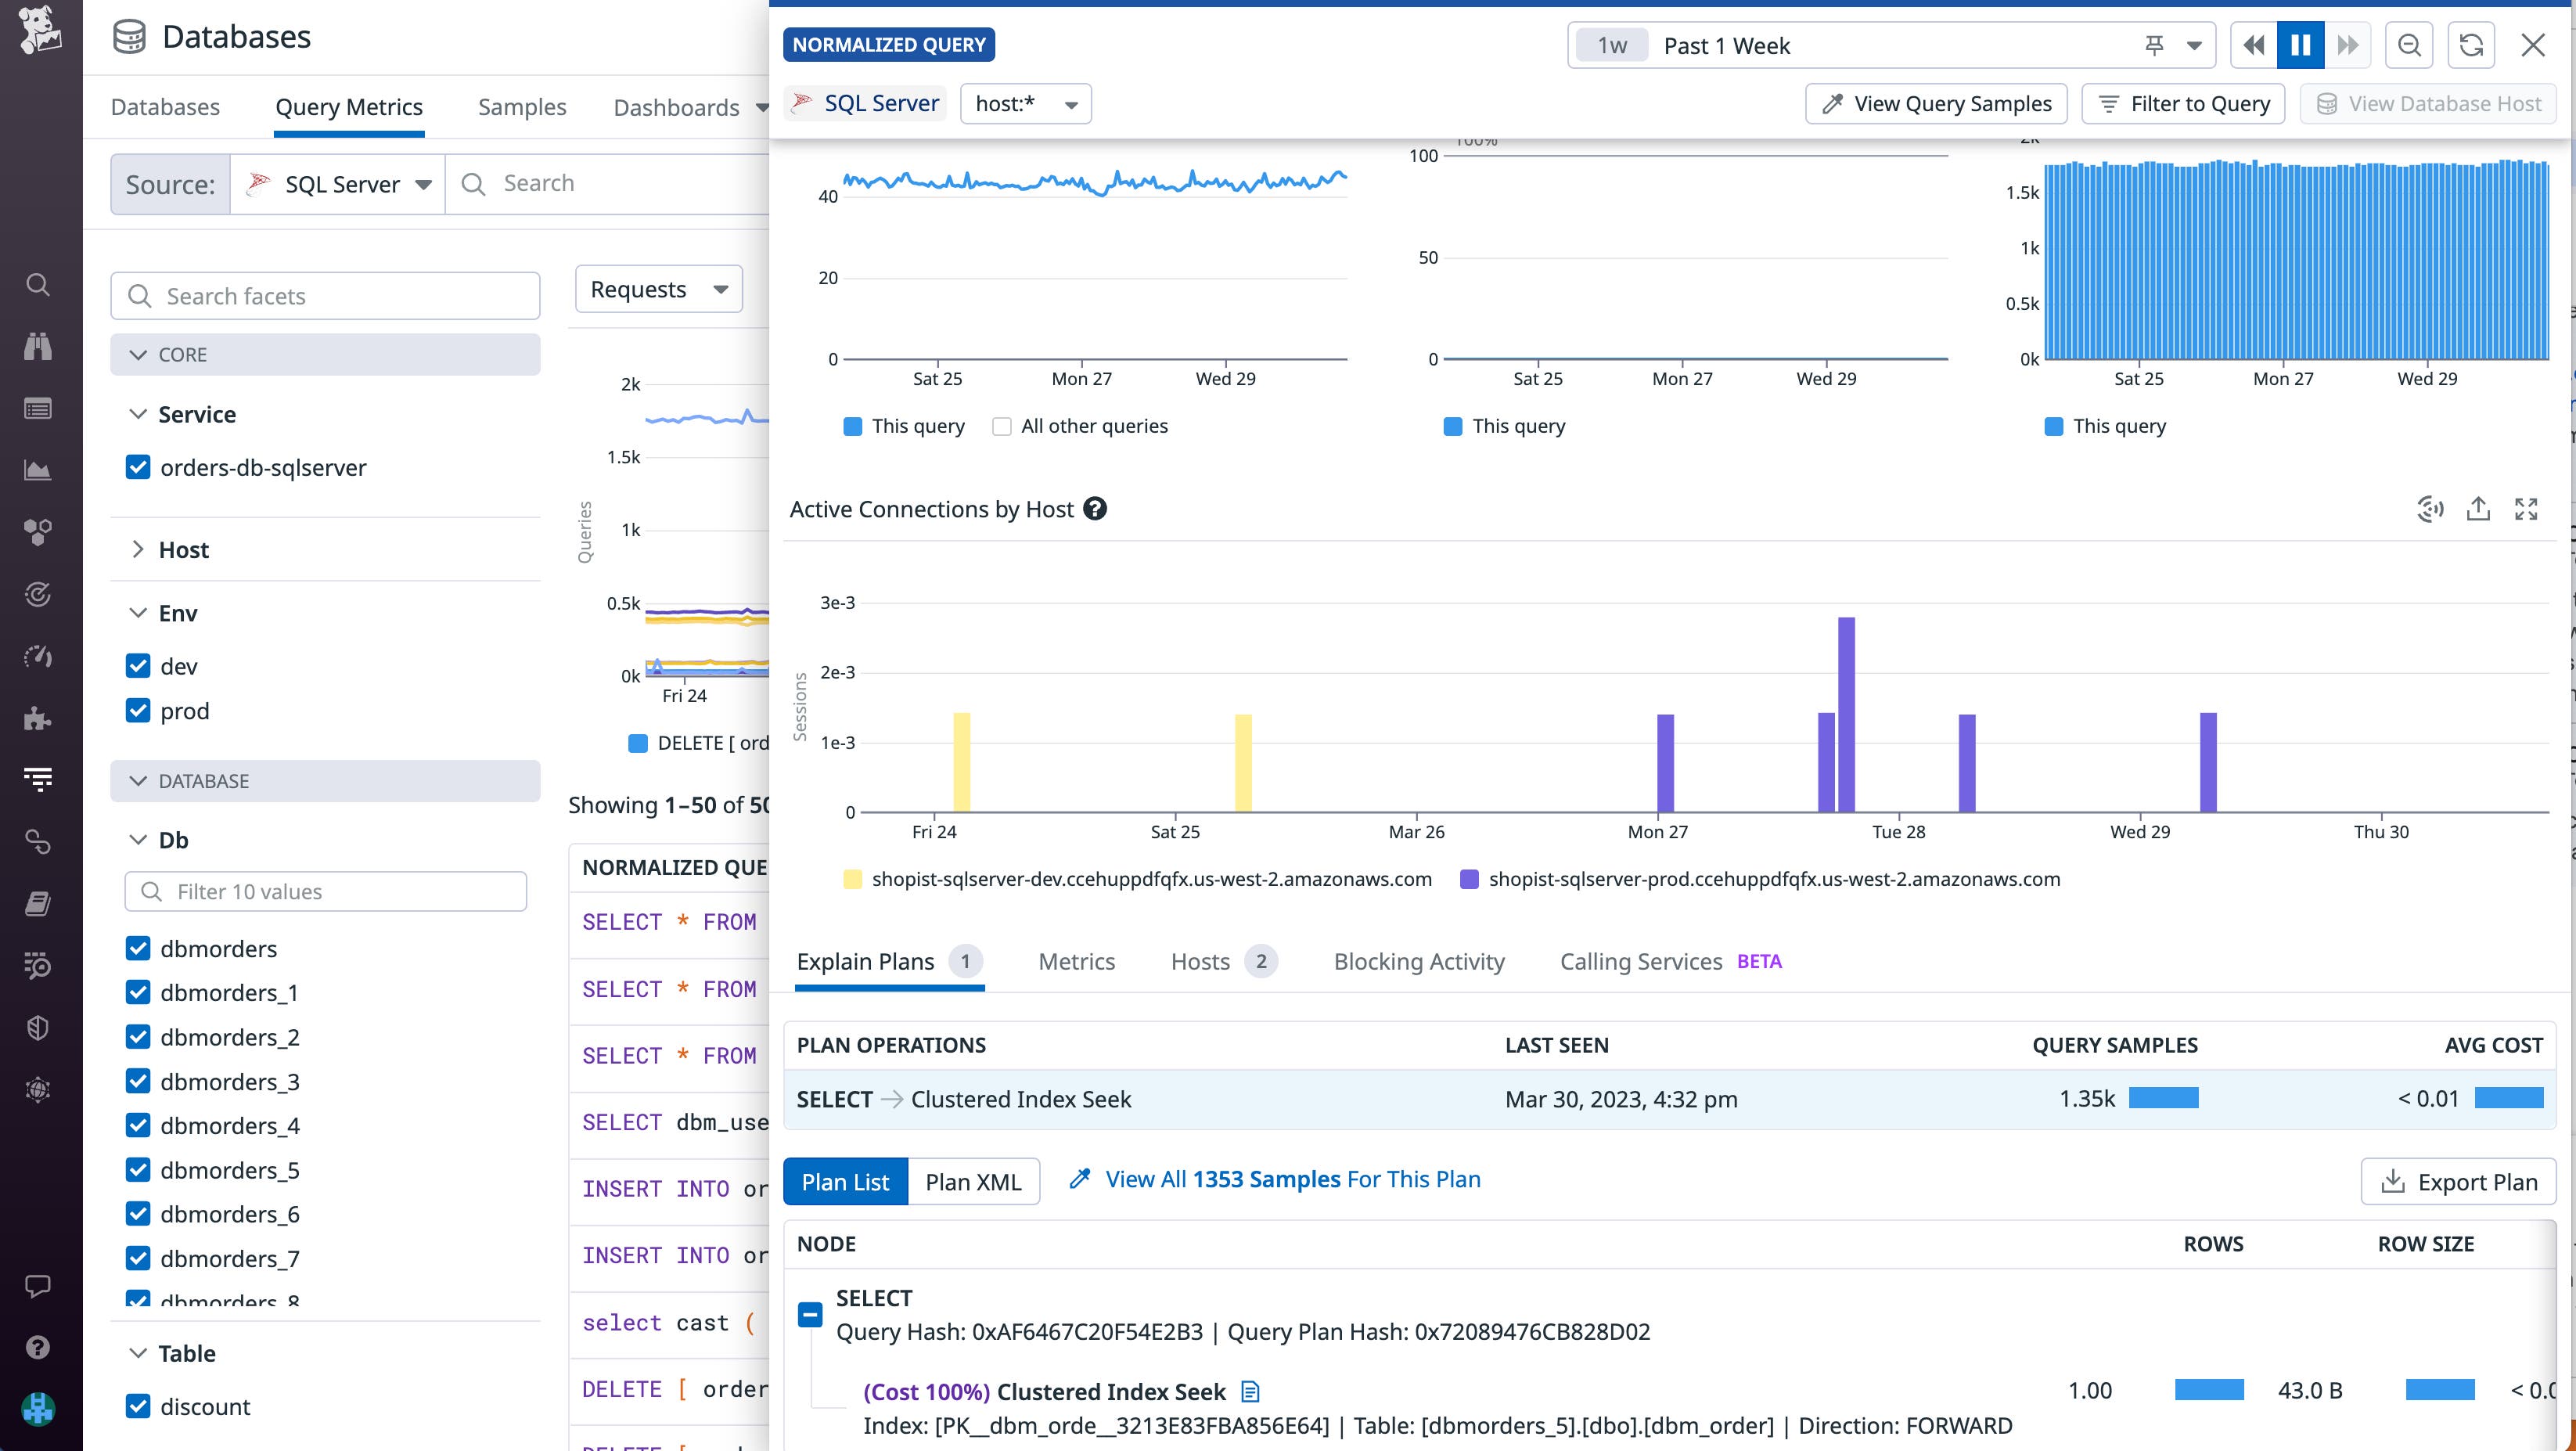
[…] datadog_checks: sqlserver: init_config: instances: - host: "<SQL_HOST>,<SQL_PORT>" username: datadog password: "<PASSWORD>" connector: odbc driver: SQL Server…For deeper insights into your database, you can navigate to query metrics in Datadog Database Monitoring. By inspecting a normalized query, you can view metrics such as its average latency in comparison to other queries, request count, and active connections by host, alongside the query’s execution plan.
Monitor Windows processes
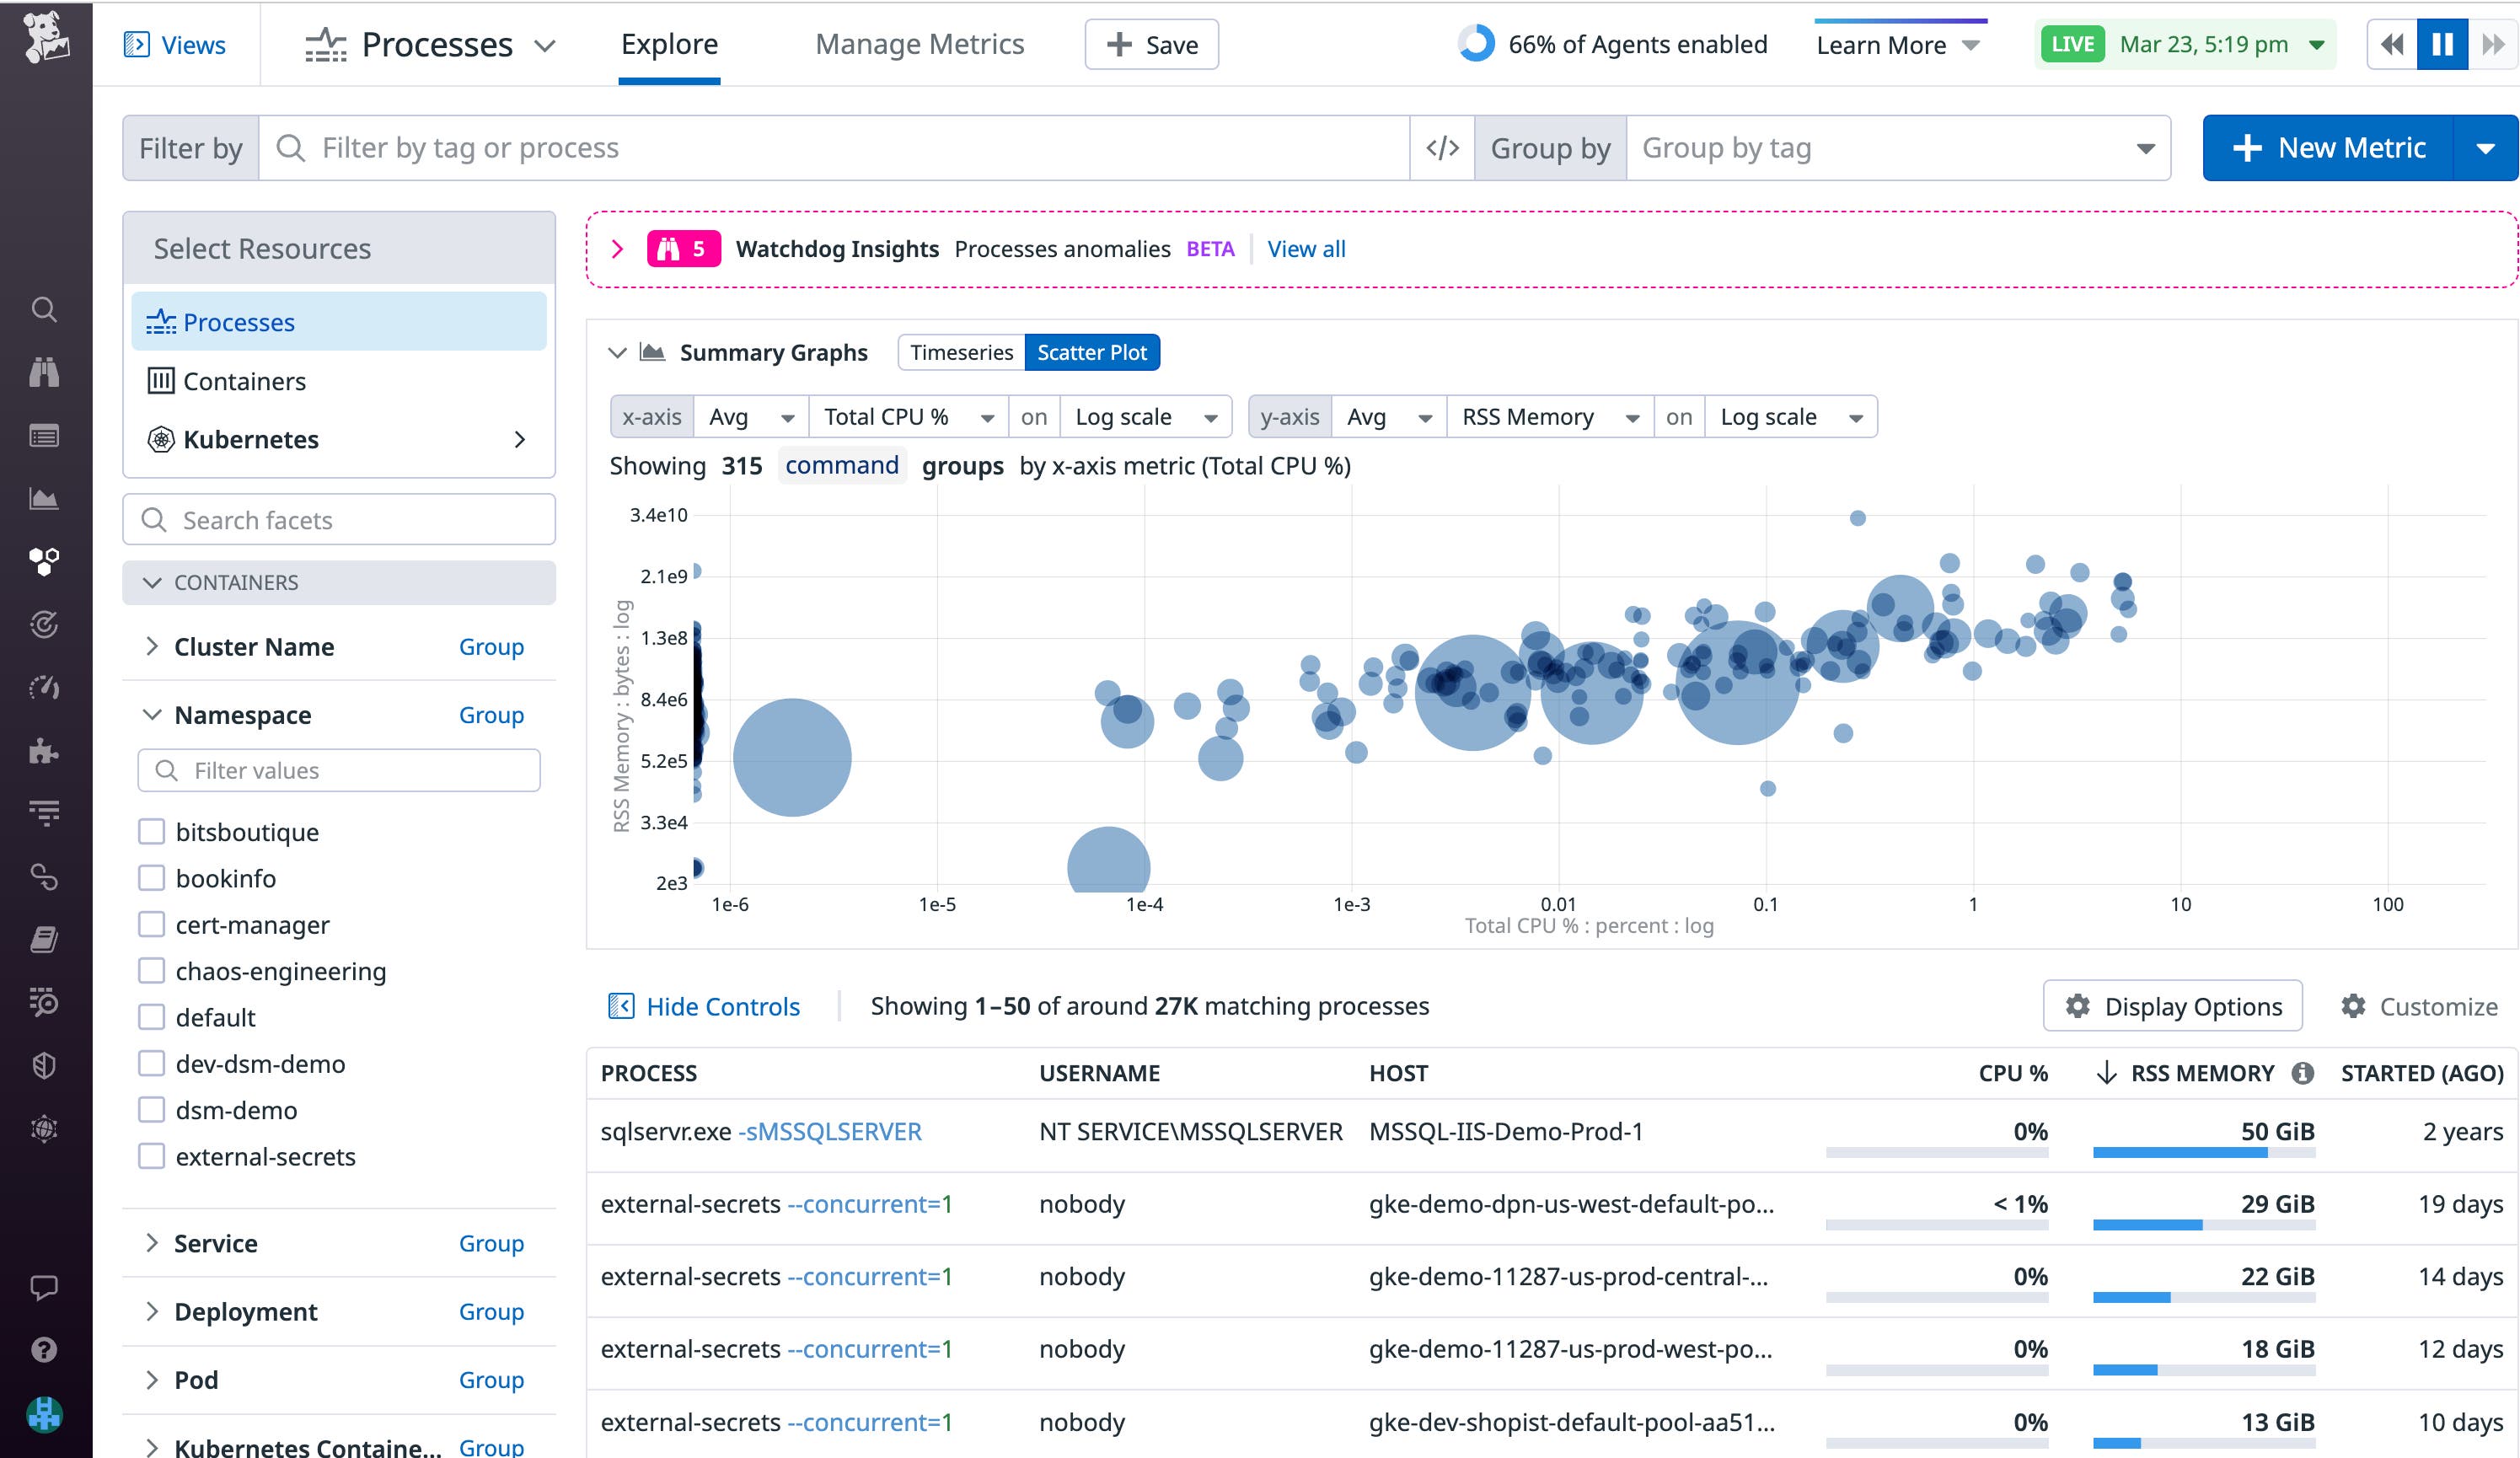
Datadog Live Processes provides real-time visibility into all the processes running in your environment. Identifying resource-intensive processes can help you troubleshoot lagging performance on a host or workload and be a starting point for resource optimization.
You can enable Live Processes within the the datadog_config parameter of your playbook, as shown below:
[…] datadog_config: process_config: proccess_collection: enabled: "true"…You can learn more about Datadog Live Processes in our blog post and documentation. For a full list of configuration options, you can view our datadog.yaml template file
Ingest Windows event logs
Windows event logs enable the operating system and applications to record errors, audit attempts, and other information. These logs are classified into different channels (such as security, application, and DNS server) depending on their origin. When an application restarts or your system experiences memory failure, event logs can provide additional context to help you determine the root cause.
Datadog enables you to visualize and alert on different types of Windows event logs. We recommend sending Windows event logs to Datadog as logs so you can leverage features like Watchdog Insights, which can automatically identify anomalies and outliers in your logs.
The following example shows how you can update your playbook to enable log collection and configure Datadog to collect Windows security event logs. Using the log_processing_rules parameter, you can configure the Agent to collect logs from a specific event channel and create a selection of event logs based on their event IDs. This enables you to reduce noise and monitor only significant events generated from the Security channel, such as failed logins and changes to group membership. For suggestions on Windows events to monitor, you can consult the documentation:
[…] datadog_config: logs_enabled: true
datadog_checks: win32_event_log: logs: type: windows_event channel_path: "Security" source: windows.events service: Windows log_processing_rules: - type: include_at_match name: relevant_security_events pattern: '"EventID":(?:{"value":)?"(1102|4624|4625|4634|4648|4728|4732|4735|4737|4740|4755|4756)"'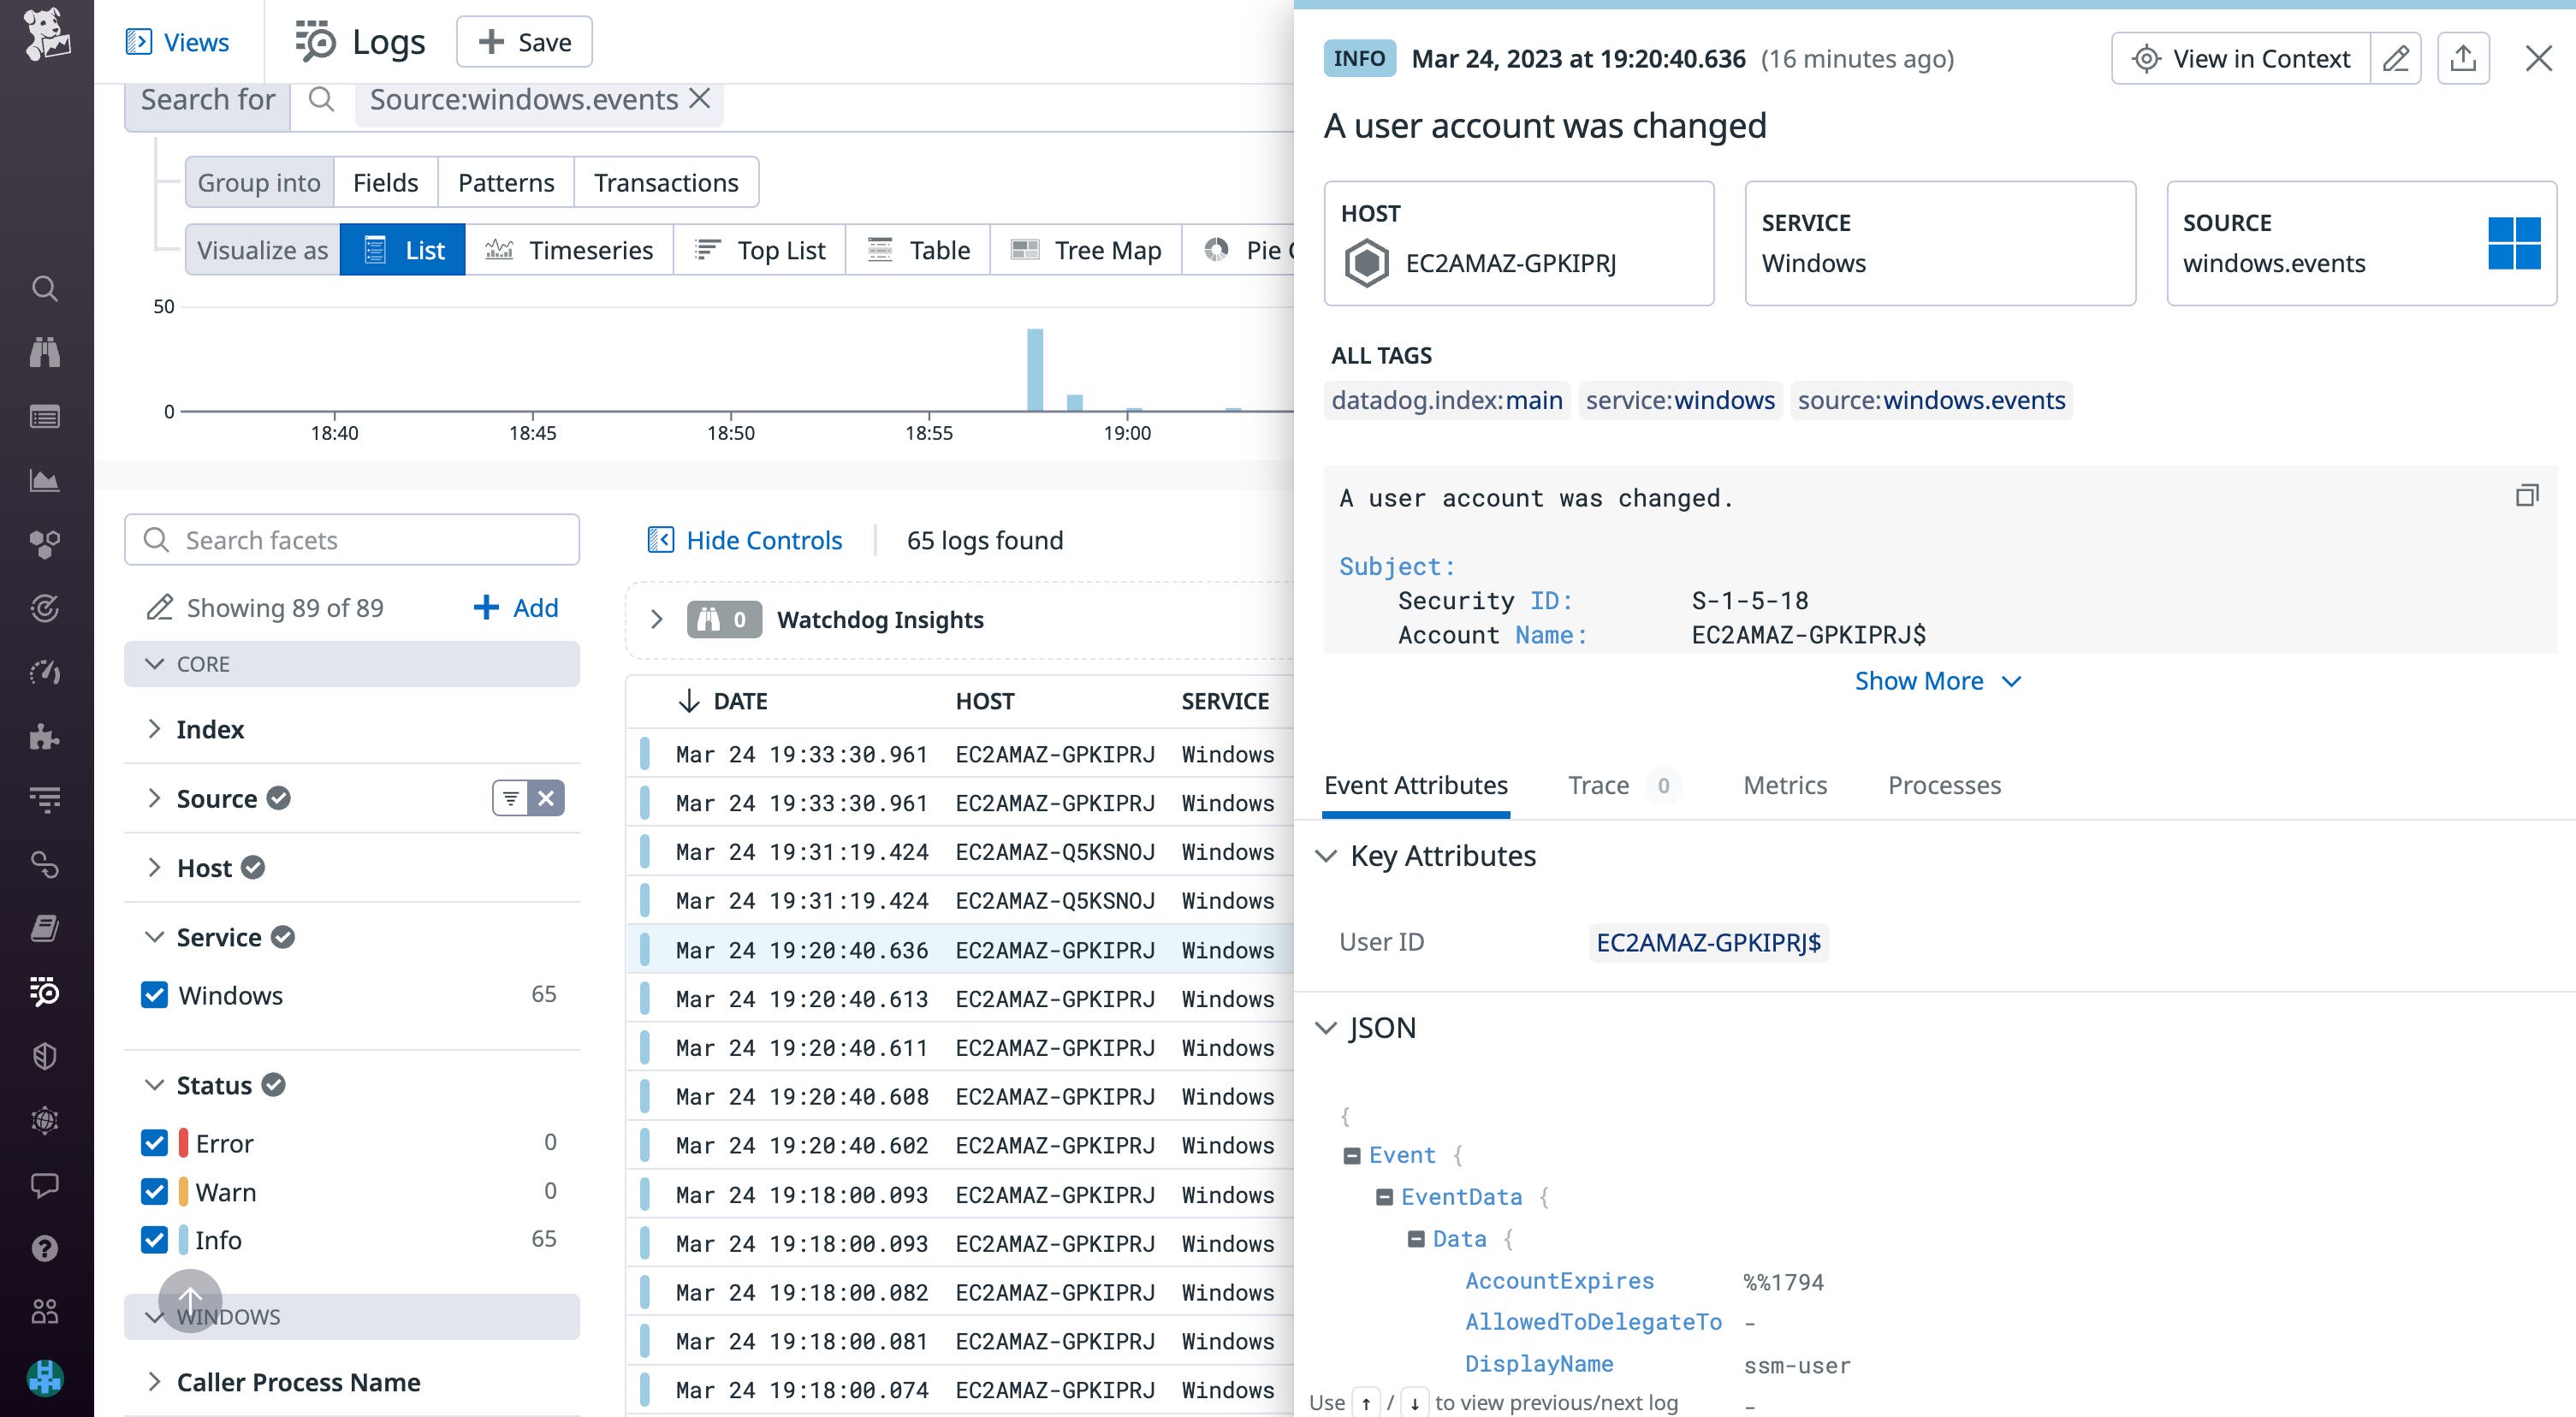
Expand your Windows automation with Datadog
In this post, we’ve seen how managing your Datadog Agent installation with a configuration management tool enables you to automatically get visibility into your Windows hosts as they scale. For more information about installing Datadog with Ansible, you can view our documentation. You can easily apply the workflows shown in this post to further enhance the observability of your Windows hosts by configuring features such as Network Performance Monitoring.
If you don’t already have a Datadog account, you can sign up for a free 14-day trial today.


