Many developers and product teams are iterating faster and deploying more frequently to meet user expectations for responsive and optimized apps. These constant deployments—which can number in the dozens or even hundreds per day for larger organizations—are essential for keeping your customer base engaged and delighted. However, they also make it harder to pinpoint the exact deployment that led to a rise in errors, a new error, or a performance regression in your app.
Datadog already offers Deployment Tracking in APM to help you find faulty backend deployments. With RUM Deployment Tracking, you can now easily spot frontend problems as well, bringing full end-to-end visibility to your deployments. RUM Deployment Tracking provides out-of-the-box (OOTB) performance metrics and Powerpacks that enable you to quickly spot issues, assess feature performance by version, and roll back problematic releases. Plus, you can access version comparisons, error messages, and relevant session replays, which aid in troubleshooting problems that stem from updates or new features. In this post, we’ll explain how RUM Deployment Tracking can help you feel confident about deploying your code and ensure that you are releasing safely and reliably.
Pinpoint problematic deployments with performance metrics
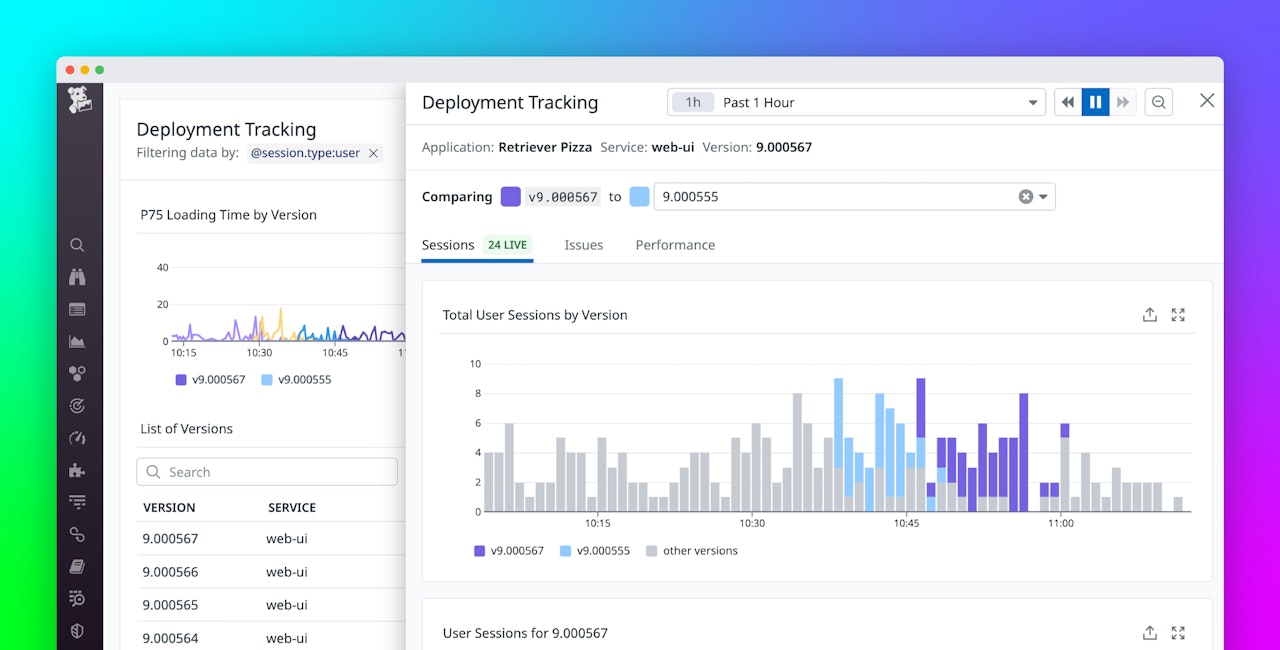
RUM Deployment Tracking collects key data from your recent deployments into a single high-level overview, making it easy to spot versions that introduced issues. From the Application Overview page, you can access OOTB performance metrics and graphs for every deployment within a specified time frame. You’re able to view the loading time and Core Web Vitals for web apps, as well as app launch and crash totals for mobile apps. The page also provides visualizations for error rates and user session counts broken down by version. With these metrics, you can streamline your investigations and immediately begin troubleshooting any problematic deployments.
Let’s say you receive an alert that latency has dramatically increased on your web app. Using RUM Deployment Tracking, you quickly determine that the original spike in latency coincided with a feature release that resulted in longer app loading times. The number of total user sessions also dropped shortly after the release, which indicates a degraded user experience. With this information, you decide to roll back the deployment to limit user impact while you start working on a fix.
Investigate deployment issues by using version comparisons
When you need to investigate the cause of a deployment issue—or ensure that a recent deployment isn’t the cause of an issue—you can access additional context on the version comparison page. By clicking the version you want to investigate and selecting the version you’d like to compare it against, you can view detailed, color-coded visualizations that highlight any performance differences between the two. This helps you compare the performance of new deployments against existing live code, enabling you to verify that the new code is functioning as expected and that no additional errors have surfaced between versions. The version comparison page also comes with links to relevant session replays and error messages so you can investigate further when you spot an issue.
This information enables you to effectively determine the root cause of deployment problems. For example, let’s say you’re investigating an increase in errors in your web app. By looking at the deployment details for the app in RUM, you see that the spike in errors is tied to the latest deployment. To investigate deeper, you decide to compare this version to the previous one. You view the Issues tab on the version comparison panel to access a summary of issues for the two versions and from here, you notice that a new Error Tracking issue was introduced with the most recent deployment. You then view the related error messages from this tab, as well as recent session replays from the Sessions tab, and identify that users are having trouble adding items to their carts—an action that was updated in the latest release. You can pivot to Error Tracking for additional troubleshooting, and then work with the relevant team to find a solution.
Use Powerpacks to monitor deployments via dashboards
RUM Deployment Tracking also comes with Powerpacks that help you easily create dashboards for monitoring recent deployments. The Powerpack includes visualizations for crucial health metrics, such as slow renders, frozen frames, and Core Web Vitals. You can access these metrics in sortable lists broken down by service and view, with each entry tagged with a version number for fast troubleshooting.
After a deployment goes live, you can use the RUM Deployment Tracking Powerpacks to monitor for and investigate issues. For example, let’s say you recently released an update to your app’s checkout flow. Because this change could have a sizable business impact, you want to closely monitor this deployment’s performance. You decide to set up a deployment tracking dashboard using the Powerpack, which populates with data from the checkout deployment as soon as it goes live. Additionally, you can add your own metrics and graphs to help you ensure that the deployment is performing as expected and quickly troubleshoot any anomalies. For example, you might add widgets for key SLOs, such as app uptime, to create a more comprehensive picture of business impact.
Start monitoring frontend deployments today
RUM Deployment Tracking gathers the most important frontend signals for your deployments and releases into a unified view, so you can monitor the health of recent launches, identify deployment-related performance issues, and pinpoint root causes fast. Our OOTB metrics allow you to streamline deployment troubleshooting, and you can leverage Powerpacks to easily create custom dashboards for monitoring key releases.
To get started with RUM Deployment Tracking, you can use our documentation. Or, if you’re not yet a customer, you can sign up for a 14-day free trial today.


