Aanand Ramachandran

Cat Yao

Angelina Jin
Organizations are becoming increasingly reliant on cloud-native technologies. The shift to cloud has led to data centers becoming hybrid, with applications distributed across cloud and on-premises environments. Due to this, connectivity between applications has to traverse multiple networks, including virtual networks in the cloud, and the wide area network (WAN) segment connecting on-prem network devices.
Teams today use separate tools to monitor each of these network segments and must manually correlate data from all these tools to troubleshoot problems, leading to silos and blindspots that significantly increase the time to uncover the root causes of issues. Additionally, users are unable to link an application’s performance degradation to a network bottleneck, which increases the time taken to resolve the problem and restore the application.
To help solve these challenges, Datadog Network Path and SD-WAN monitoring provide views into your network across on-premises and cloud environments for faster troubleshooting and remediation. Network Path monitoring allows you to visualize the path taken by network traffic between applications, view both end-to-end and hop-by-hop latency, and see end-to-end packet loss. SD-WAN monitoring lets you monitor your Cisco SD-WAN deployment that connects on-premises data centers to the cloud. You can correlate the network path and your physical network by pivoting to a view of the SD-WAN edge router and other network devices in Network Device Monitoring (NDM) for deeper monitoring.
In this post, we will walk you through how Datadog’s end-to-end network monitoring enables your teams to:
- View the path taken by application traffic through different network segments
- Pivot to NDM devices to troubleshoot physical network problems
- Get in-depth monitoring of your Cisco SD-WAN deployment in NDM
View the path taken by application traffic through different network segments
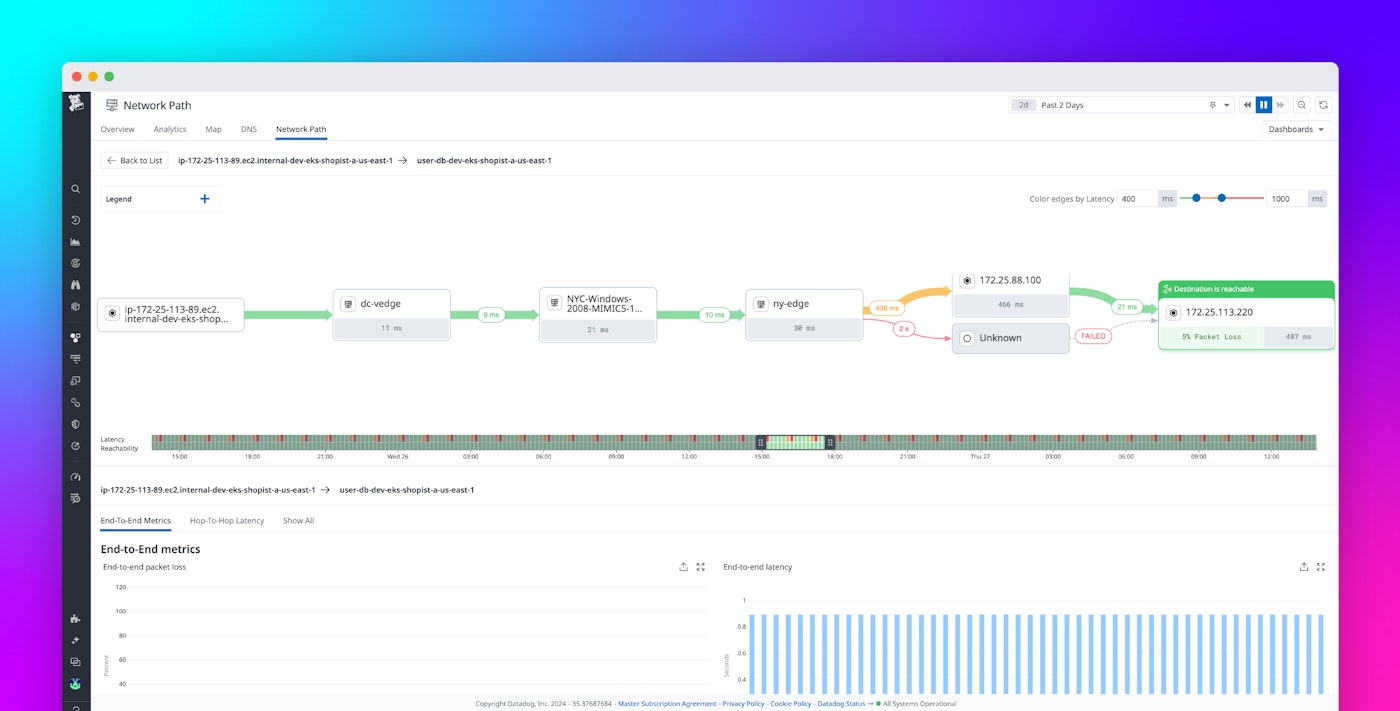
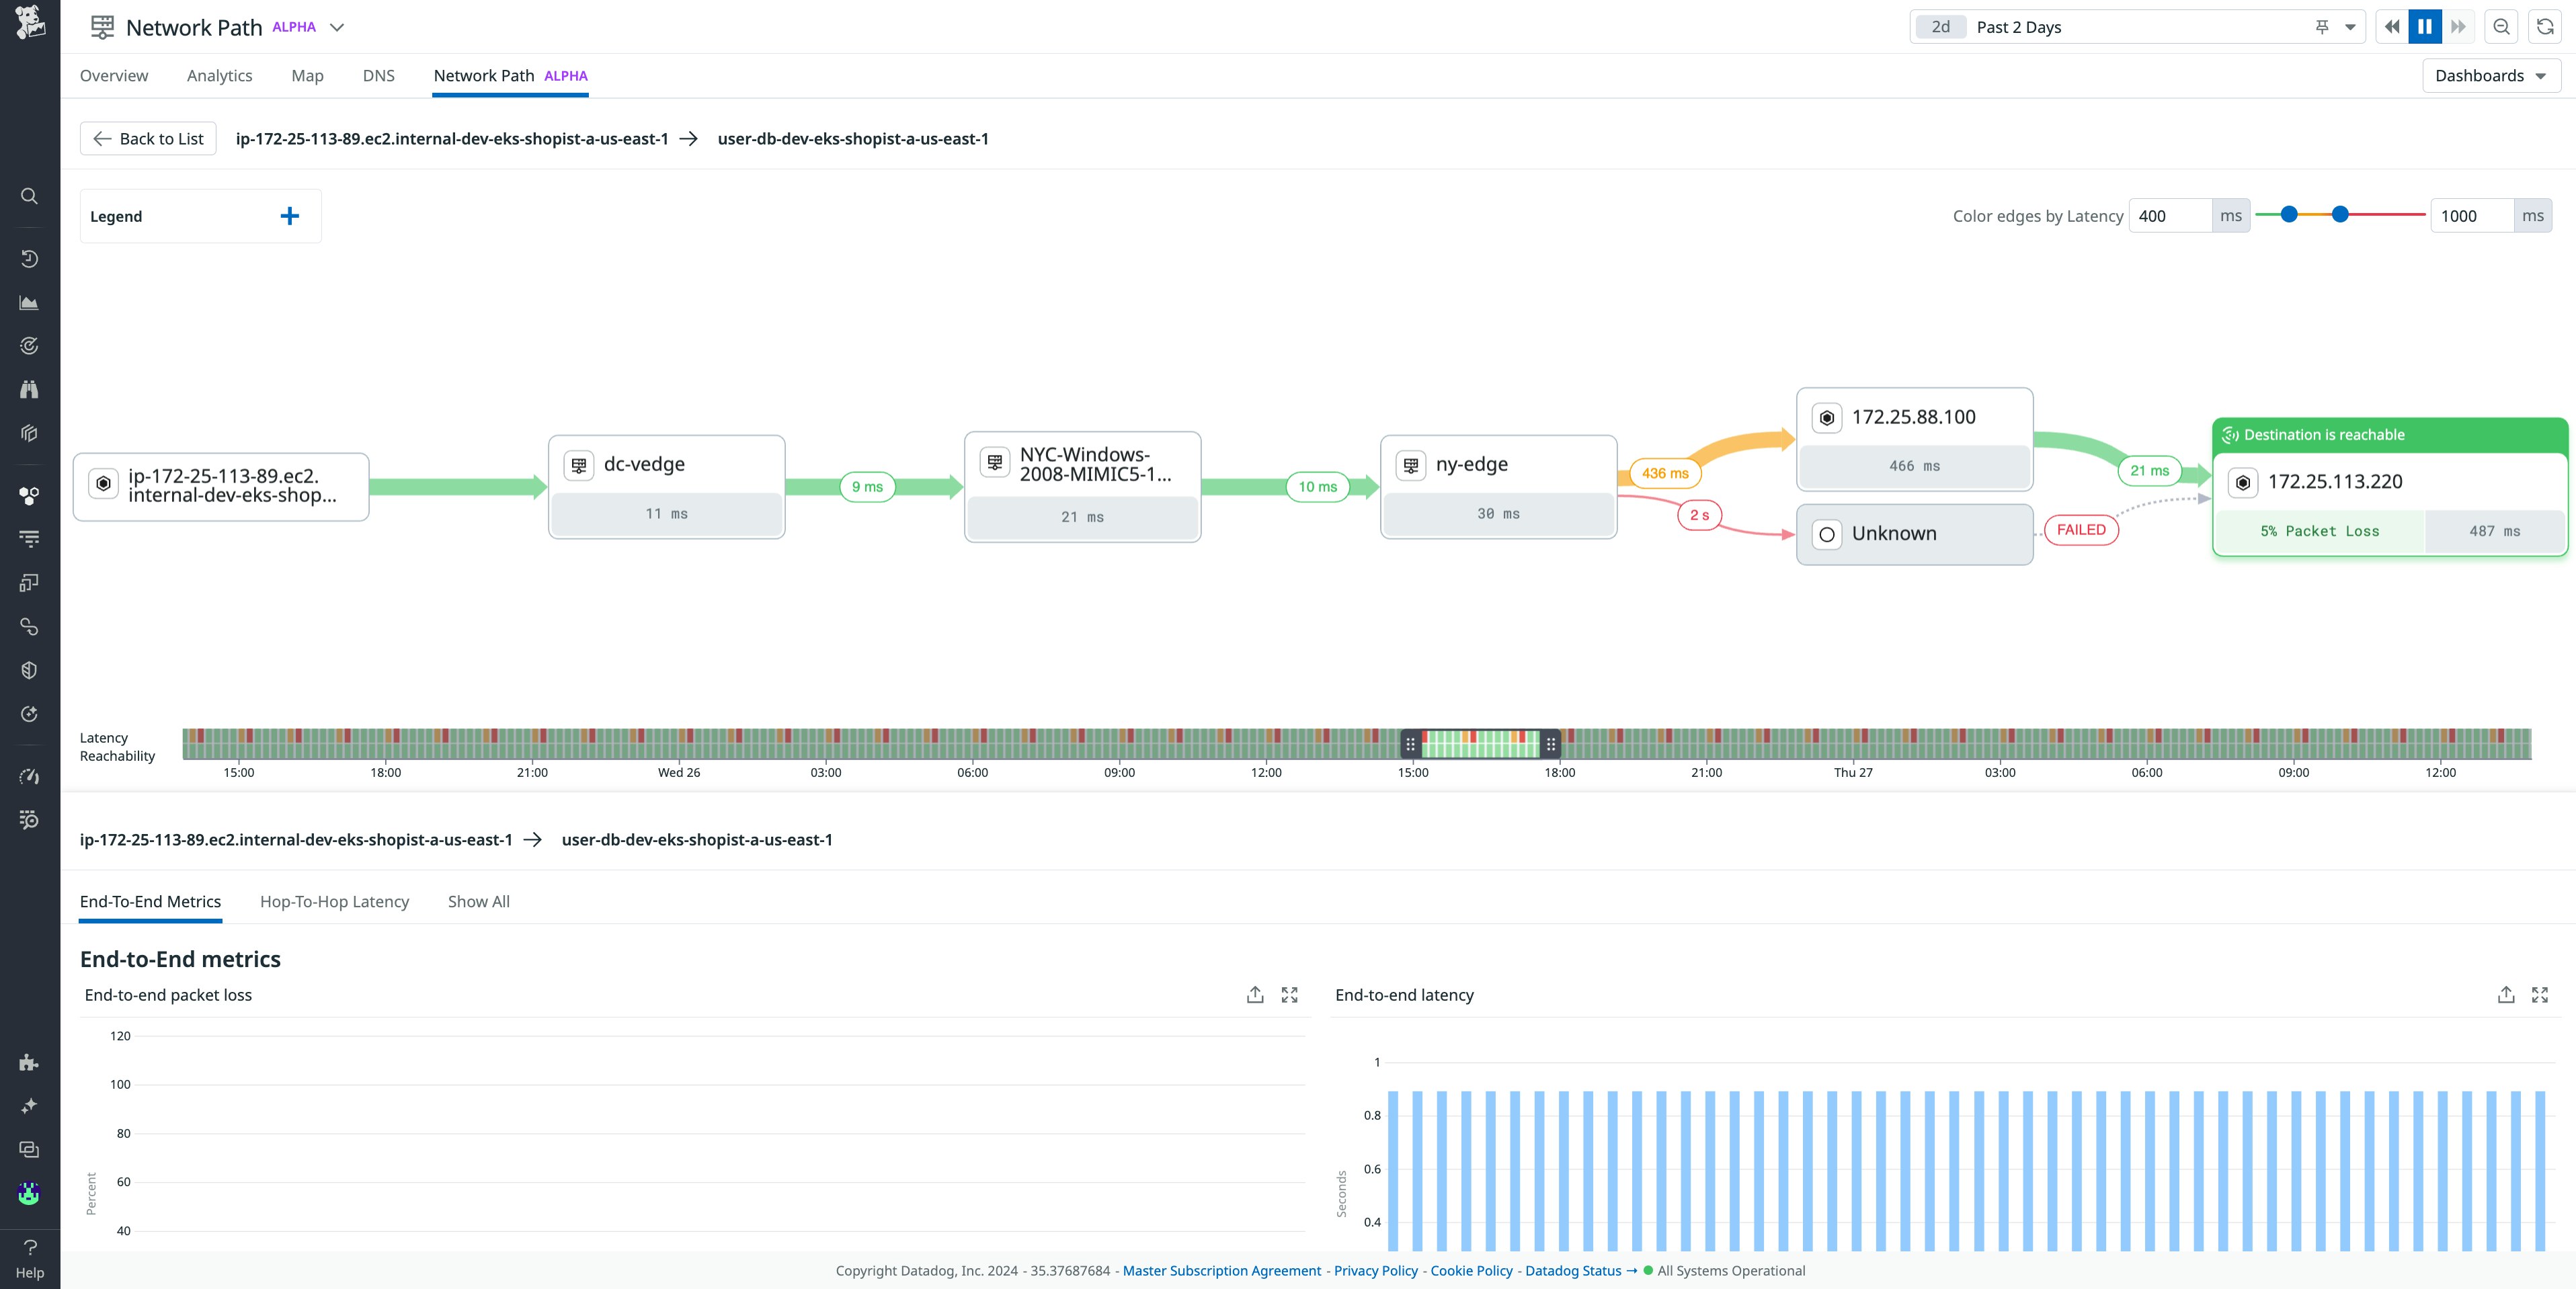
Cloud Network Monitoring (CNM) provides insight into what services, hosts, or availability zones are communicating with each other, as well as the volume and latency of the traffic between them. And now, with the Network Path view in CNM, you can also visualize the individual hops taken to get from one endpoint to another.
Network Path monitoring enables you to:
- See the intermediate traffic hops between the source and destination to identify potential network misrouting
- Pinpoint the root cause of network problems by visualizing end-to-end network path latency and packet loss
- Go back in time and see hop-by-hop latency over time to narrow down the scope of incidents
- Easily pivot from CNM Analytics to Network Path to see what lies between two endpoints in CNM
This visibility can be useful when troubleshooting network issues such as increased latency at an application level. Network Path can also tell you the breakdown of latency at each hop in the path, and thus allows you to easily narrow down where the issue could be originating from. By automatically detecting where traffic is being sent throughout the network, Network Path makes it much faster to go from detecting a network issue to root causing the origin of the problem in the network.
Pivot to NDM devices to troubleshoot physical network problems
Network Device Monitoring (NDM) brings visibility into the status of your physical network devices and collects NetFlow information for more insights into your on-premises traffic flows. However, it’s difficult to know which devices are actually traversed by traffic in your network. The Network Path view helps close this gap by showing you which devices in on-premises networks were traversed by application traffic and allowing you to click on them so you can quickly pivot into NDM to investigate the devices further.
Device visibility within the Network Path view enables you to:
- See network devices as nodes in the path traversed by traffic along with the name and IP of the device
- Determine what devices could be the cause of slowdowns in your network
- Pivot from the Network Path view to the device’s side panel in NDM to dig deeper into metrics, traps, and flows associated with the device
Together, Network Path and NDM provide full visibility into which devices your traffic traversed and the status of those devices, making it much faster to troubleshoot your physical network issues.
Get in-depth monitoring of your Cisco SD-WAN deployment
Software-defined wide area network (SD-WAN) is a programming-driven approach to centrally control and manage the WAN and connect branch, enterprise, and cloud locations. This is an increasingly popular architecture for organizations because SD-WANs are more cost-effective, flexible, and scalable than traditional WANs. Monitoring SD-WAN is crucial for getting a complete view of how your network performs in hybrid scenarios.
With Datadog’s Cisco SD-WAN monitoring your network teams now have:
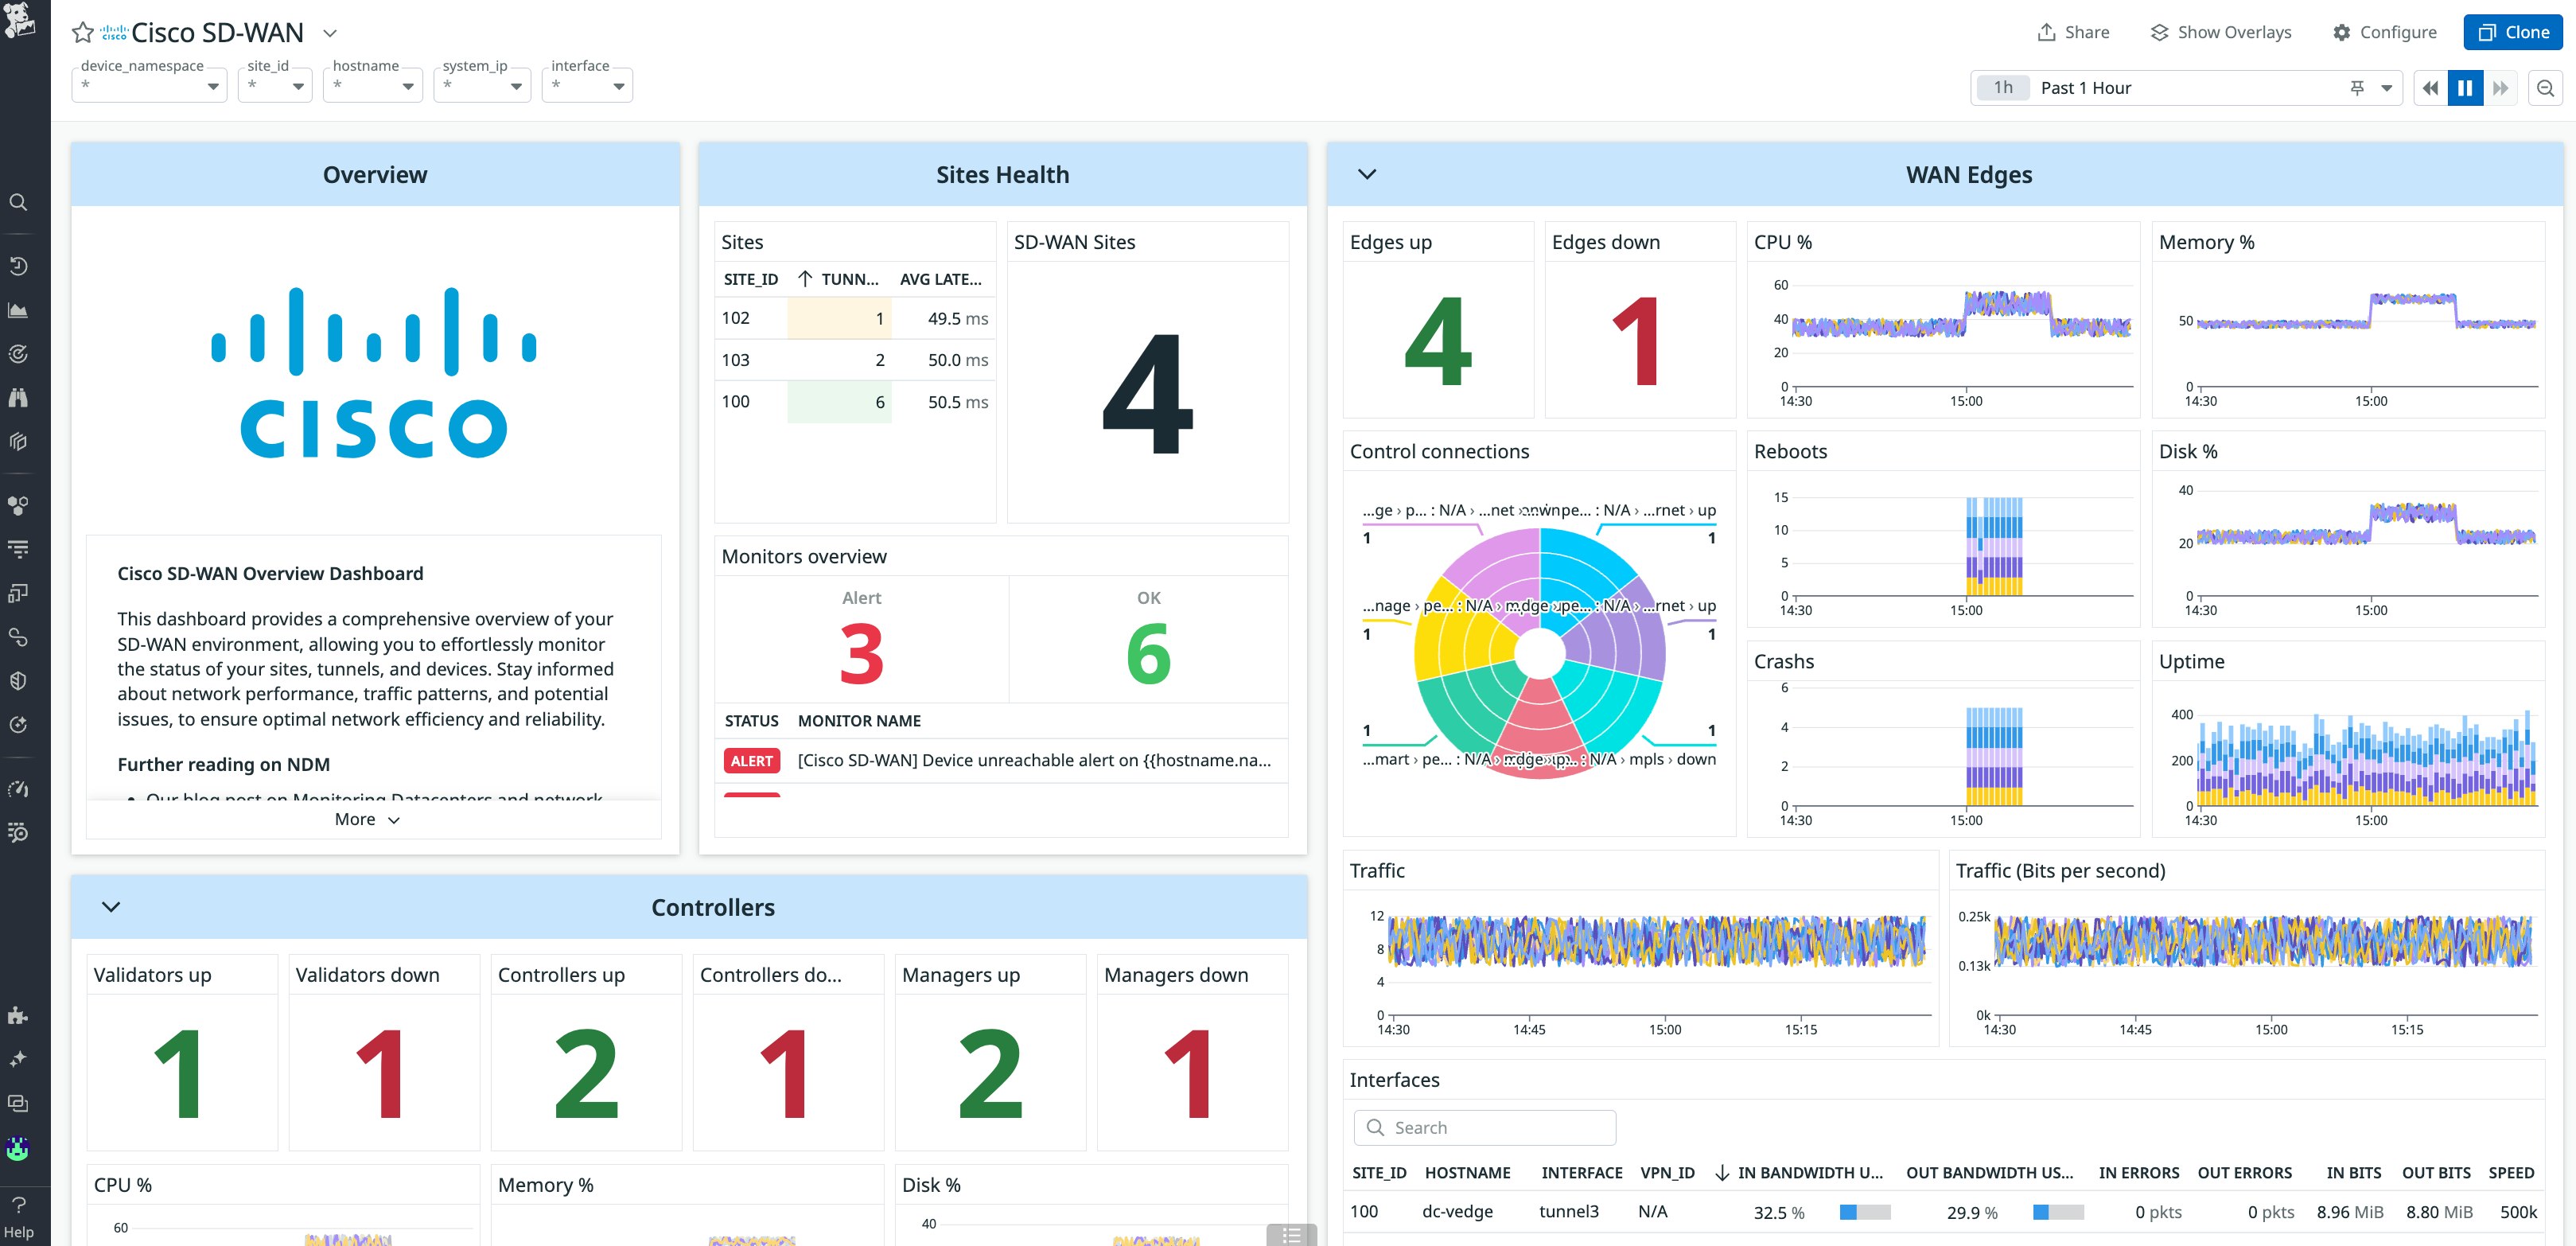
- Visibility into your SD-WAN control plane and data plane so you can quickly diagnose issues related to edge device performance, like number of reboots and crashes, and CPU, memory, and disk usage over time
- Visibility into the health of SD-WAN tunnels by latency, jitter, and packet loss to streamline operational efficiency and reduce operating costs of the SD-WAN infrastructure
- A view into the SD-WAN link in the network path between two applications so you can monitor the latency and packet loss through it
Datadog’s support for monitoring Cisco SD-WAN means you can stay on top of the changing monitoring needs of your network teams as you move from MPLS and traditional WANs to SD-WAN during your cloud migration journey.
Get started with Network Path and SD-WAN monitoring today
Datadog provides single-pane, end-to-end monitoring of your network spanning cloud, WAN, and on-premises environments for faster troubleshooting of network issues behind slowdowns. Network Path monitoring allows you to view the hop-by-hop path taken by traffic between applications and monitor end-to-end and per-hop latency as well as end-to-end traffic loss. The hop can be to an on-premises device, an SD-WAN link, or a network service in the cloud. From the network path you can also directly link to Cisco SD-WAN monitoring in NDM for deeper troubleshooting of WAN issues.
To learn more, check out our Network Path monitoring documentation and our SD-WAN monitoring documentation. And if you don’t already have a Datadog account, you can sign up for a 14-day free trial to get started.
