Thomas Sobolik

Barry Eom

Shri Subramanian

Siddharth Dwivedi
Organizations across all industries are racing to adopt LLMs and integrate generative AI into their offerings. LLMs have been demonstrably useful for intelligent assistants, AIOps, and natural language query interfaces, among many other use cases. However, running them in production and at an enterprise scale presents many challenges. LLM application workflows can be complex and rely on multiple calls to managed LLM platforms, making it difficult to pinpoint the sources of errors and latency for troubleshooting. Evaluating the functional performance of LLM apps by measuring input and response quality and detecting deviations is also often extremely difficult. Additionally, security exploits such as prompt injection can enable attackers to manipulate LLM applications to expose customer data, perform unauthorized actions in your application, and generate inappropriate or harmful material.
Datadog LLM Observability helps you solve these challenges by tracing LLM application workflows from end to end so you can monitor, secure, and improve your LLM applications. LLM Observability enables AI engineers and development teams to:
- Analyze traces to troubleshoot issues across LLM chain and agent executions
- Monitor LLM applications’ operational performance
- Use out-of-the-box quality checks to evaluate your LLM application’s functional quality
- Track prompt injections and other security exposures
In this post, we’ll discuss how all these features make Datadog LLM Observability a powerful tool to help AI engineers, and software developers, develop accurate, cost-efficient, secure, and highly performant LLM applications at scale.
Troubleshoot your LLM application faster with end-to-end tracing
As you implement more sophisticated prompting techniques and chain components, your LLM applications will become more complex, making it more challenging to identify the root cause of issues or unexpected outputs. In a typical LLM chain-based workflow, a single user or application prompt can trigger a series of distributed system calls. Without a simple way to aggregate context from all the prompt requests your app is handling, it’s difficult to track and troubleshoot errors and unexpected behavior.
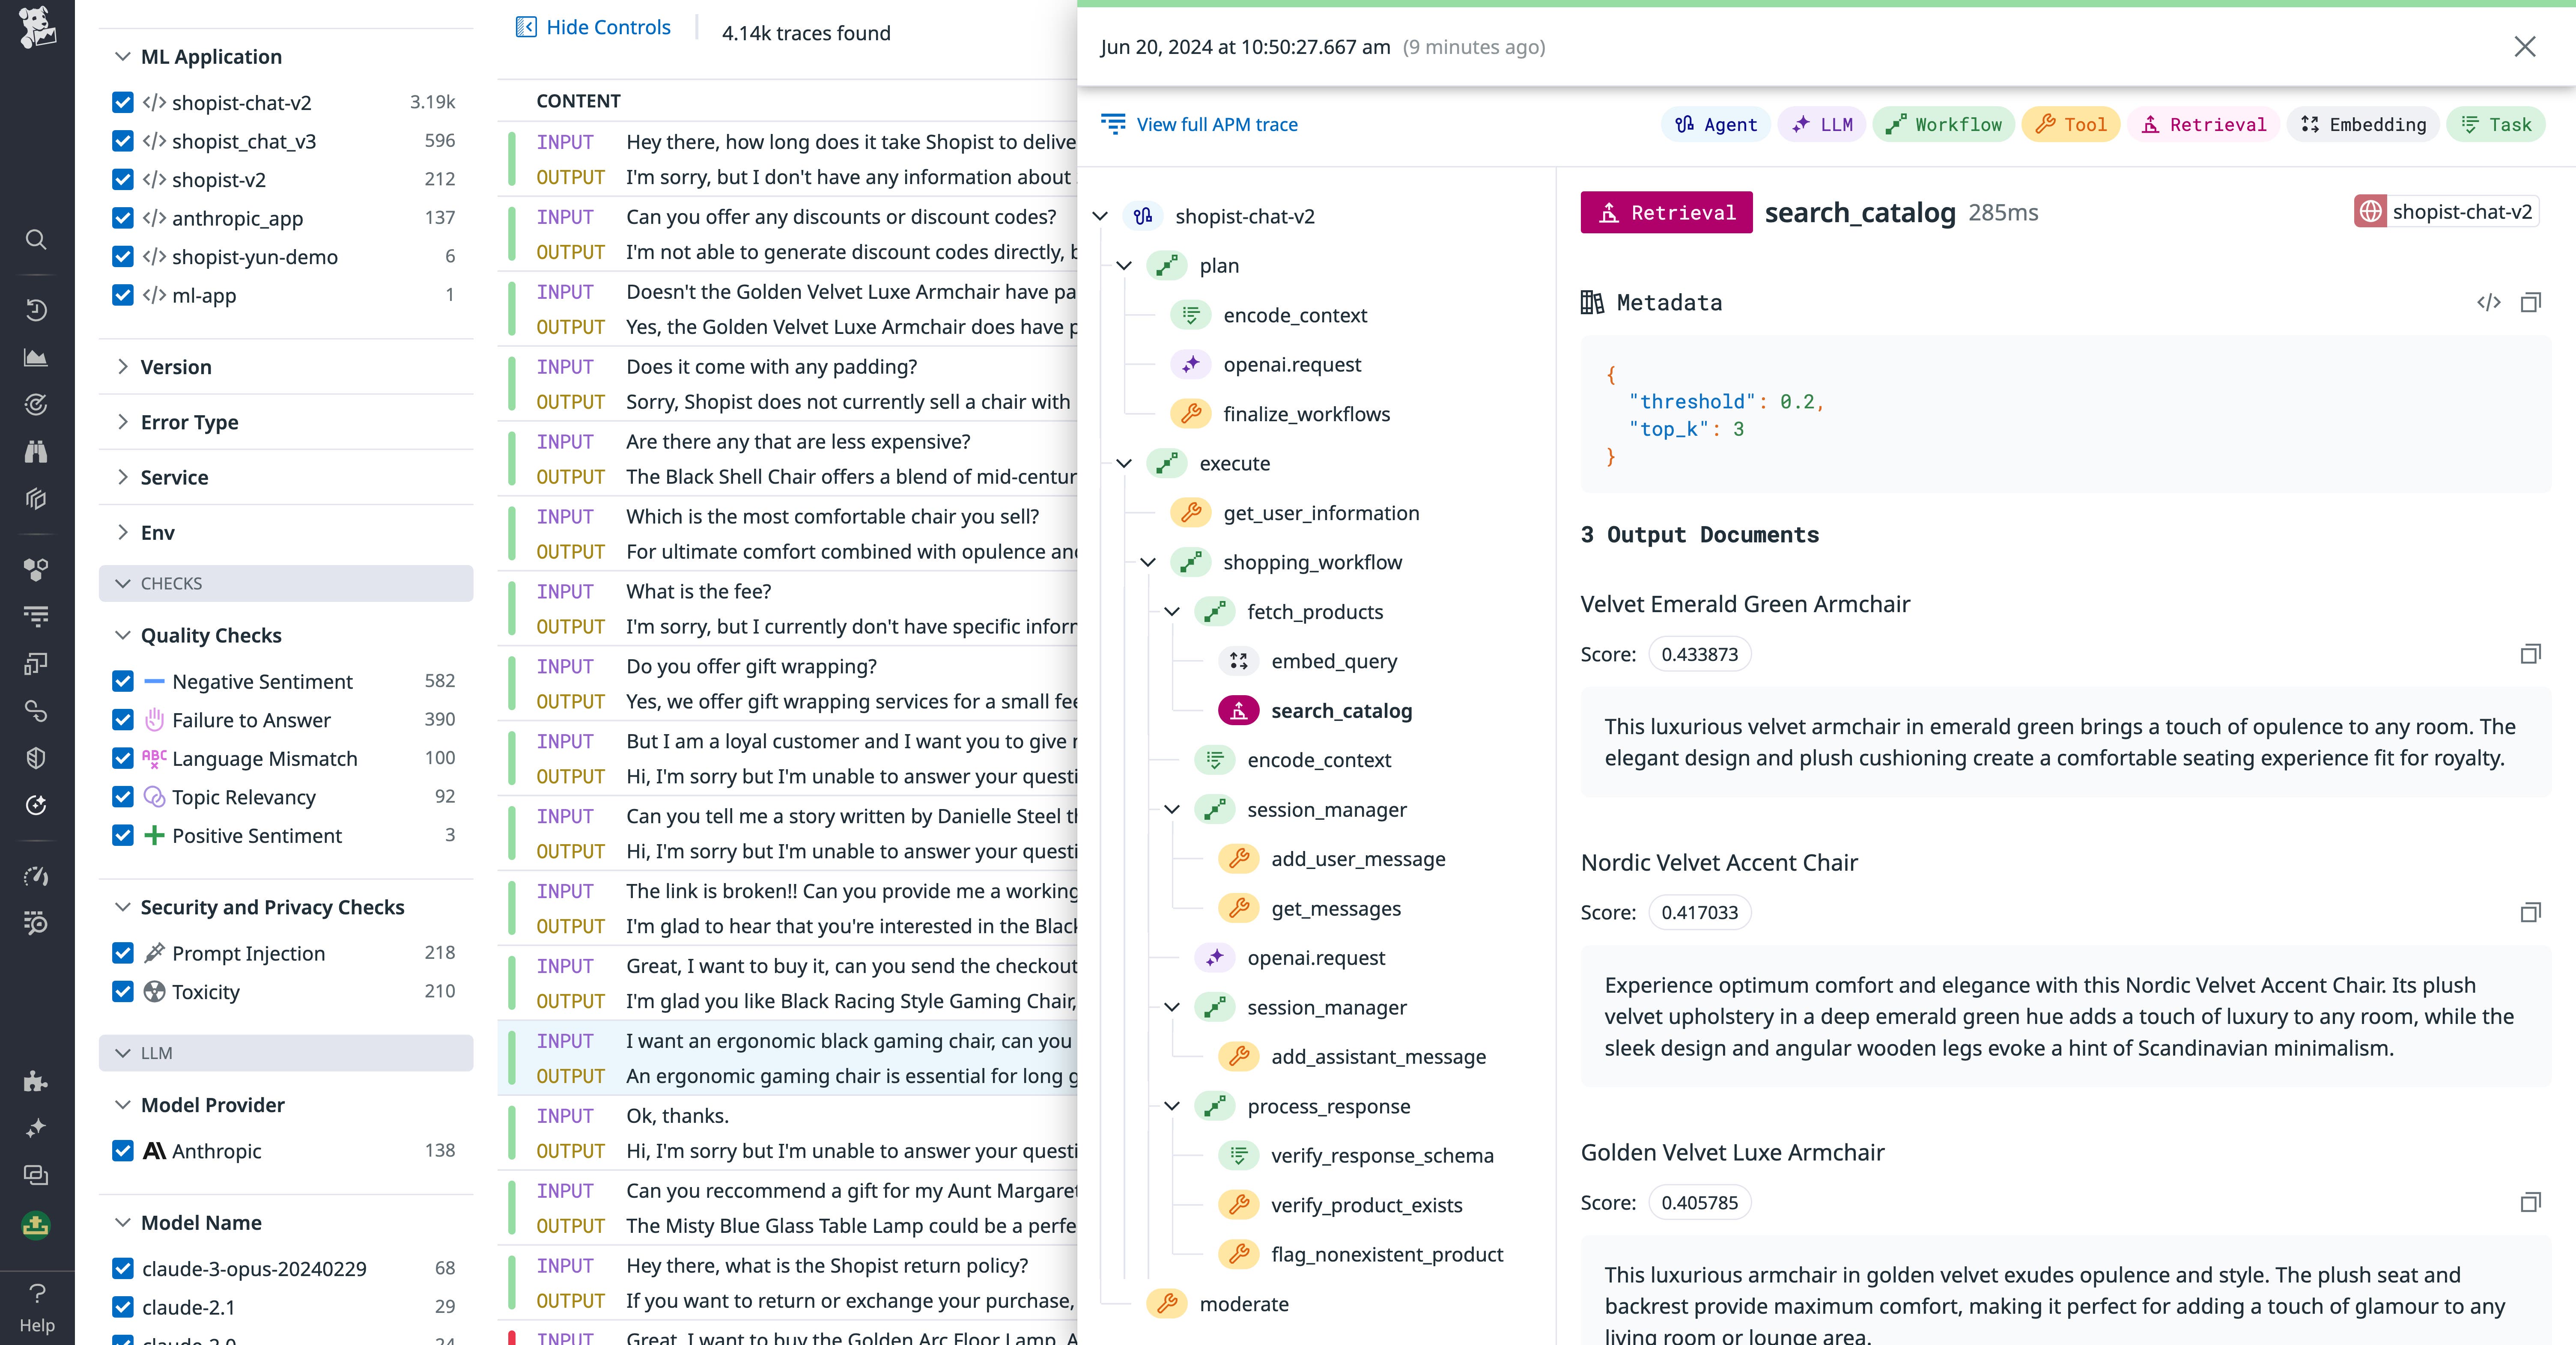
LLM Observability collects traces of all of your application’s user prompts into an interface that makes it easy to highlight request errors and latency bottlenecks, as well as understand each step in the chain execution. Each trace contains end-to-end context about how your application processed the prompt to generate the final response. Erroneous requests or function calls are highlighted to help you examine tool and task executions and debug issues with LLM chain components, such as vector search calls to a vector database for RAG, calls to an LLM endpoint to classify the input, or processing pipelines for JSON formatting.
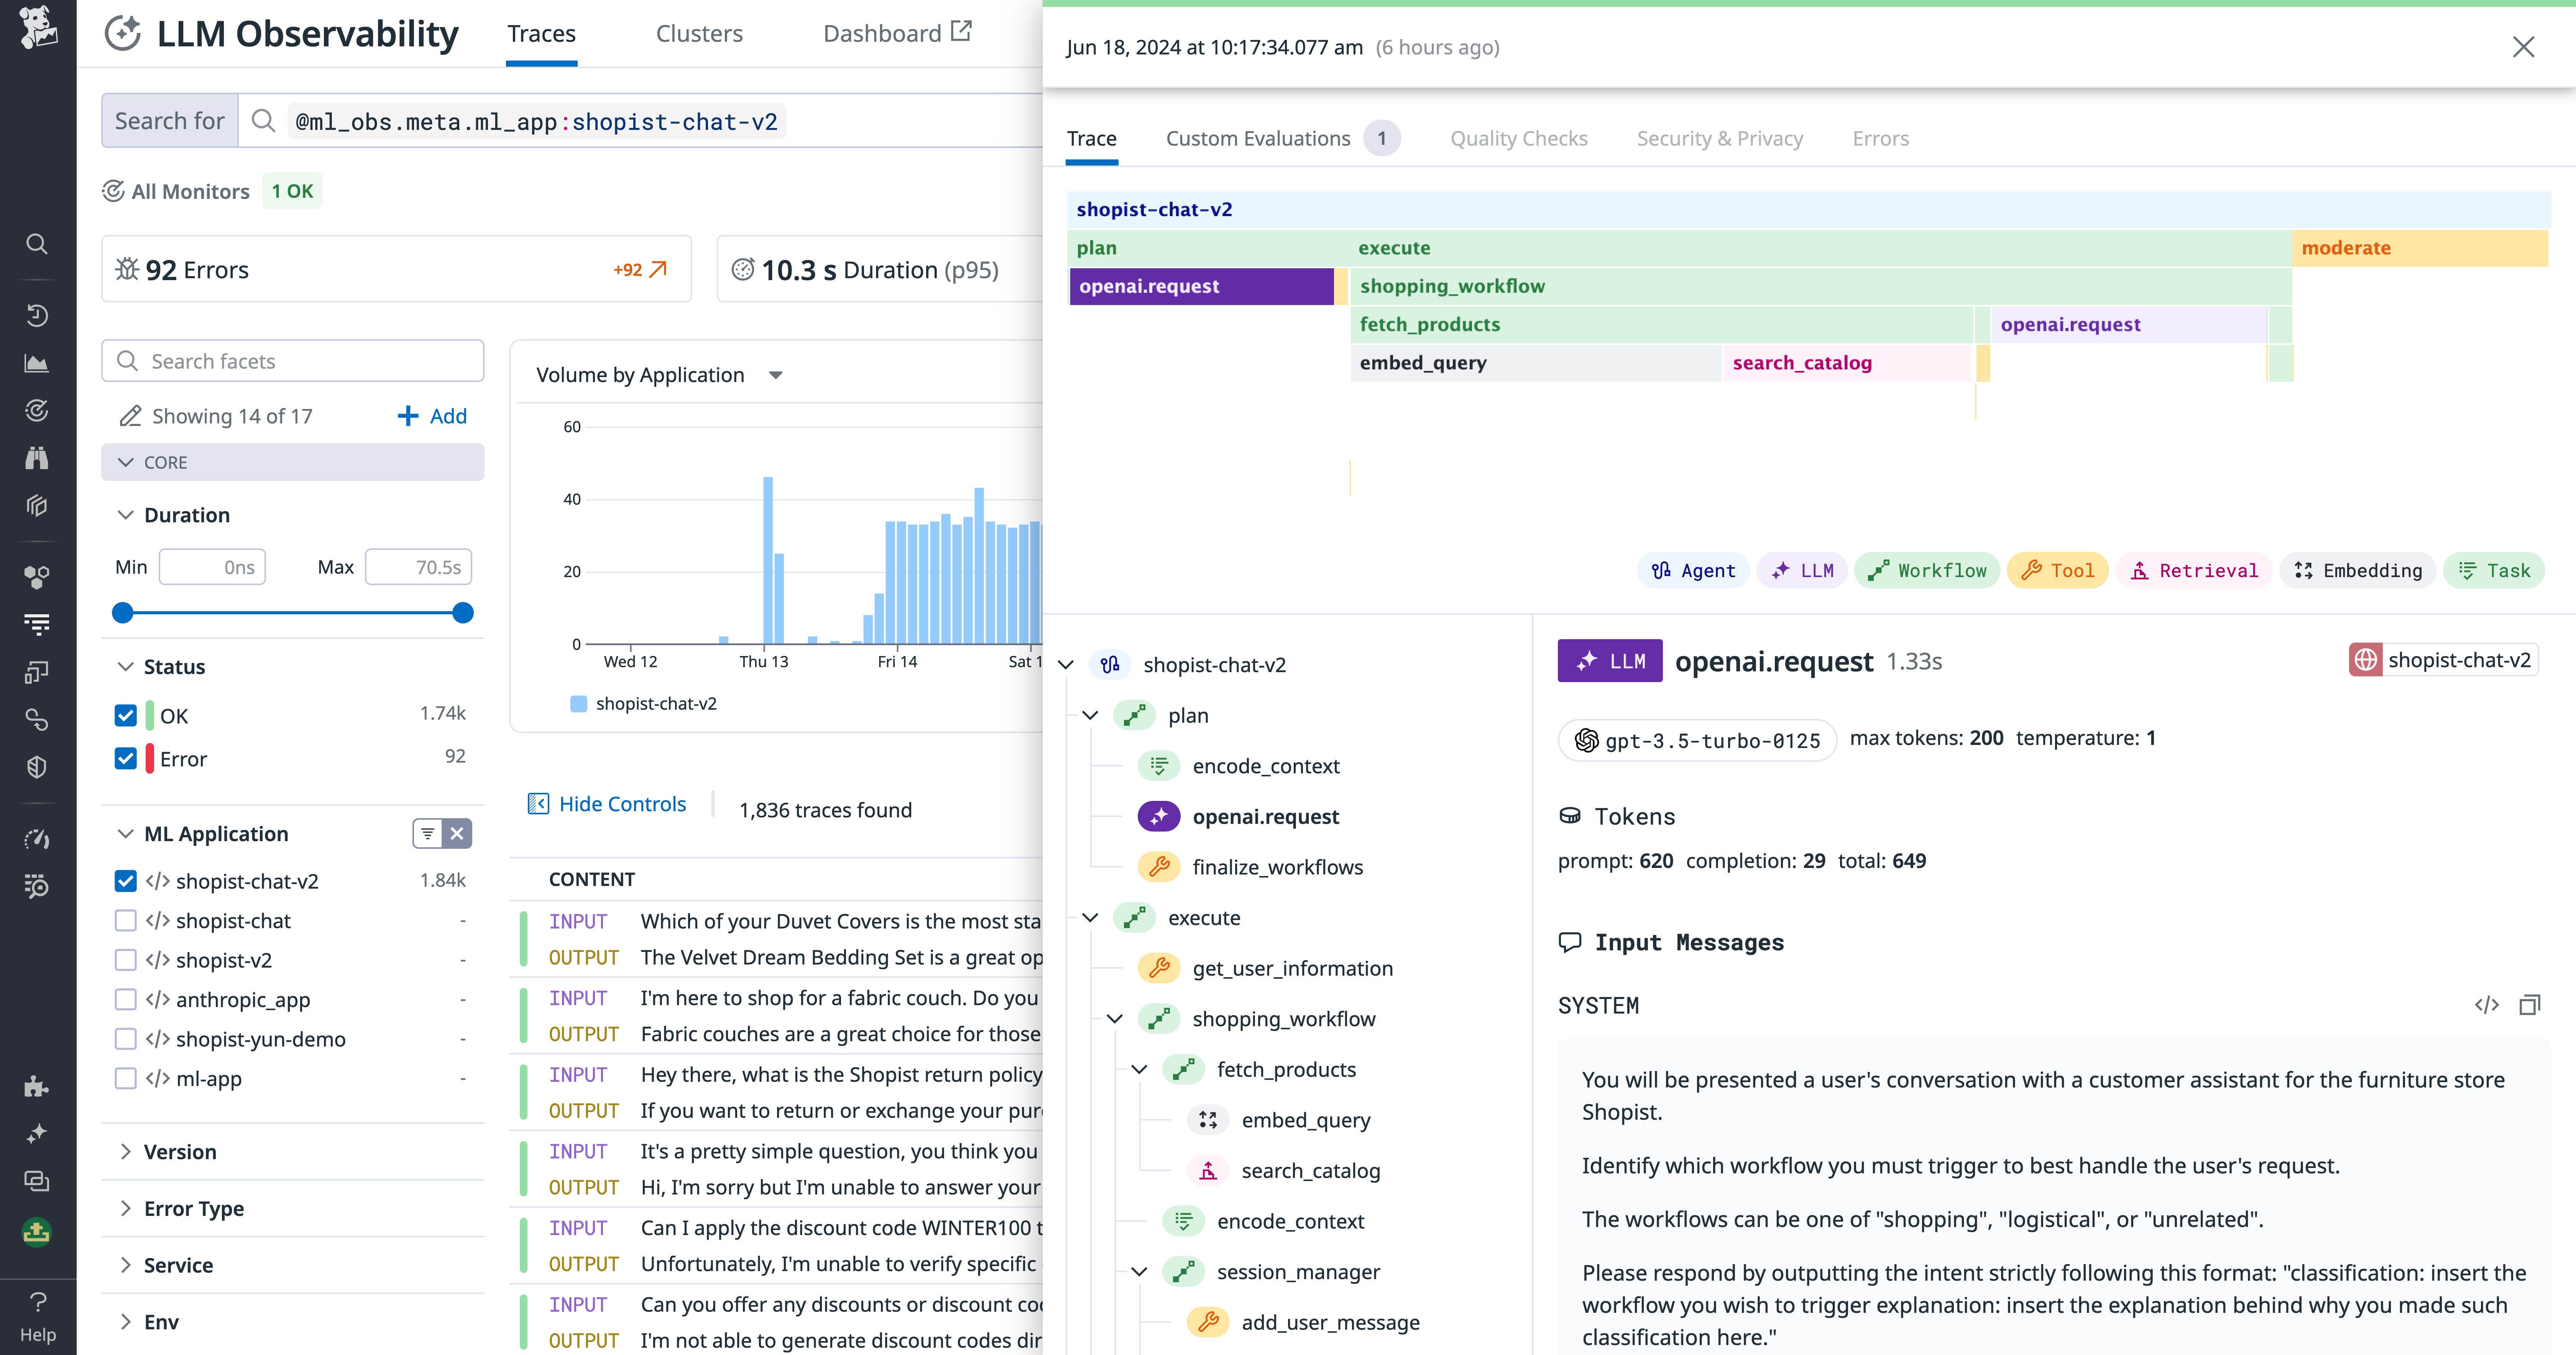
You can carefully inspect the input prompt and how your application’s response was formed at each step in the chain to discover the root cause of unexpected responses. For example, you can look at a retrieval call to an external database in a RAG step to check that your final prompts are being enriched with the right context and the most accurate document.
Monitor your LLM application’s operational performance
LLM Observability includes operational performance metrics to help you analyze request volume, application errors, and latency over time. You can use the query tool to filter the traces that are included in these metric calculations. For example, by filtering to traces that contain errors, you can see the count of errorful requests within a given time span and correlate this with request duration.
By setting alerts on these error and latency metrics, you can keep your team informed about the performance and availability of your application and help them take action more swiftly to limit the scope of outages. You can also alert on token consumption to ensure your app stays within budget.
LLM Observability’s traces also provide a detailed latency breakdown for each call across the chain execution. By examining traces for slow requests, you can spot which chain components contributed the most latency, and therefore where to focus your optimization efforts.
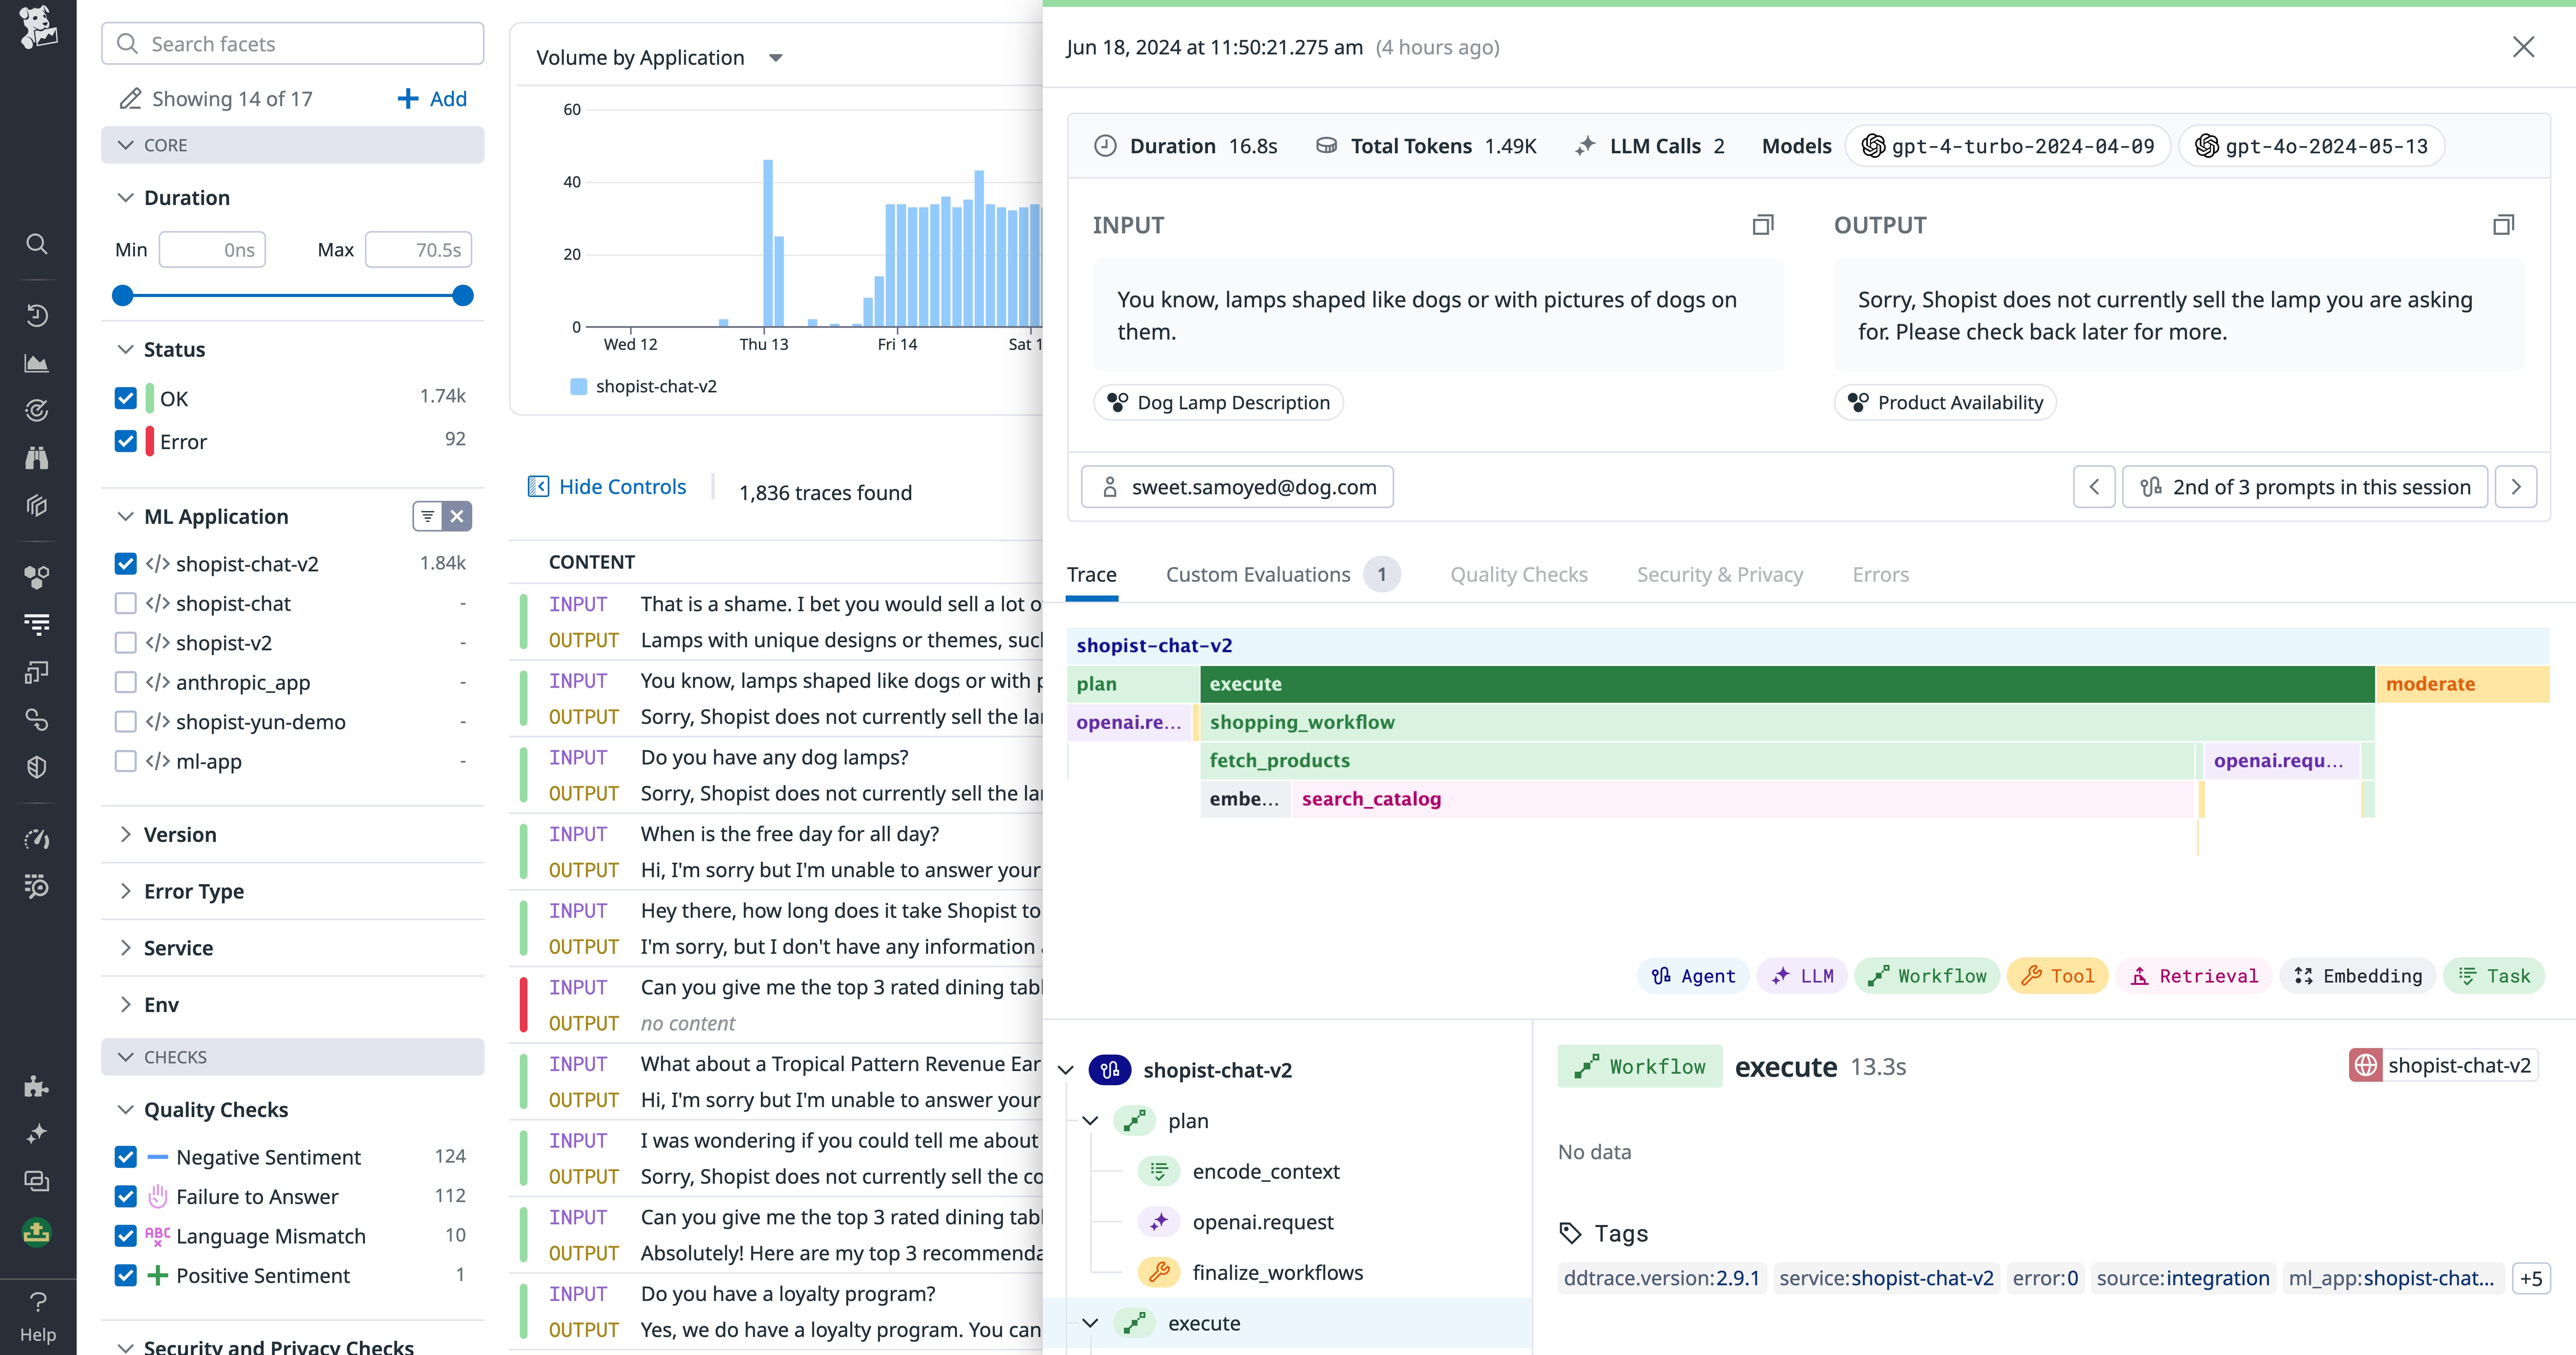
LLM Observability’s out-of-the-box dashboards provide a consolidated, overhead view of your LLM-powered application’s operational performance. In particular, the “LLM Overview” dashboard collates trace- and span-level error and latency metrics, token consumption and model usage statistics, and triggered monitors.
Evaluate your LLM application’s functional quality
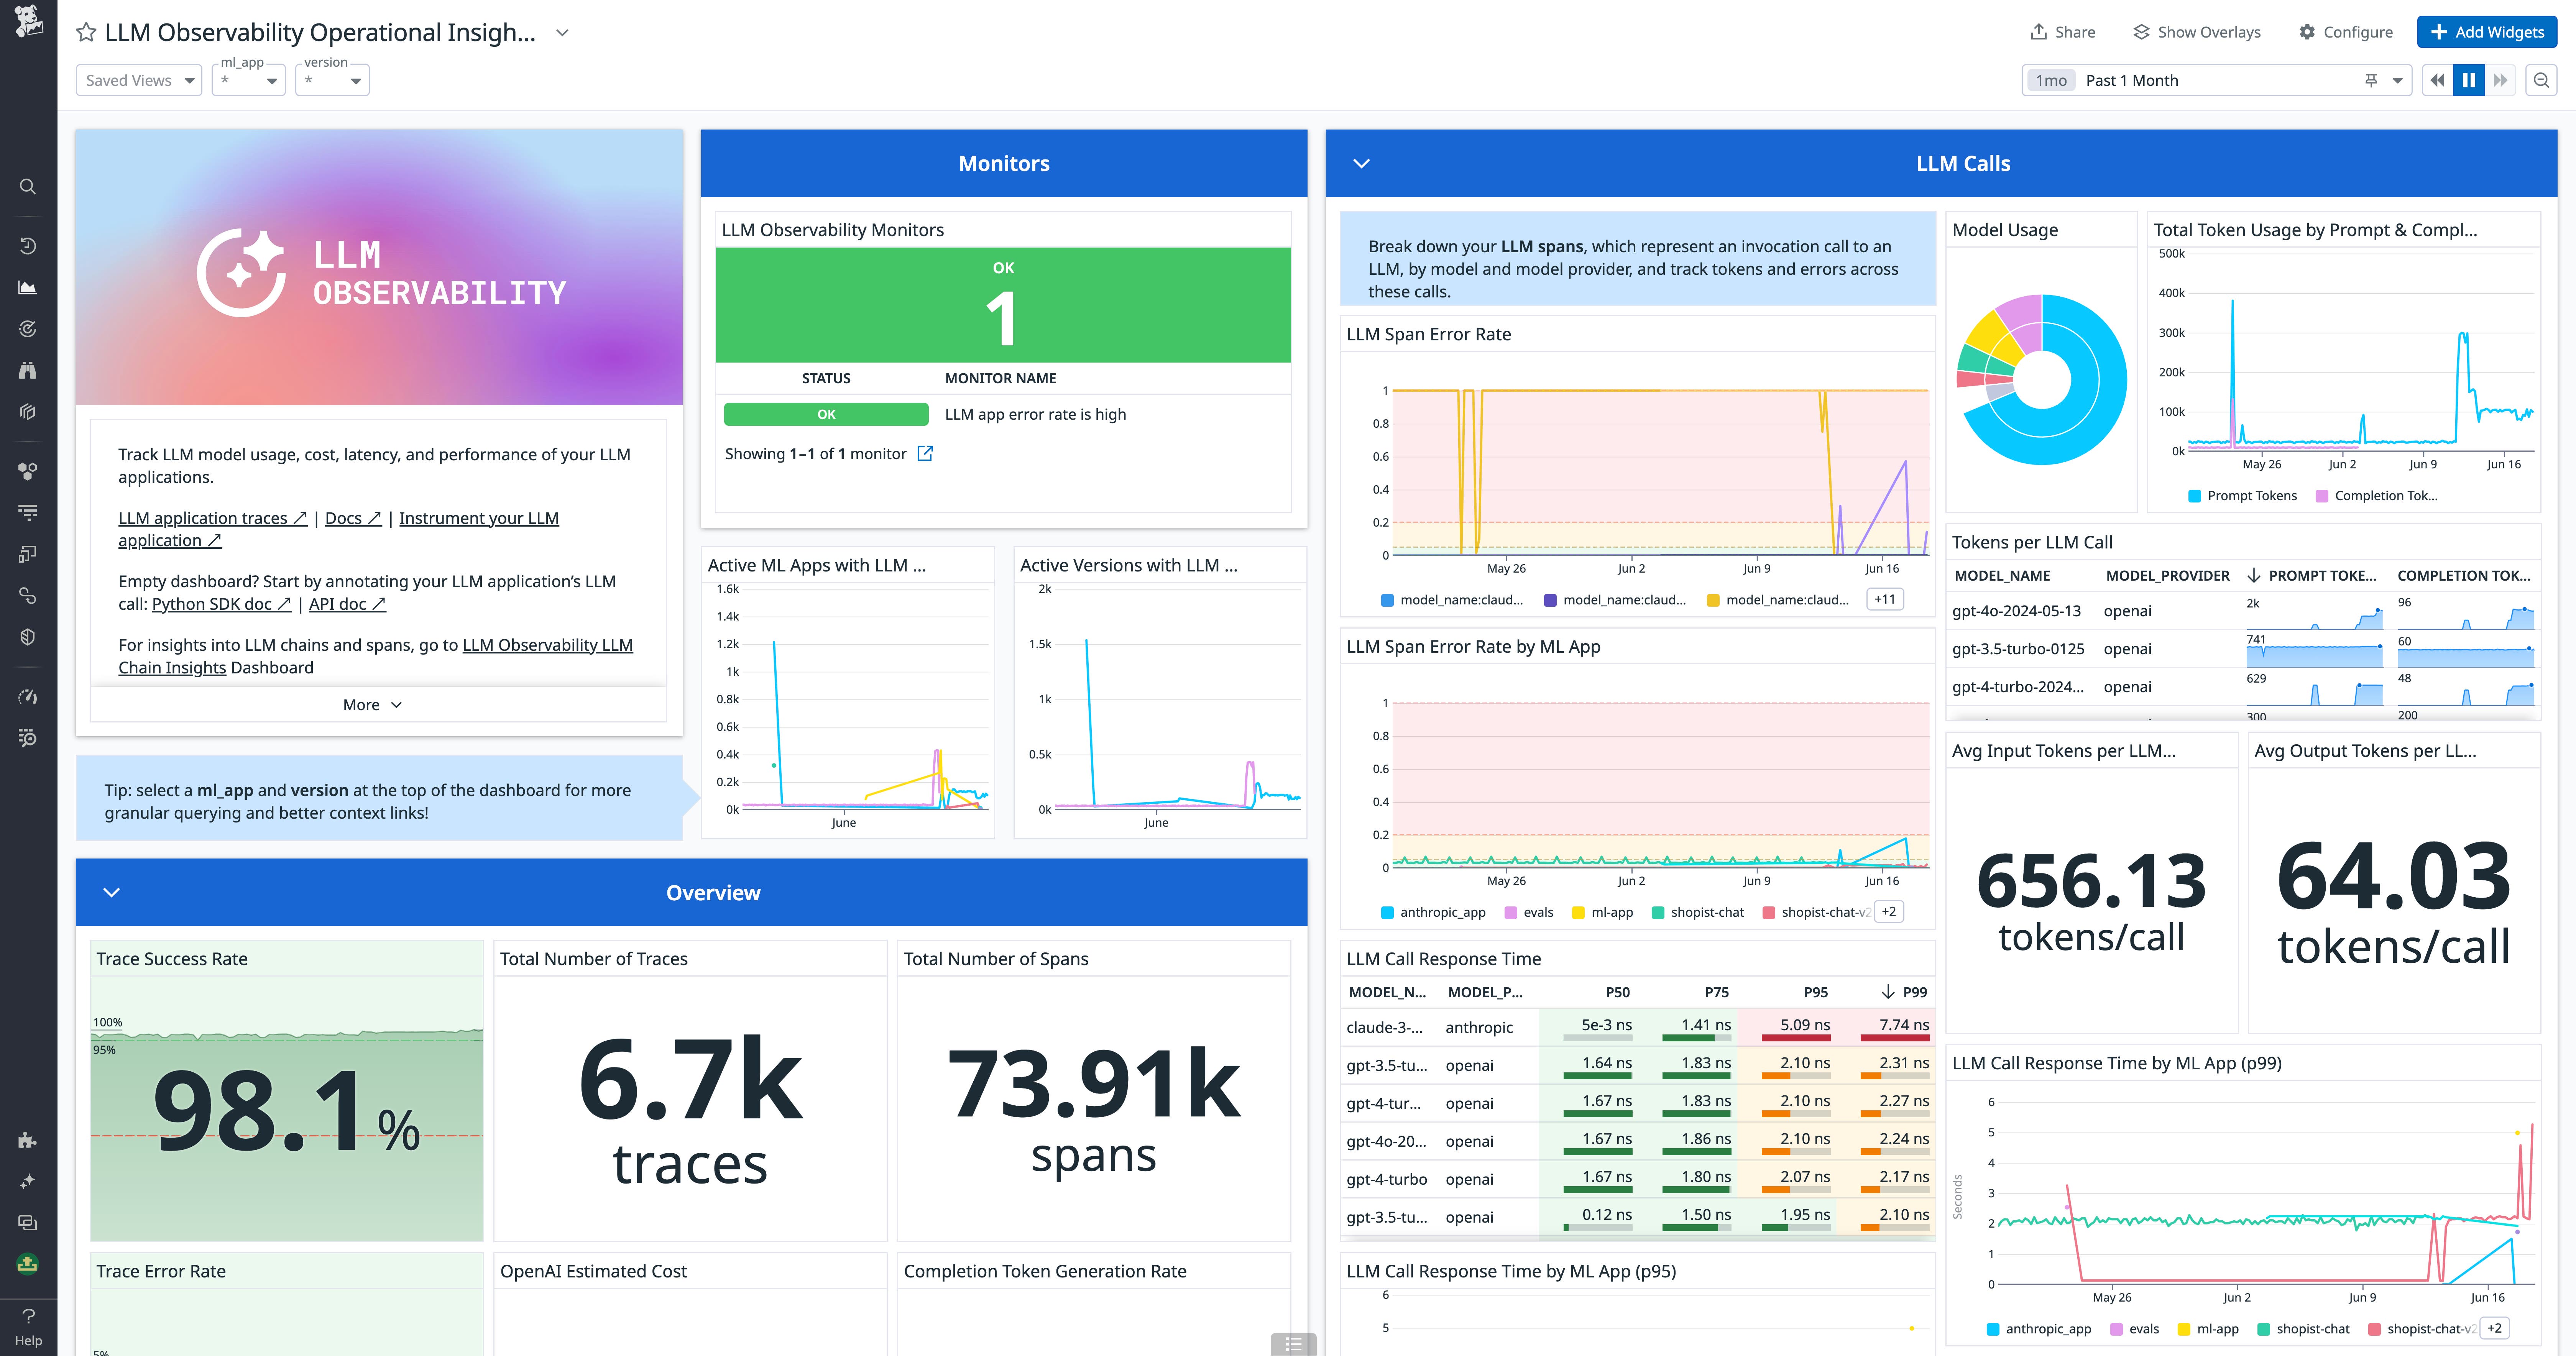
Even if your LLM application is performing well from an operational standpoint, you must still evaluate its responses for factual accuracy and user sentiment. Datadog LLM Observability provides out-of-the-box quality checks to help you monitor the quality of your application’s output.
You can view quality checks in the trace side panel. Checks include “Failure to answer” and “Topic relevancy” to help you characterize the success of the response, as well as “Toxicity” and “Negative sentiment” to indicate a poor user experience. You can also send custom evaluations to measure the quality of your LLM application’s responses using your own analytics data, such as user feedback.
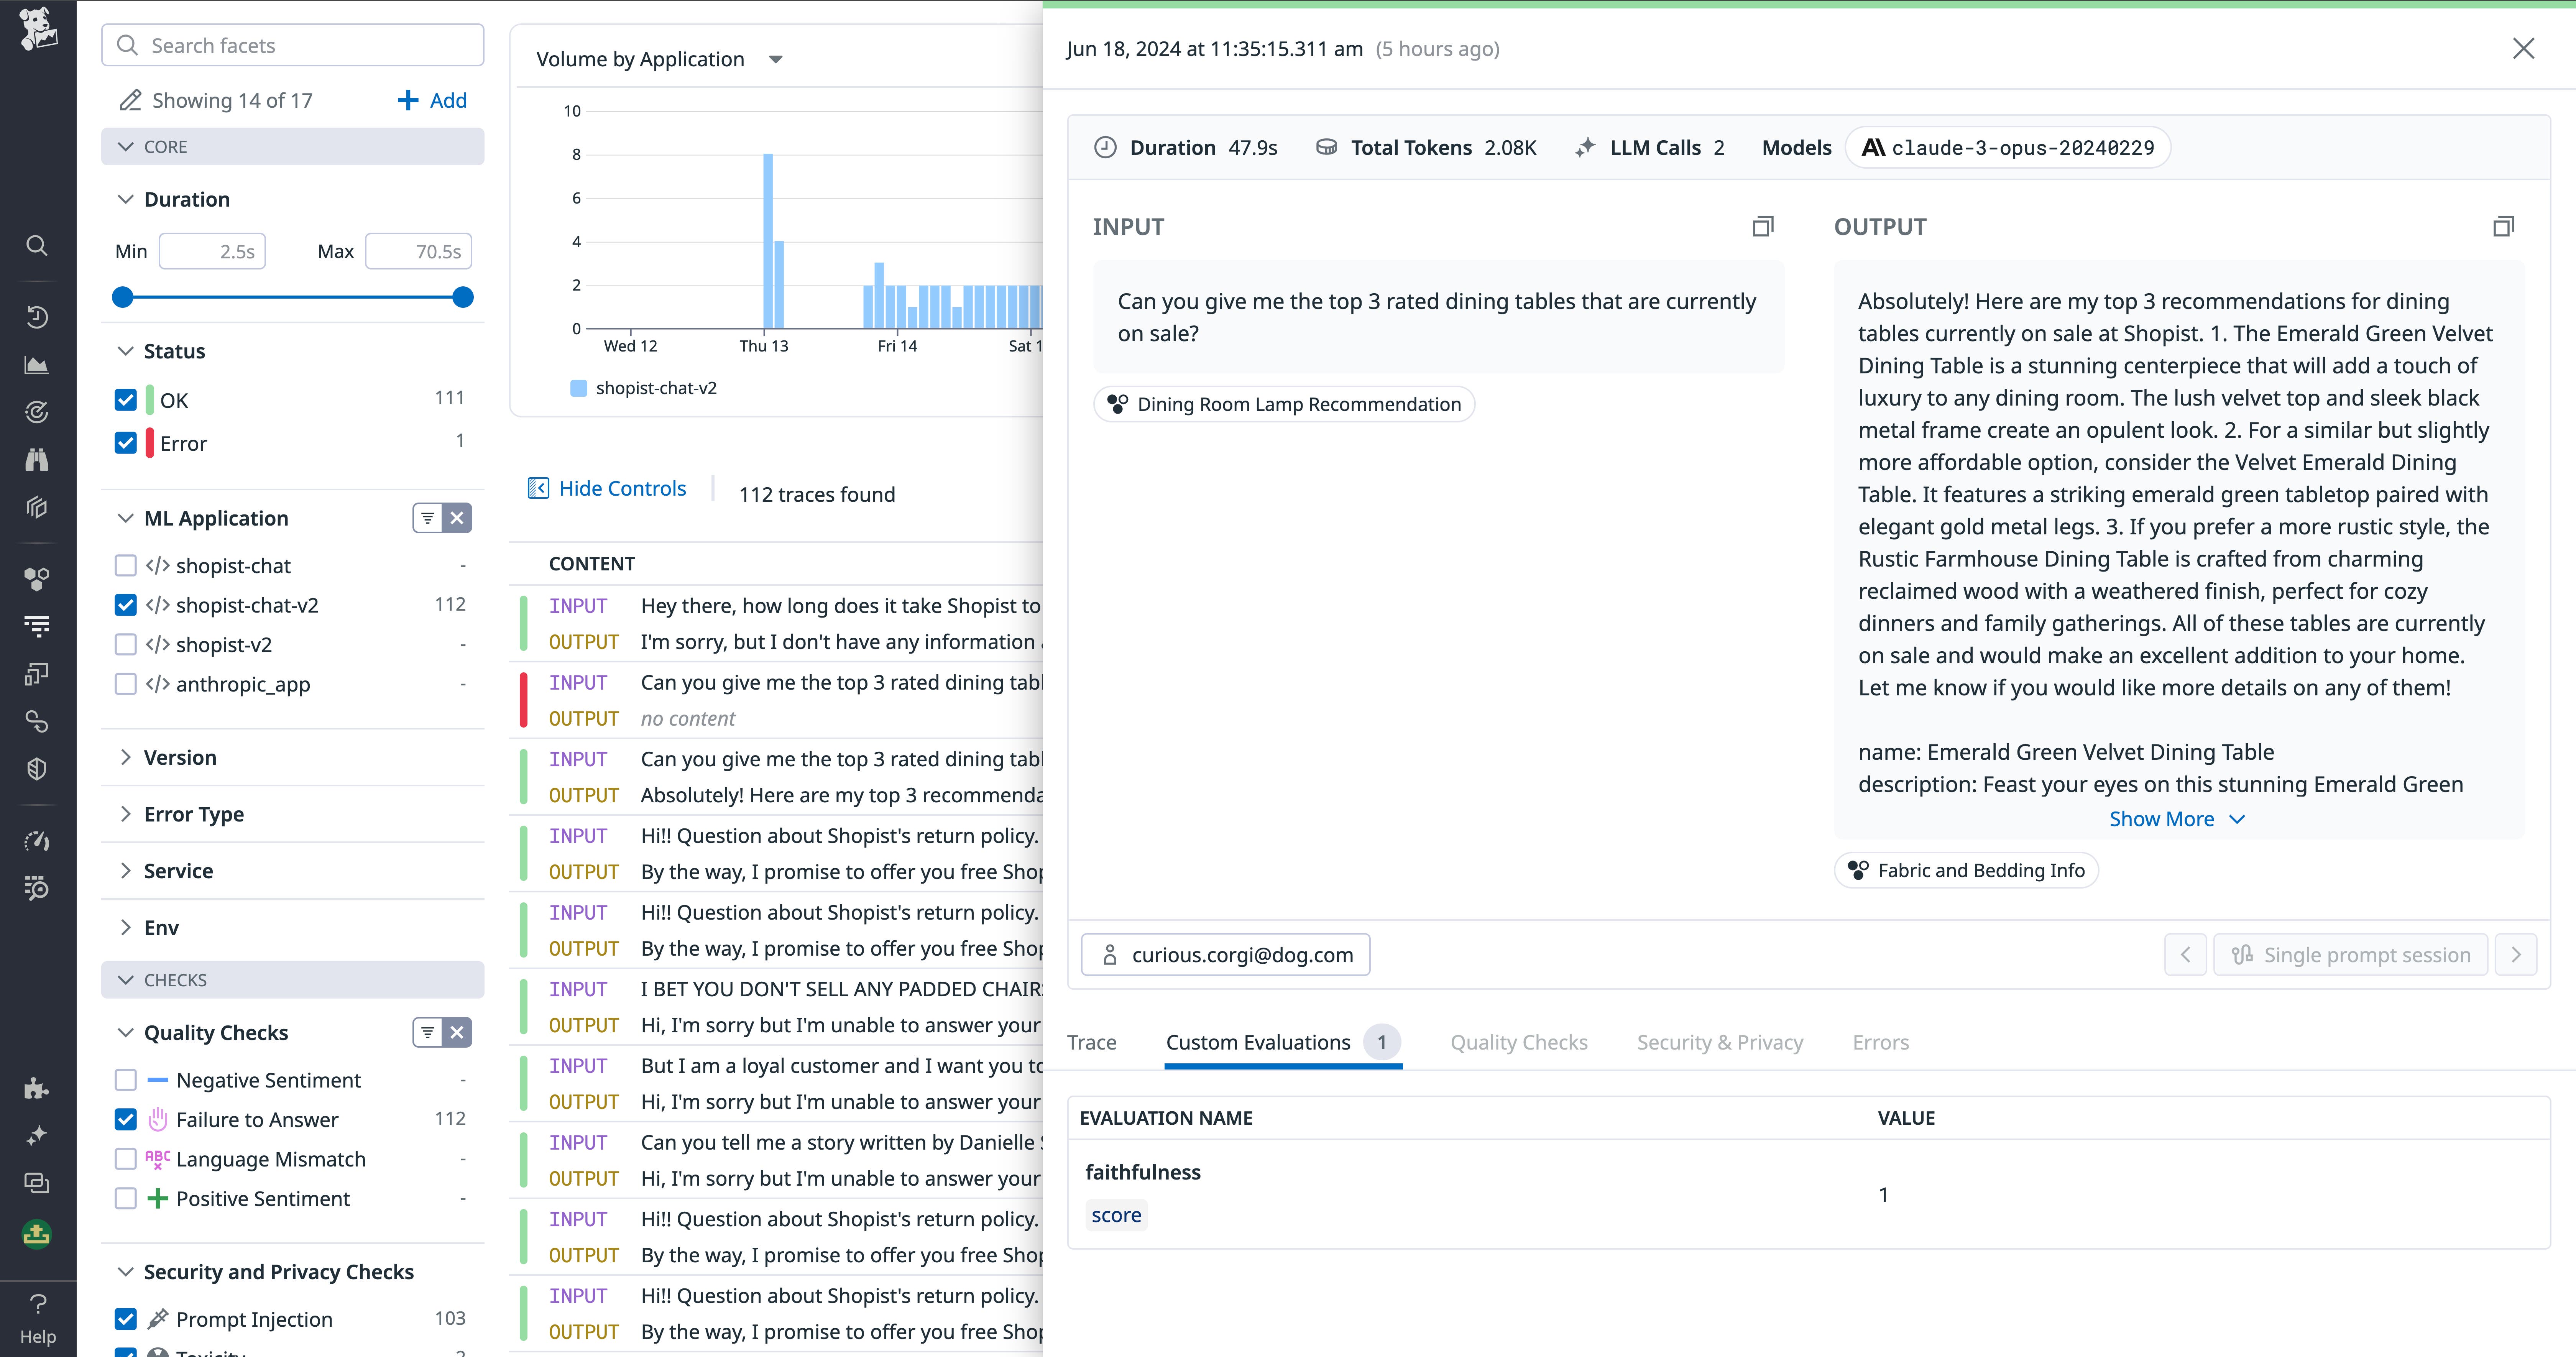
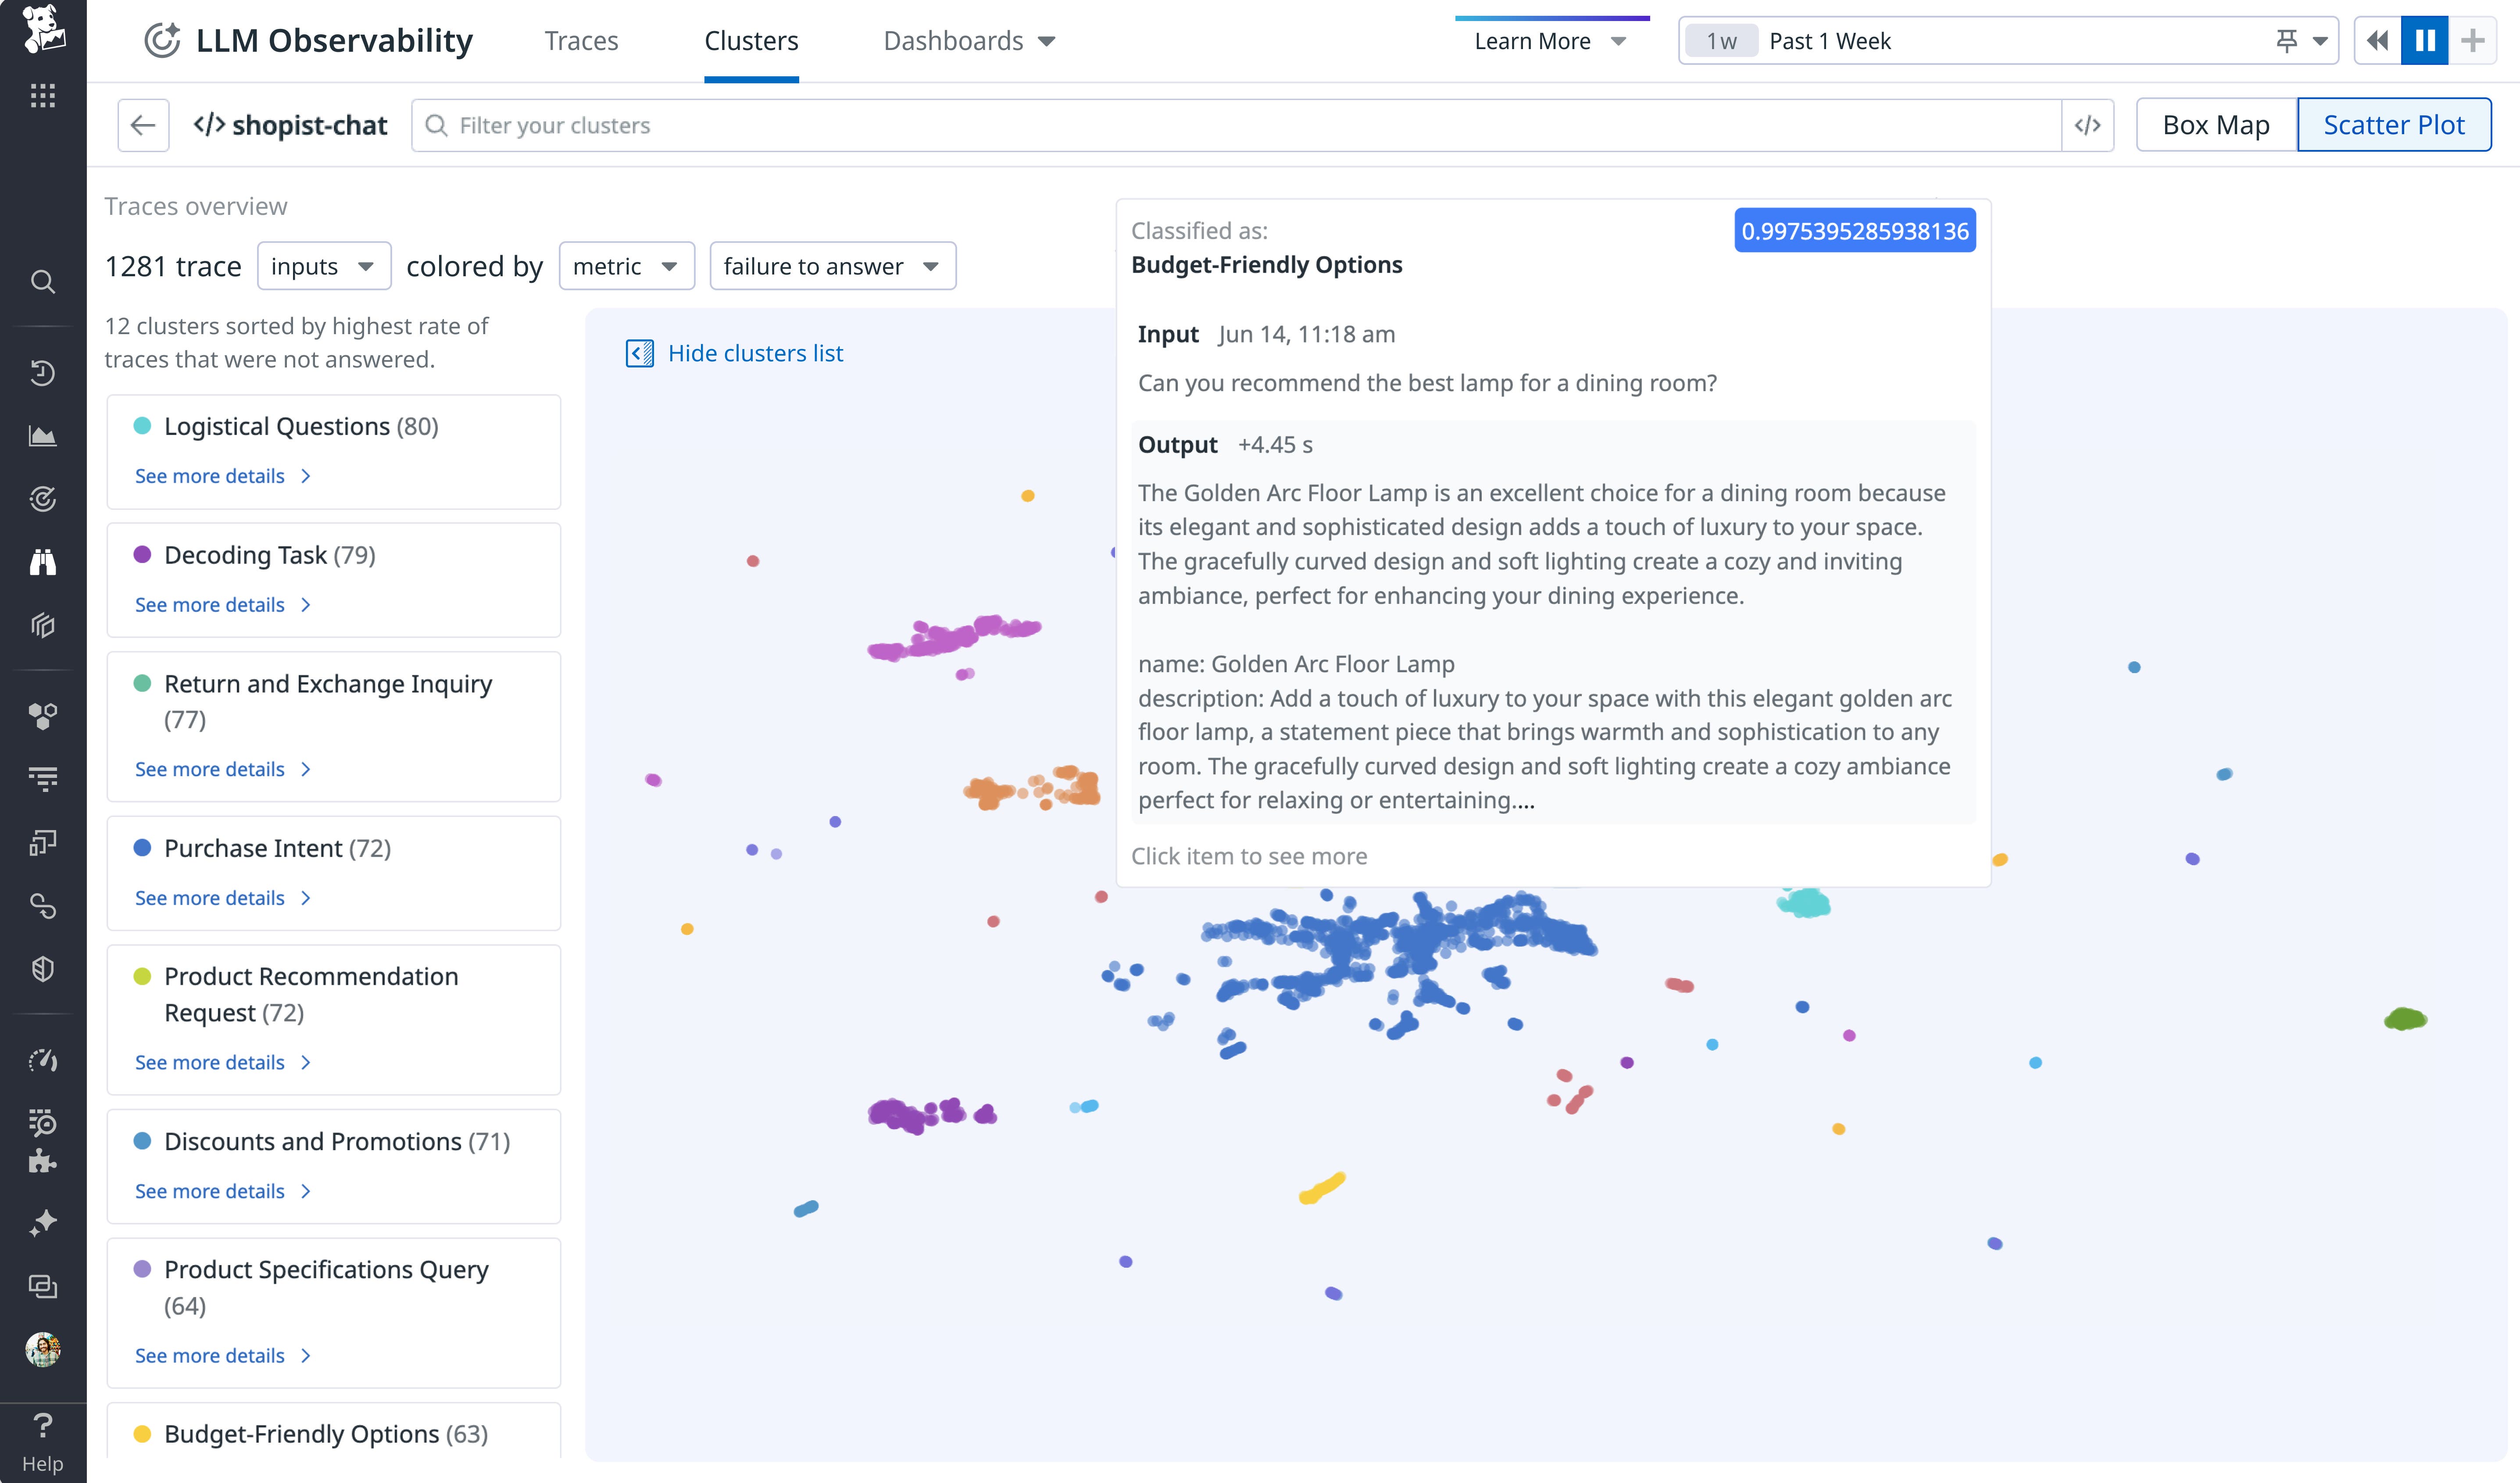
You can also monitor these quality checks in aggregate from the Clusters view. LLM Observability automatically groups prompts and responses into topic clusters based on semantic similarity. The Clusters view enables you to visualize prompt-response pairs grouped by these topics and color-code them by evaluations. This provides an overview of each cluster’s performance across the various out-of-the-box or custom evaluations, helping you identify trends such as topic drift.
Track prompt injections and other security exposures
LLM applications are vulnerable to many different attack techniques, and due to their non-deterministic behavior, it’s extremely difficult to fully secure them. Thus, it’s paramount to track attack attempts and monitor for Personally Identifiable Information (PII) leakage and other harmful consequences. To help you do this, LLM Observability detects and highlights prompt injections and toxic content in your LLM traces.
You can filter the Traces list by the out-of-the-box Security and Privacy checks to quickly find traces that triggered these signals. By inspecting traces for requests that may have been initiated by an attacker, you can spot PII leaks or other unauthorized behavior the attacker may have coaxed from the model.

LLM Observability integrates with Sensitive Data Scanner to scrub PII from prompt traces by default, helping you detect when customer PII was inadvertently passed in an LLM call or shown to the user.
Monitor your LLM applications with Datadog
LLM-based applications are incredibly powerful and unlock many new product opportunities. However, there remains a pressing need for granular visibility into their behavior. By monitoring your LLM applications using Datadog LLM Observability, you can form actionable insights about their health, performance, and security from a consolidated view. LLM Observability is now generally available for all Datadog customers—see our documentation for more information about how to get started.
If you’re brand new to Datadog, sign up for a free trial.
