Bowen Chen
GitHub Actions provides tooling to automate and manage custom CI/CD workflows straight from your repositories, so you can build, test, and deliver application code at high velocity. Using Actions, any webhook can serve as an event trigger, allowing you, for example, to automatically build and test code for each pull request.
Datadog CI Visibility now provides end-to-end visibility into your GitHub Actions pipelines, helping you maintain their health and performance. In this post, we’ll cover how to integrate GitHub Actions with CI Visibility and use metrics, distributed traces, and job logs to identify and troubleshoot pipeline errors and performance bottlenecks.
Integrate GitHub Actions with CI Visibility
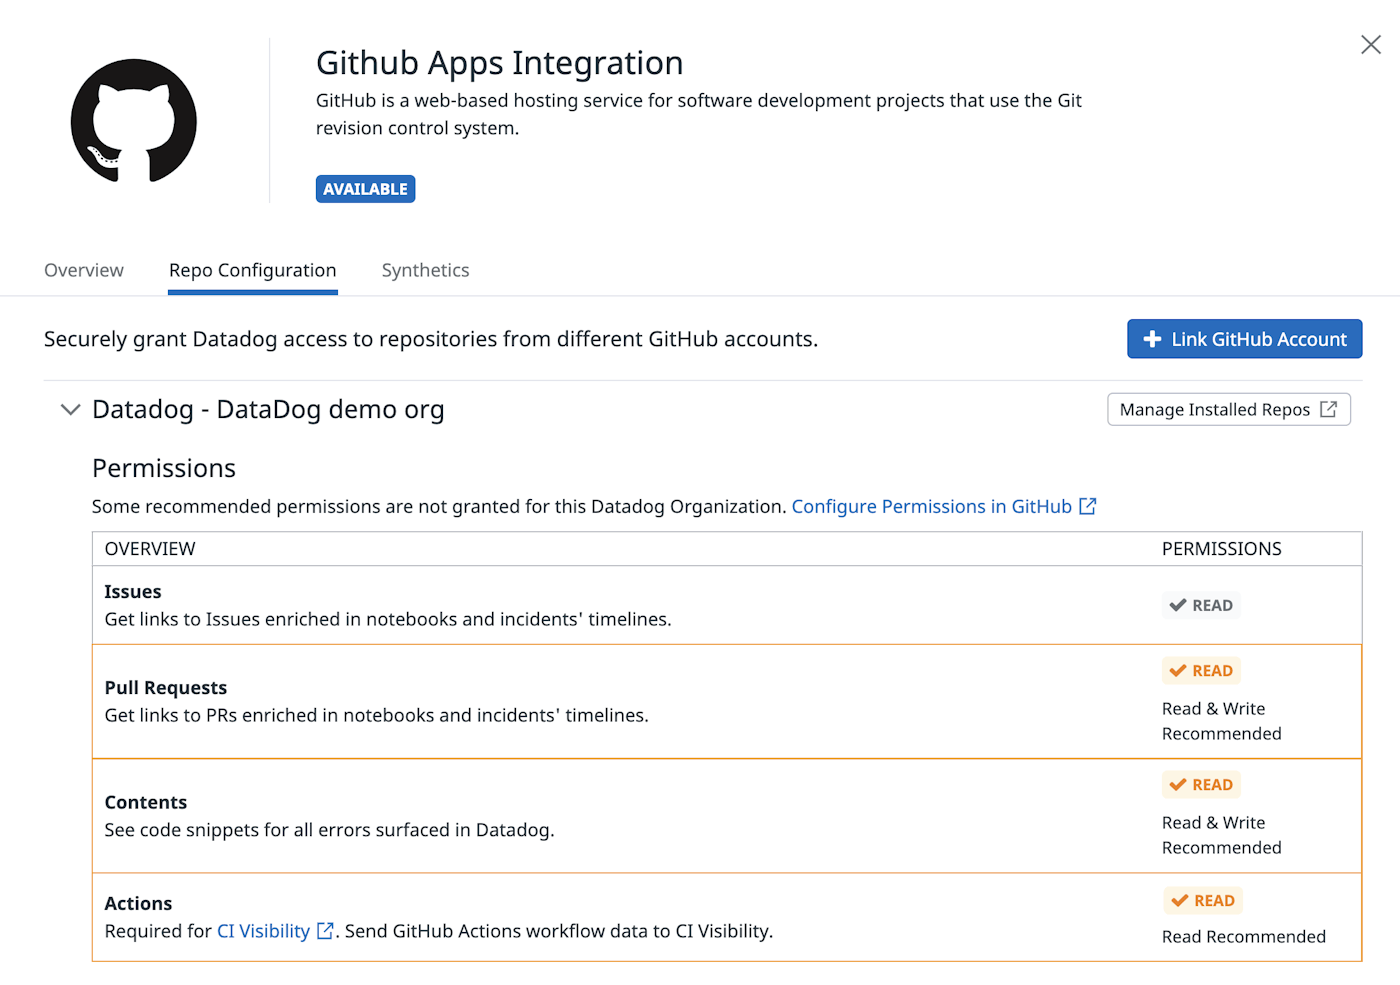
Once you've configured GitHub as a CI provider in Datadog CI Visibility, navigate to the GitHub Apps integration tile. From here, you can manage permissions that allow Datadog to access data from specific accounts and repositories. Below, you can see the option to configure Datadog to collect Actions data (including job logs) from repositories in your account.
Investigate failing pipelines and performance bottlenecks
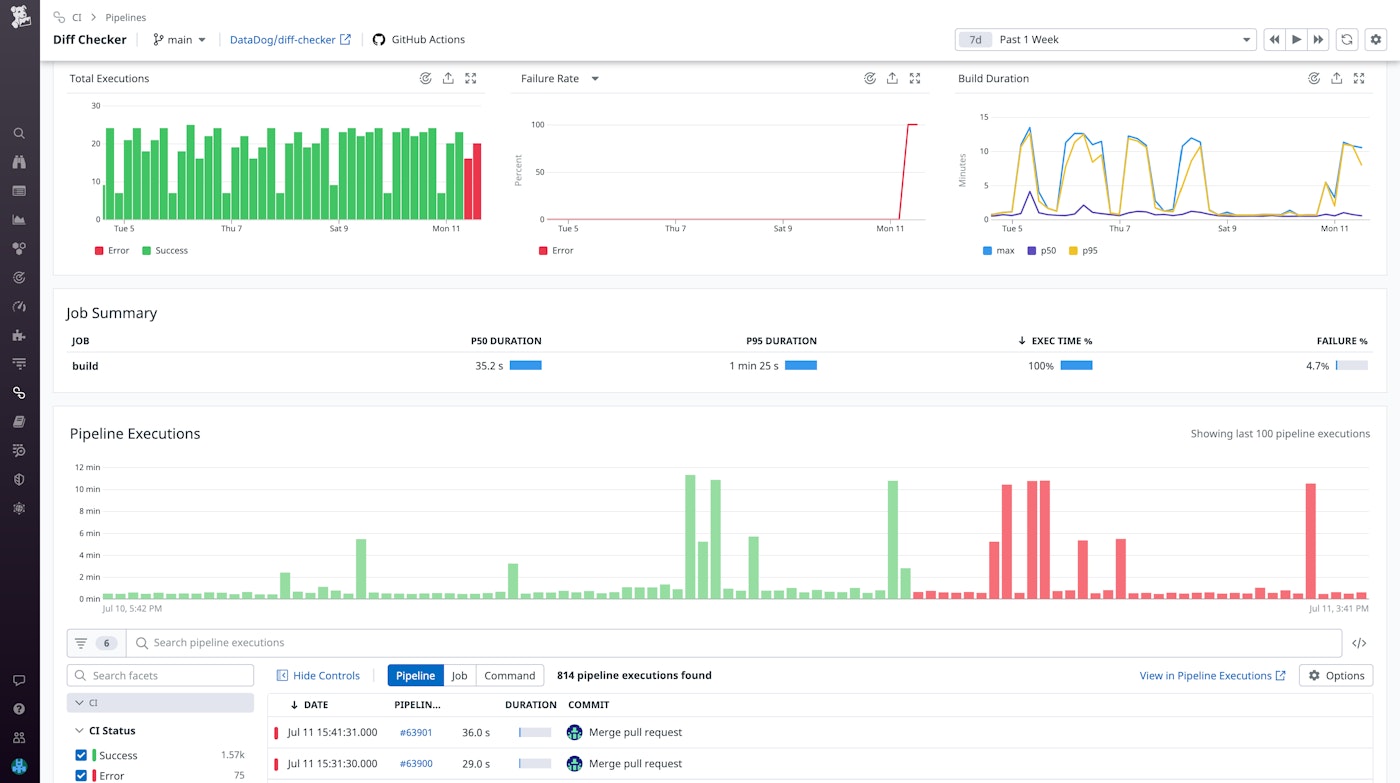
After you’ve set up our integration, you can begin exploring your GitHub Actions pipelines in Datadog CI Visibility alongside pipelines from other CI providers used by your development teams. If you notice any issues when delivering new application code, such as slow builds or failing executions, you can inspect a pipeline for a high-level glance into its recent health and performance metrics. In the Pipeline Details page shown below, the executions and failure rate graphs help you precisely determine when the pipeline began to fail.
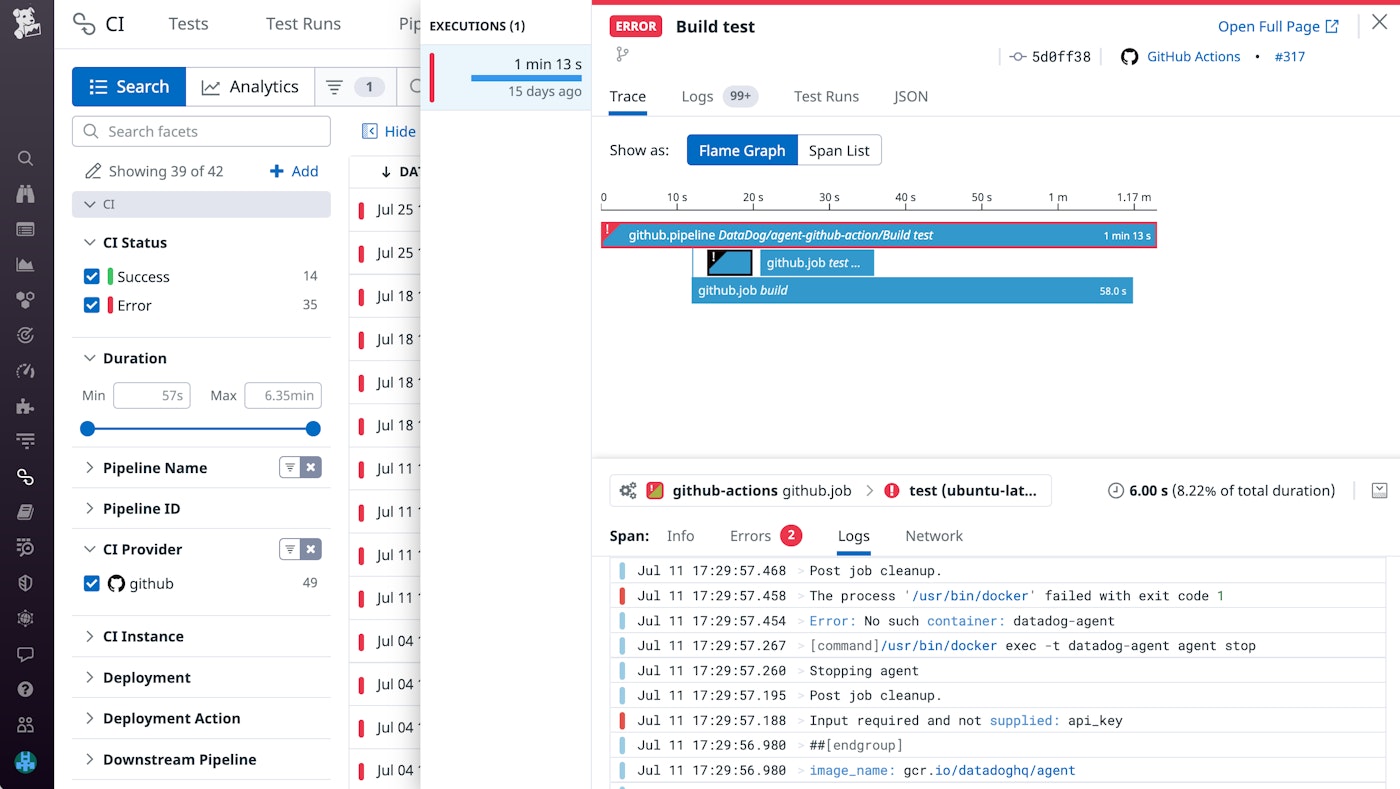
For a more granular view into failing executions, you can track down suspect commits by querying them on the Pipeline Executions page. From here, you can filter by CI provider, pipeline duration, status, and other facets that help you home in on a specific execution. Once you’ve identified the failing execution, you can check its commit details under the “Info” tab, where you can also find additional provider and repository context. Each pipeline execution breaks down individual jobs in a flame graph, displaying their respective durations and whether an error occurred.
If you’ve configured Datadog to collect job logs, you can navigate to the “Logs” tab to view correlated log data from specific spans in the flame graph. Using job logs, you can gather additional context surrounding a returned error by walking through the commands and responses that led up to it. Tools such as Log Anomaly Detection can also help you automatically surface spikes in logs with error statuses along with other abnormal pipeline activity.
While errors and failing executions should remain top of mind, they are not the only signs of a debilitating pipeline. Slowdowns in your pipeline’s build duration can signal issues such as timeouts or performance bottlenecks in need of optimization. Quicker build durations encourage a more continuous and agile delivery process by reducing resources and downtime spent waiting for execution results.
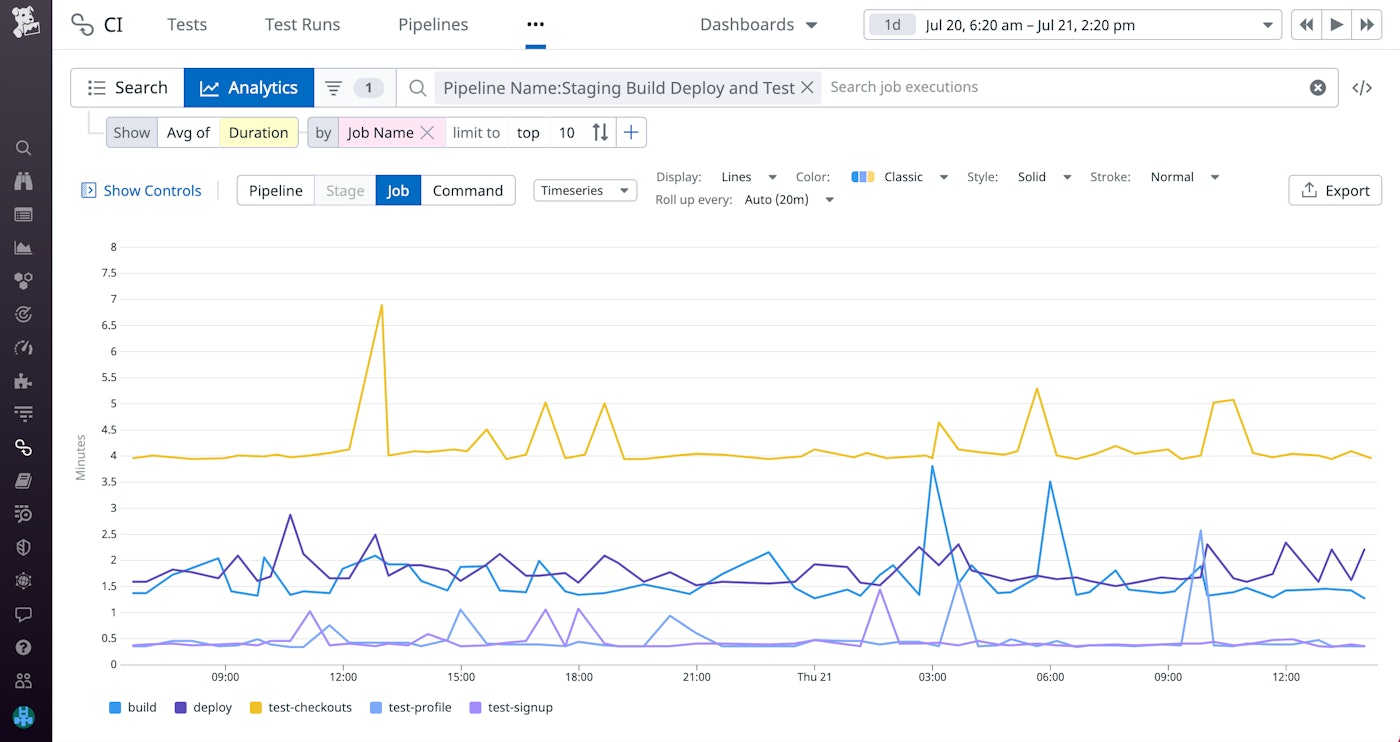
Using our Analytics feature, you can analyze historical trends in your pipeline's build duration, as shown below. This enables you to determine which jobs are exhibiting longer-than-expected build times. If you notice a job with an abnormally long build time, you can investigate by comparing your current version of code against previous commits. You can also dive into your job logs to identify changes that need to be fixed or reverted.
Get visibility into GitHub Actions today
With Datadog’s GitHub Actions integration, you can quickly remediate failing builds and performance regressions, allowing your teams to focus on developing new features. For more information about configuring our integration, refer to our docs. To learn more about monitoring your pipelines and tests with CI Visibility, check out our blog post. If you aren’t already a Datadog customer, sign up today for a free 14-day trial.

