

Aaron Kaplan
Technical Content Writer

Ryan Warrier
Senior Product Manager
Data pipelines are systems for moving and processing data. They are made up of concatenated services and data stores that programmatically ingest data from upstream sources; filter, transform, enrich, and route that data; and deliver it to downstream consumers. These pipelines are critical infrastructure for AI/ML, analytics, and business intelligence (BI) applications, which makes end-to-end monitoring of data pipelines essential to ensuring the health and performance of those applications and the quality of the data they produce.
In this post, we’ll cover the fundamentals of monitoring the health and performance of modern data pipelines. We’ll survey the key observability signals and failure modes for each layer of the data stack and offer some guidelines for troubleshooting data quality and availability. Along the way, we’ll also provide an index to Datadog’s robust suite of solutions for end-to-end visibility into pipelines, including Data Observability, Data Streams Monitoring, and a wide range of integrations with popular pipeline technologies.
The modern data stack
Modern data pipelines are enormously varied in structure. They include event-driven pipelines like those based on Kappa architecture and built around Kafka and Flink, ELT pipelines running Apache Spark in data lakes or dbt transformations in data warehouses, medallion architecture pipelines anchored by data lakehouses, and streamhouse pipelines that combine streaming capabilities with lakehouse storage (to name a few examples). These are all very different types of systems, each with its own distinct operational concerns. But by considering the overarching priorities and unifying foundations of these diverse and evolving systems, we can provide durable and portable guidelines for pipeline monitoring.
To define these guidelines, let’s consider the primary “layers” of the modern data stack, which we illustrate in the following diagram (it also catalogs some of the characteristic components of each layer):
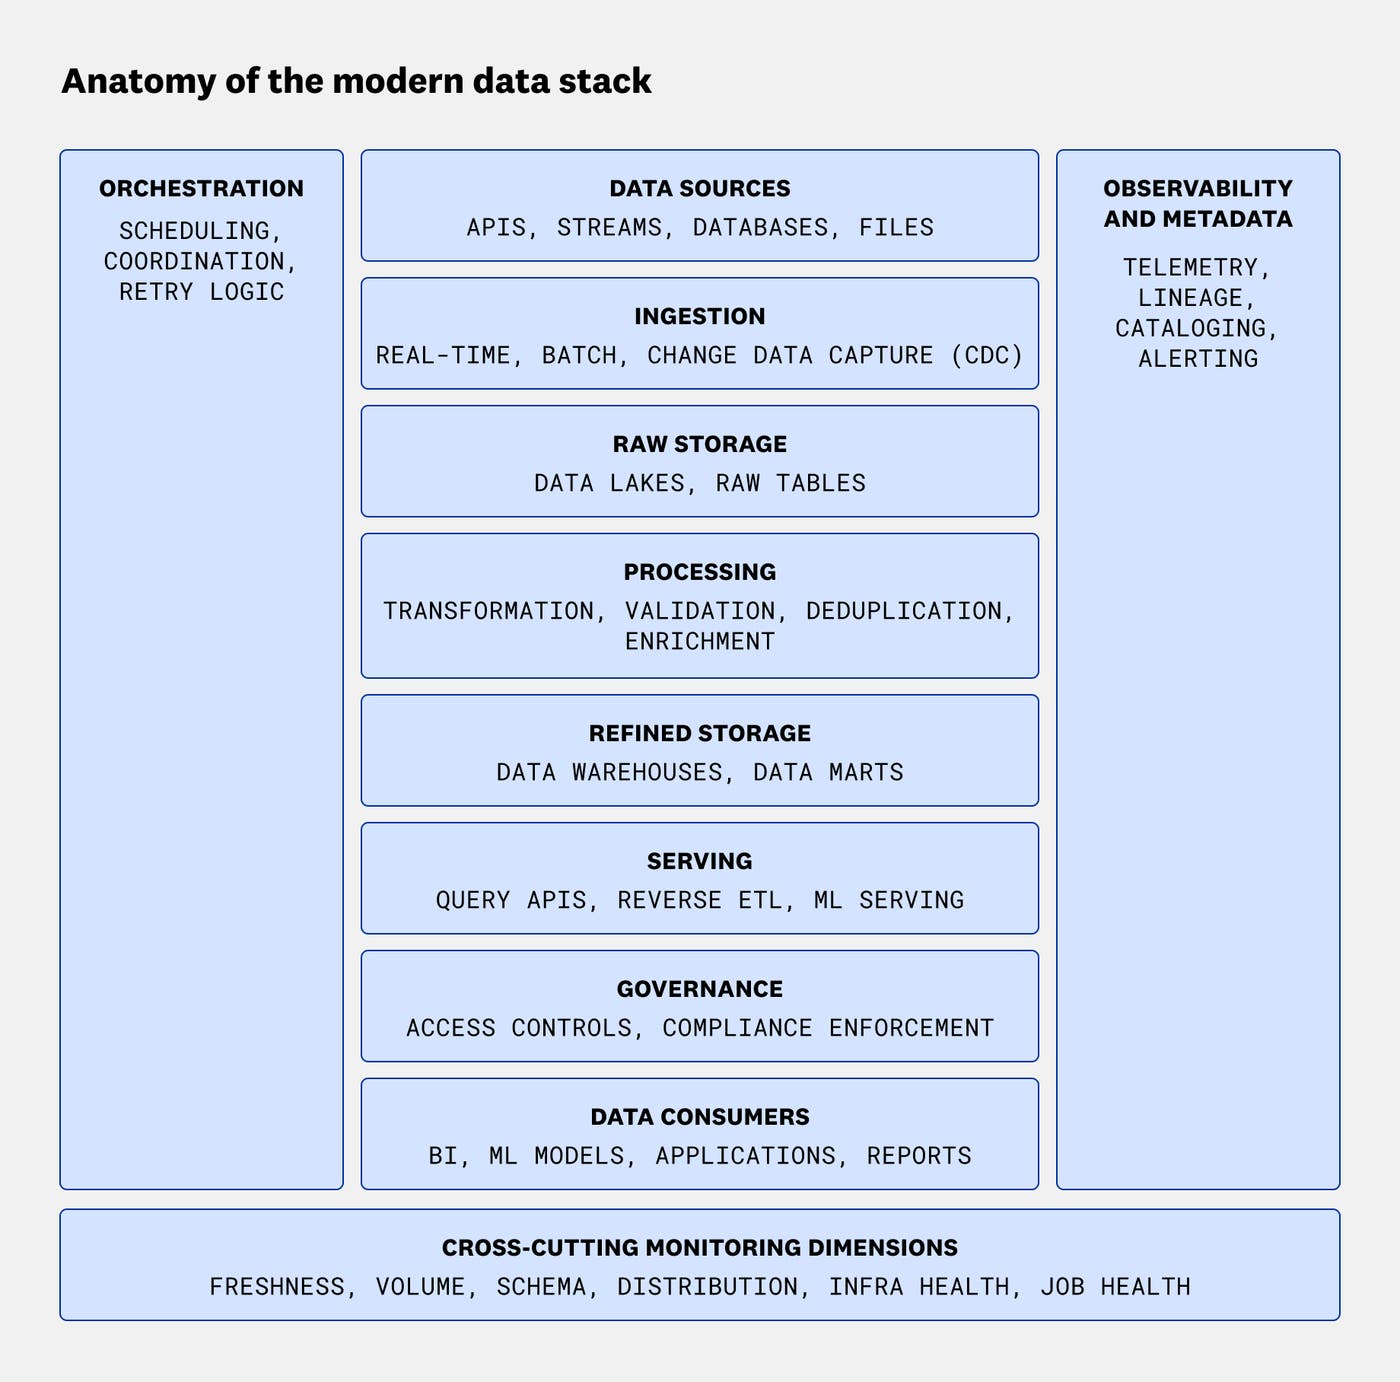
In real-world systems, the stack is not so neatly stratified. The flow of data through the layers is not necessarily linear, nor are these layers necessarily fixed or self-contained. Consider the complex functionality of many pipeline technologies, illustrated below.
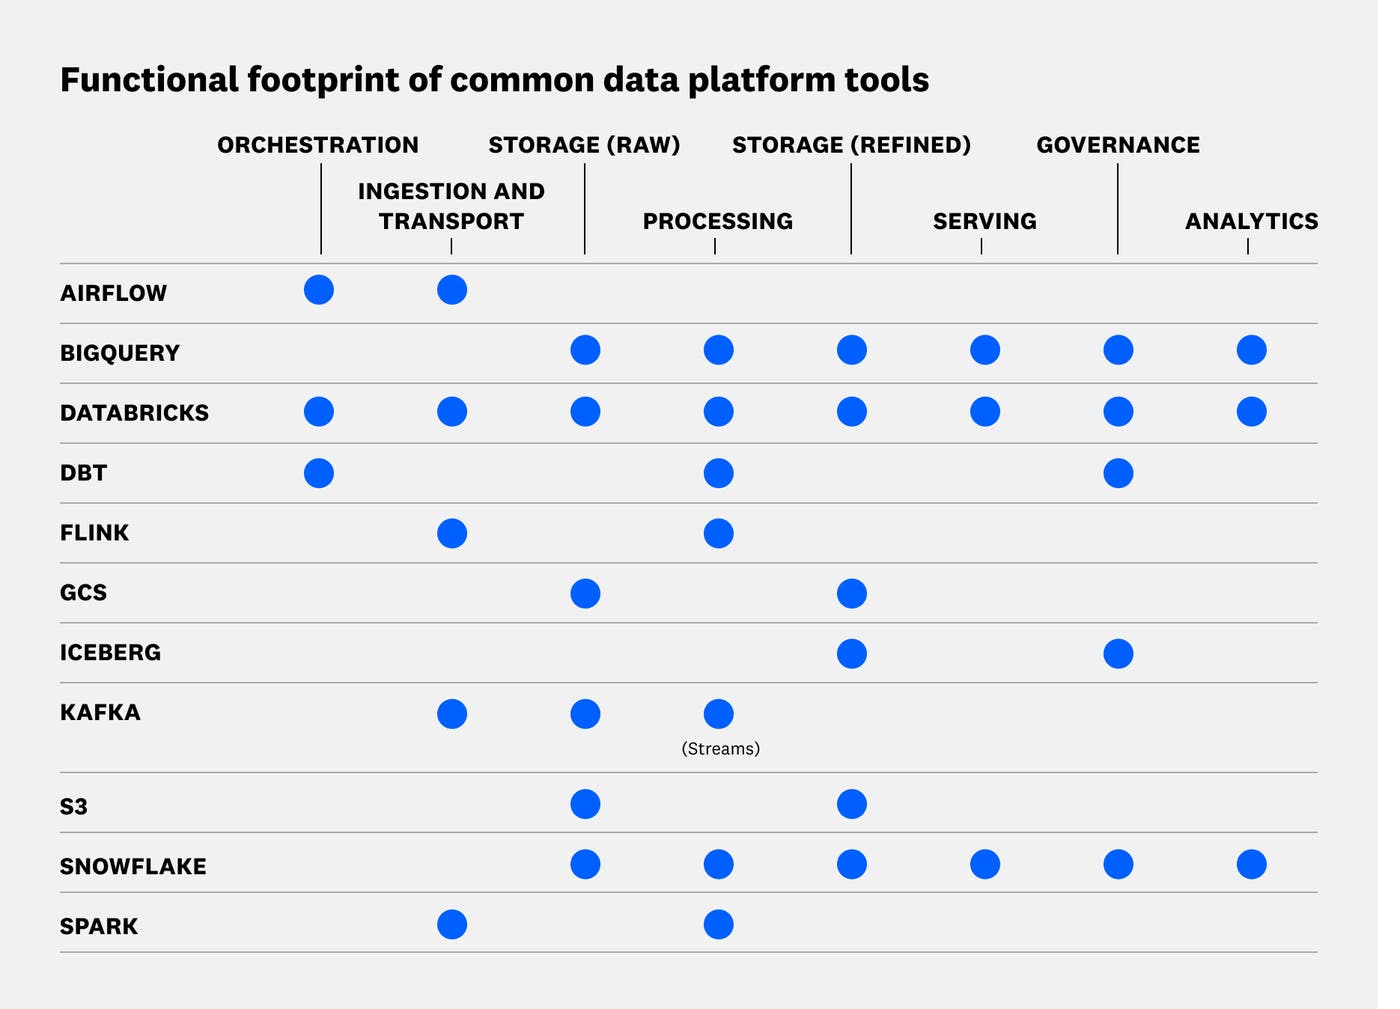
Still, our classification provides a framework that is useful from the perspective of monitoring and troubleshooting: We can use it to define guidelines that hold true across structural paradigms and architectural variations.
End-to-end priorities for data pipeline monitoring
The primary goal of maintaining healthy, performant data pipelines is to ensure data quality and integrity. Broadly speaking, this means ensuring the on-time availability of accurate, complete, consistent, and nonredundant data.
Ideally, proactive monitoring of your pipelines should help you preempt user-facing issues with data quality and integrity. But those already facing specific issues with their data may want to jump ahead to other parts of this guide.
For late data, see ingestion and transport, orchestration, processing, and raw and refined storage (and check backpressure for streaming data).
For missing data, see ingestion and transport, raw and refined storage, and processing.
For incorrect data, see ingestion and transport, processing, and raw and refined storage.
For redundant data, see ingestion and transport and processing.
For user-inaccessible data, see governance and serving.
Before we delve into the specifics of monitoring and troubleshooting at each level of the stack, let’s take stock of the cross-cutting concerns and sources of end-to-end visibility that tie it all together.
End-to-end instrumentation and standardized telemetry are key to understanding the operational health and performance of data pipelines, their underlying infrastructure, and, for stream processing pipelines, producer and consumer services. By collecting and standardizing traces, metrics, and logs from every pipeline component, you can track and troubleshoot pipeline health and performance across system boundaries. OpenTelemetry provides a vendor-neutral framework for instrumenting pipeline components with traces, metrics, and logs and enabling context propagation (per the W3C Trace Context specification), which facilitates correlation of signals from separate components. (As we’ll discuss next, OpenLineage is often better suited to monitoring job runs.)
Data lineage, which captures the flow and transformation (the life cycle) of data in data pipelines, is essential to troubleshooting data quality and integrity, improving pipeline reliability, facilitating data provenance and discovery, and ensuring compliance. Let’s say there’s a job failure in your pipeline, or a problem with the data being served to users; you can use lineage to quickly trace the issue to its source, whether it’s an upstream schema change or faulty aggregation logic. OpenLineage provides an open standard for collecting lineage events across pipeline components, and orchestrators like Airflow emit these events via OpenLineage provider integrations. OpenLineage also captures job run events that can be converted into traces and spans and carry dataset metadata, meaning it provides not just lineage mapping but also pipeline execution telemetry.
Finally, it’s worth taking stock of the cross-cutting monitoring dimensions cited in our stack diagram, above. These are basic questions your monitoring should be tuned to at every layer of the stack:
Data freshness: Is the data current? How recently has it been updated?
Data volume: Does the size of the data fit within expected bounds? Is anything missing or redundant?
Schema: Are data schemas as expected, or have they changed in ways that could interfere with processing logic and break downstream consumers?
Distribution: Do the data values fall within expected bounds?
Infrastructure health: Are compute, storage, and network resources available and healthy?
Job health: Are data ingestion, processing, and delivery working as expected, on schedule?
Datadog solutions and resources
For holistic, end-to-end visibility into data pipelines:
Use Data Streams Monitoring for automated end-to-end topology mapping, health and performance metrics, schema tracking, and visibility into dead letter queues (DLQs).
Use Data Observability: Quality Monitoring to proactively track data freshness, unusual data patterns, and changes in column-level metrics.
Use Data Observability: Jobs Monitoring to proactively detect and troubleshoot failures and latency spikes in ingestion or processing jobs.
The Data Catalog enables centralized tracking and search of data assets (tables, schemas, databases, and pipeline jobs), with automatic sync for supported data sources.
APM, Serverless, Synthetic Monitoring, and Real User Monitoring (RUM) provide preconfigured support for W3C Trace Context.
See also our blog posts on understanding data lineage and building highly reliable data pipelines at Datadog.
Next, we’ll cover monitoring and troubleshooting guidelines for each layer of the modern data stack. For each layer, we’ll discuss primary failure modes, key signals, and common infrastructure dependencies:
Orchestration
The orchestration layer coordinates pipeline execution: scheduling jobs, handling retries, enforcing deadlines, and managing dependencies. Popular tools for pipeline orchestration include Airflow, Dagster, Databricks Workflows, Azure Data Factory, Kubernetes CronJobs, and Prefect.
Primary failure modes
Scheduler failures. If schedulers crash or lose heartbeat, they stop triggering DAG runs and pipelines can go stale without surfacing task-level errors.
Task queue backlogs. Saturated worker pools or execution slots cause tasks to queue indefinitely, which can lead to cascading delays.
DAG parsing errors. Syntax errors or import failures can silently prevent DAG registration; the DAG never runs, so the system records no failure.
Dependency deadlocks. Misconfigured cross-DAG dependencies can stall pipelines.
Scheduling drift. DAGs running behind schedule can gradually erode freshness SLOs.
Task code errors. Bugs, unhandled exceptions, or failed assertions in task logic cause individual task runs to fail and can block downstream dependencies.
Task execution delays. Tasks that run long (e.g., from slow API calls or queries to upstream data stores) delay downstream tasks and can erode freshness SLOs.
Key signals
Scheduler heartbeat. Basic health signal emitted by schedulers during uptime. Alert immediately on skipped heartbeats, as these can indicate resource exhaustion and lead to delayed jobs or stalled pipelines.
SLA deadline alerts. Critical indicators of orchestration running behind schedule and of the pipeline’s capacity to serve fresh data.
Task queue depth and wait time. The number of tasks waiting for available worker slots and how long they’ve been waiting. Alert when wait times would cause freshness SLOs to be missed.
DAG/task run duration trends. Monitor for increases in task duration caused by data growth, which can throw off scheduling.
Task success/failure and retry rates. Break down by DAG and task.
DAG parsing time. If parsing intervals are exceeded, DAGs can be delayed or dropped. Track parsing metrics and alert when parsing times approach or exceed configured timeout intervals.
Pool and slot utilization. Percentage of available execution slots in use. Alert on sustained high utilization, and monitor trends for capacity planning.
Infrastructure dependencies
Scheduler and worker infrastructure failures can kill running tasks without clean error propagation: Monitor scheduler and worker infrastructure health independently of task-level metrics.
Datadog solutions and resources
For monitoring the orchestration layer:
Use Data Observability: Jobs Monitoring for tracking DAG and task-level run results, durations, and failures.
Our integrations with Airflow, Dagster+, and Databricks provide scheduler, task, and workflow metrics.
See also our monitoring guides for Airflow and Kubernetes.
Ingestion and transport
This is where external data enters the pipeline and moves toward storage. Ingestion and transport encompasses real-time streaming (Kafka, Kinesis), batch extraction (Fivetran, Airbyte), and change data capture (Debezium, Flink CDC connectors).
Primary failure modes
Late-arriving data. Backlogs can be caused by consumer lag (streaming data consumers failing to keep pace with producers) or delayed extraction jobs (for batch processing).
Dropped or duplicated data can result from consumer crashes, network interruptions, or lack of properly configured retry policies.
Schema drift. Schema changes in data sources can break downstream processing.
Key signals
Consumer lag (streaming). Sustained consumer lag above baselines is a primary indicator of late data. Monitor by topic and consumer group, and alert when lag exceeds freshness SLO thresholds for more than a few minutes.
Throughput (in vs. out). Drops in consumer throughput without corresponding drops in producer throughput indicate consumer-side failures. Track these metrics together, such as by keeping them side by side on dashboards and by alerting on divergences.
Error and retry rates. Failed deliveries, serialization errors, and DLQ volume are primary indicators of data loss. Alert on any sustained increase above zero.
Connector and connector task status (Kafka Connect). Connectors in a failed state or tasks restarting repeatedly may indicate configuration issues, credential expiry, or other problems affecting access to data sources. Monitor task state transitions, and alert immediately on failed connector states and repeated task restarts.
Consumer group rebalancing frequency and duration (Kafka). Frequent or prolonged consumer group rebalancing interrupts consumption and causes lag to spike. Generally speaking, you may want to alert on rebalances lasting longer than a few seconds or occurring more than a few times per day, but acceptable thresholds will vary and should be calibrated to freshness SLOs.
Schema compatibility check failures. A failed check in your schema registry signals that a producer tried to introduce a breaking schema change. Alert on every failure, as each represents a potentially pipeline-breaking change.
CDC replication lag. CDC connectors failing to keep up with source databases can cause missed log retention windows or bloated write-ahead logs (WALs) and necessitate costly full-table snapshots. All of this can cause network and processing bottlenecks in addition to compromising downstream data freshness. Monitor replication slot lag and WAL size (Postgres), as well as binlog position or GTID lag (MySQL), to preempt these failures.
Infrastructure dependencies
As a starting point, monitor Kafka broker disk I/O saturation (a common performance bottleneck) and cross–availability zone network throughput alongside pipeline metrics.
Datadog solutions and resources
For monitoring ingestion and transport:
Use Data Streams Monitoring to track end-to-end latency from ingestion through serving.
Use the integrations with Kafka (broker and consumer), Amazon MSK, Confluent Cloud, Amazon Kinesis, Airbyte, and Flink for throughput, lag, error rate, and connector- and operator-level health metrics.
See also our in-depth guides to monitoring Kafka, Amazon MSK, and Confluent Cloud.
Raw storage
Raw storage is where data lands after ingestion into the pipeline and before any processing. The primary raw storage solutions include object stores (S3, GCS, Azure Blob) and raw tables in lakehouses (Iceberg) or staging schemas.
Primary failure modes
Incomplete or missing data. Write failures, timeouts, or partial uploads can leave data missing from downstream processing without necessarily raising errors at the ingestion layer.
Schema evolution causing erroneous or failed reads. Table format changes (partition spec evolution, column additions) can silently break readers expecting prior structures.
Storage-level access failures. Bucket policy updates, IAM role modifications, or expired credentials cause read failures in downstream jobs.
Premature data deletion. Aggressive life cycle policies or time-to-live (TTL) settings remove raw data before reprocessing or backfill jobs have consumed it, compromising downstream data integrity.
Key signals
Write success/failure rates. Track the ratio of successful writes to attempted writes per source, table, and partition to preemptively detect gradual degradation. Alert on sustained or repeated failures. (For certain critical data sources, you may want to alert on any and all write failures.)
Row counts and byte volume on load. Sudden drops or spikes relative to historical baselines indicate upstream source changes or partial loads. Monitor for anomalies against rolling baselines, since expected volume often varies by time of day and day of the week.
Object/file counts and sizes. Anomalous file sizes can signal partition problems or compaction issues and lead to runaway processing overhead, memory pressure, and other problems. Monitor average file size per partition, and alert when it drops below a floor indicating small-file accumulation.
Read latency from downstream jobs. Rising read times against raw storage often indicate storage throttling, hotspots among partitions, and other issues. Correlate read latency with request rate metrics to distinguish throttling from genuine data growth.
Access denied errors. Authentication or authorization failures in storage access logs point to credential or policy changes. Alert on any access denied error from a service account that previously had access.
Infrastructure dependencies
Request rate limits for object stores can silently throttle ingestion. Ensure that storage service metrics are captured with the rest of your pipeline telemetry.
Datadog solutions and resources
For monitoring raw storage:
Use Data Observability for volume and freshness monitoring on raw tables.
Use our integrations with S3 and GCS for error rate, latency, and request metrics.
Processing
The processing layer transforms raw data into usable form through cleaning, validation, deduplication, enrichment, and aggregation. It spans analytics engines (Spark), stream processors (Flink), and transformation tools (dbt).
Primary failure modes
Transformation logic errors. Incorrect SQL statements, join key mismatches, and similarly flawed logic can silently produce semantically incorrect data.
Delayed processing. Insufficient compute resourcing, inefficient parallel processing, increases in data volume, inefficient code and queries, and latency accessing input data can all slow processing.
Redundant processing. Retries, backfills, or other operations fail to account for already-processed records, creating redundant data in output tables.
Job failures caused by resource contention. Insufficient memory or compute capacity for processing can lead to missing or stale data.
Backpressure propagation (streaming). Slow Flink operators can cause processing backlogs that slow down or stall entire pipelines.
Key signals
Job and model success/failure rates. Alert on all job crashes.
Job duration trends. Track to preempt data volume growth from outpacing compute capacity and identify suboptimal query plans.
Data quality test results. Monitor dbt test pass/fail rates, Great Expectations validation results, and custom tests for null rates, uniqueness violations, range violations, and distribution anomalies.
Source freshness (dbt). The time elapsed since the most recent record in a source table; dbt’s warn_after and error_after thresholds make this a native SLI for ELT pipelines. Set thresholds based on each source’s expected update cadence rather than a single global default.
Cost tracking. Changes in data volume and distribution can drive up the compute a job needs, and costs along with it. Track consumption per job and alert on sustained increases so you can optimize before the bill arrives.
Resource utilization. CPU, memory, shuffle read/write, and disk spill metrics on Spark executors or Flink task managers can help you diagnose whether failures are logic or capacity problems. Alert on sustained high utilization as a leading indicator of impending job failures.
Backpressure indicators (Flink). The Flink web UI and metrics API expose per-operator backpressure status, identifying exactly where bottlenecks sit. Alert when any operator shows sustained HIGH backpressure, and use the per-operator breakdown to pinpoint whether the issue is compute, state access, or a slow sink.
Row count deltas. Comparing input row counts to output row counts across a transformation catches unexpected filtering, failed joins, or deduplication anomalies. Set acceptable delta ranges per transformation—a join that drops 60% of rows when it historically drops 2% is a data quality incident.
Infrastructure dependencies
Cluster resource contention (shared Spark clusters, Kubernetes pod scheduling) can cause job failures unrelated to pipeline logic.
Warehouse compute scaling (Snowflake auto-suspend/resume, BigQuery slot allocation) can introduce latency spikes when transformations trigger cold starts.
Datadog solutions and resources
For monitoring data processing:
Use Data Observability: Jobs Monitoring to track transformation job results, durations, compute resources utilization, and test outcomes.
Use Log Management to debug failed processing steps.
Use Data Streams Monitoring for visibility into end-to-end latency across stream processing pipelines.
The integrations with Flink and dbt Cloud provide operator- and model-level metrics.
See also our guide to basics and best practices for dbt.
Refined storage
The refined storage layer holds production-quality data ready for consumption, spanning data warehouses (Snowflake, BigQuery, Amazon Redshift), data marts, and curated (gold-layer) lakehouse tables.
Primary failure modes
Query performance degradation. Warehouse overload from competing workloads can cause slowdowns affecting all consumers.
Stale tables. Tables return stale data to consumers as a result of failed or delayed upstream transformations.
Table format mismanagement. Improperly compacted Iceberg tables can cause data to accumulate in a large number of small files, leading to degraded read performance.
Breaking schema changes. Changes such as renamed columns or dropped fields can break downstream models, reports, and dashboards.
Runaway costs. Unoptimized queries, excessive materialized views, and unchecked warehouse scaling can lead to unwelcome surprises on compute bills.
Key signals
Query latency and queue times. Track average and p99 duration and protracted queuing of queries. Alert when p99 latency or queue depth threatens SLOs.
Warehouse utilization. Track Snowflake credit consumption, BigQuery slot utilization, Redshift workload management metrics, etc. Monitor trends for capacity planning.
Concurrent workload activity. In multi-tenant warehouses, monitor the number of concurrent queries and active workloads sharing compute capacity in order to preempt and troubleshoot resource contention. Alert when concurrent load approaches levels that have historically impeded query performance.
Table freshness. Check the timestamps of the latest writes against expected update cadences. Set per-table freshness SLOs.
Row count and volume trends. Monitor for volume anomalies, particularly unexpected drops (indicating upstream failures) or spikes (indicating, for example, deduplication failures).
Compaction metrics. Track file count per partition and average file sizes. Controlling the segmentation of data into well-sized files is essential to maintaining query performance, and small-file accumulation is a common cause of bottlenecks. Alert when file counts exceed target ranges.
Schema change events. Alert on column and type changes in production tables to ensure against breakages in downstream consumers and compromised data integrity.
Infrastructure dependencies
Warehouse auto-scaling behavior introduces variability that must be taken into account when monitoring performance trends. Correlate warehouse event logs of events such as cold starts and cluster additions with query performance data to distinguish transient scaling effects from sustained or anomalous performance degradation.
Network latency must also be taken into account for cross-region querying.
Datadog solutions and resources
For monitoring refined storage:
Use Data Observability for freshness, volume, and schema monitoring on refined tables, as well as data warehouse query-performance data.
Database Monitoring provides visibility into query performance, explain plans, and host-level metrics for operational databases.
Our integrations with Snowflake and BigQuery provide warehouse utilization and query performance metrics.
See also our guide to monitoring Snowflake.
Serving
The serving layer delivers data to consumer applications and end users. It encompasses query APIs and caches, reverse ETL into SaaS tools, and ML feature serving for model training and inference.
Primary failure modes
Stale caches or materialized views. Failure to refresh cached query results can compromise data freshness.
Reverse ETL sync failures. Credential changes, API rate limiting, and schema mismatches can cause sync jobs to fail.
ML feature-serving skew. Divergence between features used in training and those served at inference can degrade model performance.
API latency and availability. Response times can spike under load or during warehouse cold starts, which can cause timeouts in consumers.
Data drift. Shifts in the statistical distribution of served data can change model behavior and introduce bias. Data quality monitoring can help with proactive detection of drift.
Key signals
API response latency and HTTP error rates. Alert on p99 latency breaching SLOs and error rate spikes.
Cache hit rate and refresh timing. Drops in cache hit rates and missed refresh rates may indicate that consumers are hitting warehouses directly or seeing stale results.
Reverse ETL sync status. Track sync success/failure rates and the number of successfully delivered and dropped records. Alert on any sync failures and sustained drops in the number of delivered records, which may point to consumer-side rate limiting or breaking schema changes causing silent partial failures without triggering errors.
Feature freshness. Check the freshness of served features to preempt training-serving skew.
Downstream consumer health. Monitor error rates and query failures in downstream applications, models, and observability tools. These may signal serving-layer issues that haven’t yet triggered upstream alerts, such as access policy changes.
Infrastructure dependencies
CDN and API rate limiting, timeouts, and caching can interfere with serving-layer performance. Check internal configurations and monitor SaaS API rate limiting.
Datadog solutions and resources
For monitoring data serving:
Use APM to track request latency and errors through query APIs and downstream service calls.
Use Data Streams Monitoring to monitor end-to-end latency from ingestion through serving.
Use Data Observability to monitor the freshness and volume of datasets consumed by serving endpoints.
Governance
The governance layer is the regulatory boundary between the pipeline and its consumers, controlling access to pipeline data and enforcing classification and compliance policies.
Primary failure modes
Permission changes and credential expiry. Uncoordinated policy or role reconfigurations and unexpected credential expiry can make data invisible or unavailable to consumers, disrupting data delivery and halting automated access.
Data misclassification. Incorrectly classified data may cause failure to implement compliance and other access policies.
Compliance policies out of sync with schema changes. New columns may inherit overly permissive or restrictive default access policies, exposing sensitive data or mistakenly blocking access.
Audit gaps. Incomplete logging coverage can make it impossible to answer questions about access to sensitive data (who, what, when) that may be critical to maintaining regulatory compliance and trust.
Key signals
Access denied rates. Track access denied errors by service account, role, and dataset. Unexpected spikes may indicate unsynchronized policy changes or credential expiry.
Credential expiry timelines. Track the lifespans of all critical API tokens, credentials, certificates, and keys. Set alerts to preempt unexpected expiry.
Classification coverage. Track the percentage of columns in production tables that have been classified according to governance policies. Alert on new unclassified columns in production in order to prevent the exposure of sensitive data, as well as the propagation of overly restrictive access rules.
Policy change audit logs. Log all changes to access policies and role assignments. Alert on policy changes affecting critical datasets.
Infrastructure dependencies
Audit log completeness depends on top-to-bottom, end-to-end logging coverage.
Datadog solutions and resources
For monitoring data governance:
Use Cloud SIEM for ingesting audit logs and detecting anomalous access patterns and policy violations.
Use Data Observability to surface schema changes that may have governance implications (such as new unclassified columns in production tables) and to track sensitive data usage via lineage.
Reliable data, from end to end
In this post, we’ve covered the fundamentals of monitoring and troubleshooting modern data pipelines from end to end. We’ve also indexed the wide range of applicable resources provided by Datadog, from Data Observability and Data Streams Monitoring to numerous integrations and in-depth monitoring guides. Of course, data pipelines come in many shapes and sizes, and as AI, ML, analytics, and BI applications evolve, so do they. These guidelines are only a starting point.
If you’re new to Datadog, you can sign up for a 14-day free trial.
