Thomas Sobolik
Core Web Vitals are a set of metrics that represent the most important indicators of a site’s UX performance. These metrics, which focus on load performance, interactivity, and visual stability, simplify UX metric collection by signaling which frontend performance indicators matter the most. Core Web Vitals scores are used in Google’s PageRank algorithm, so suboptimal scores will not only lead to increased churn and lost revenue, but may also impact SEO performance.
You can use Datadog RUM and Synthetic Monitoring to get comprehensive visibility into your site’s Core Web Vitals scores. In this post, we’ll give a brief overview of the Core Web Vitals, explaining their significance for frontend performance, and show how you can:
- Monitor Core Web Vitals from an out-of-the-box dashboard
- Trouboleshoot suboptimal Core Web Vitals scores in the RUM Explorer
- Use Synthetic browser tests to proactively monitor Core Web Vitals scores in any environment
What are the Core Web Vitals?
Google specifies three Core Web Vitals: Largest Contentful Paint (LCP), Interaction to Next Paint (INP), and Cumulative Layout Shift (CLS). These metrics observe load performance, interactivity, and visual stability, respectively. The benchmark for each of these metrics is computed over the 75th percentile of page loads in order to account for mobile performance issues that result from poor network connectivity and are therefore expected.
Largest Contentful Paint
Largest Contentful Paint refers to the moment in the page load timeline in which the largest DOM object in the viewport is rendered. A LCP score that exceeds 2.5 seconds could be the result of slow service responses or render-blocking JavaScript tags and CSS style sheets.
Interaction to Next Paint
Interaction to Next Paint represents the user interaction with the longest latency (ignoring outliers). An INP score that exceeds 500 milliseconds could indicate that loading events on the browser’s main thread, such as parsing or executing CSS or JavaScript files, are persisting while users are trying to interact with the page.
Cumulative Layout Shift
If your page includes dynamic content that is rendered asynchronously, such as third-party ads, users may experience visual instability as parts of the site move around unpredictably. Cumulative Layout Shift quantifies this phenomenon with a decimal score, where a score of zero indicates that no layout shift has occurred. Google recommends that a CLS score should be less than 0.1.
View Core Web Vitals in the RUM Web App Performance dashboard
By collecting Core Web Vitals within RUM, Datadog enables you to incorporate these metrics into the broader picture of your web app’s user-facing performance. RUM’s out-of-the-box Web App Performance dashboard shows p75 values for each Core Web Vital as it relates to Google’s defined thresholds, alongside traffic volume data and traditional RUM performance metrics. You can customize the dashboard to show a higher percentile if you need to set a stricter standard.
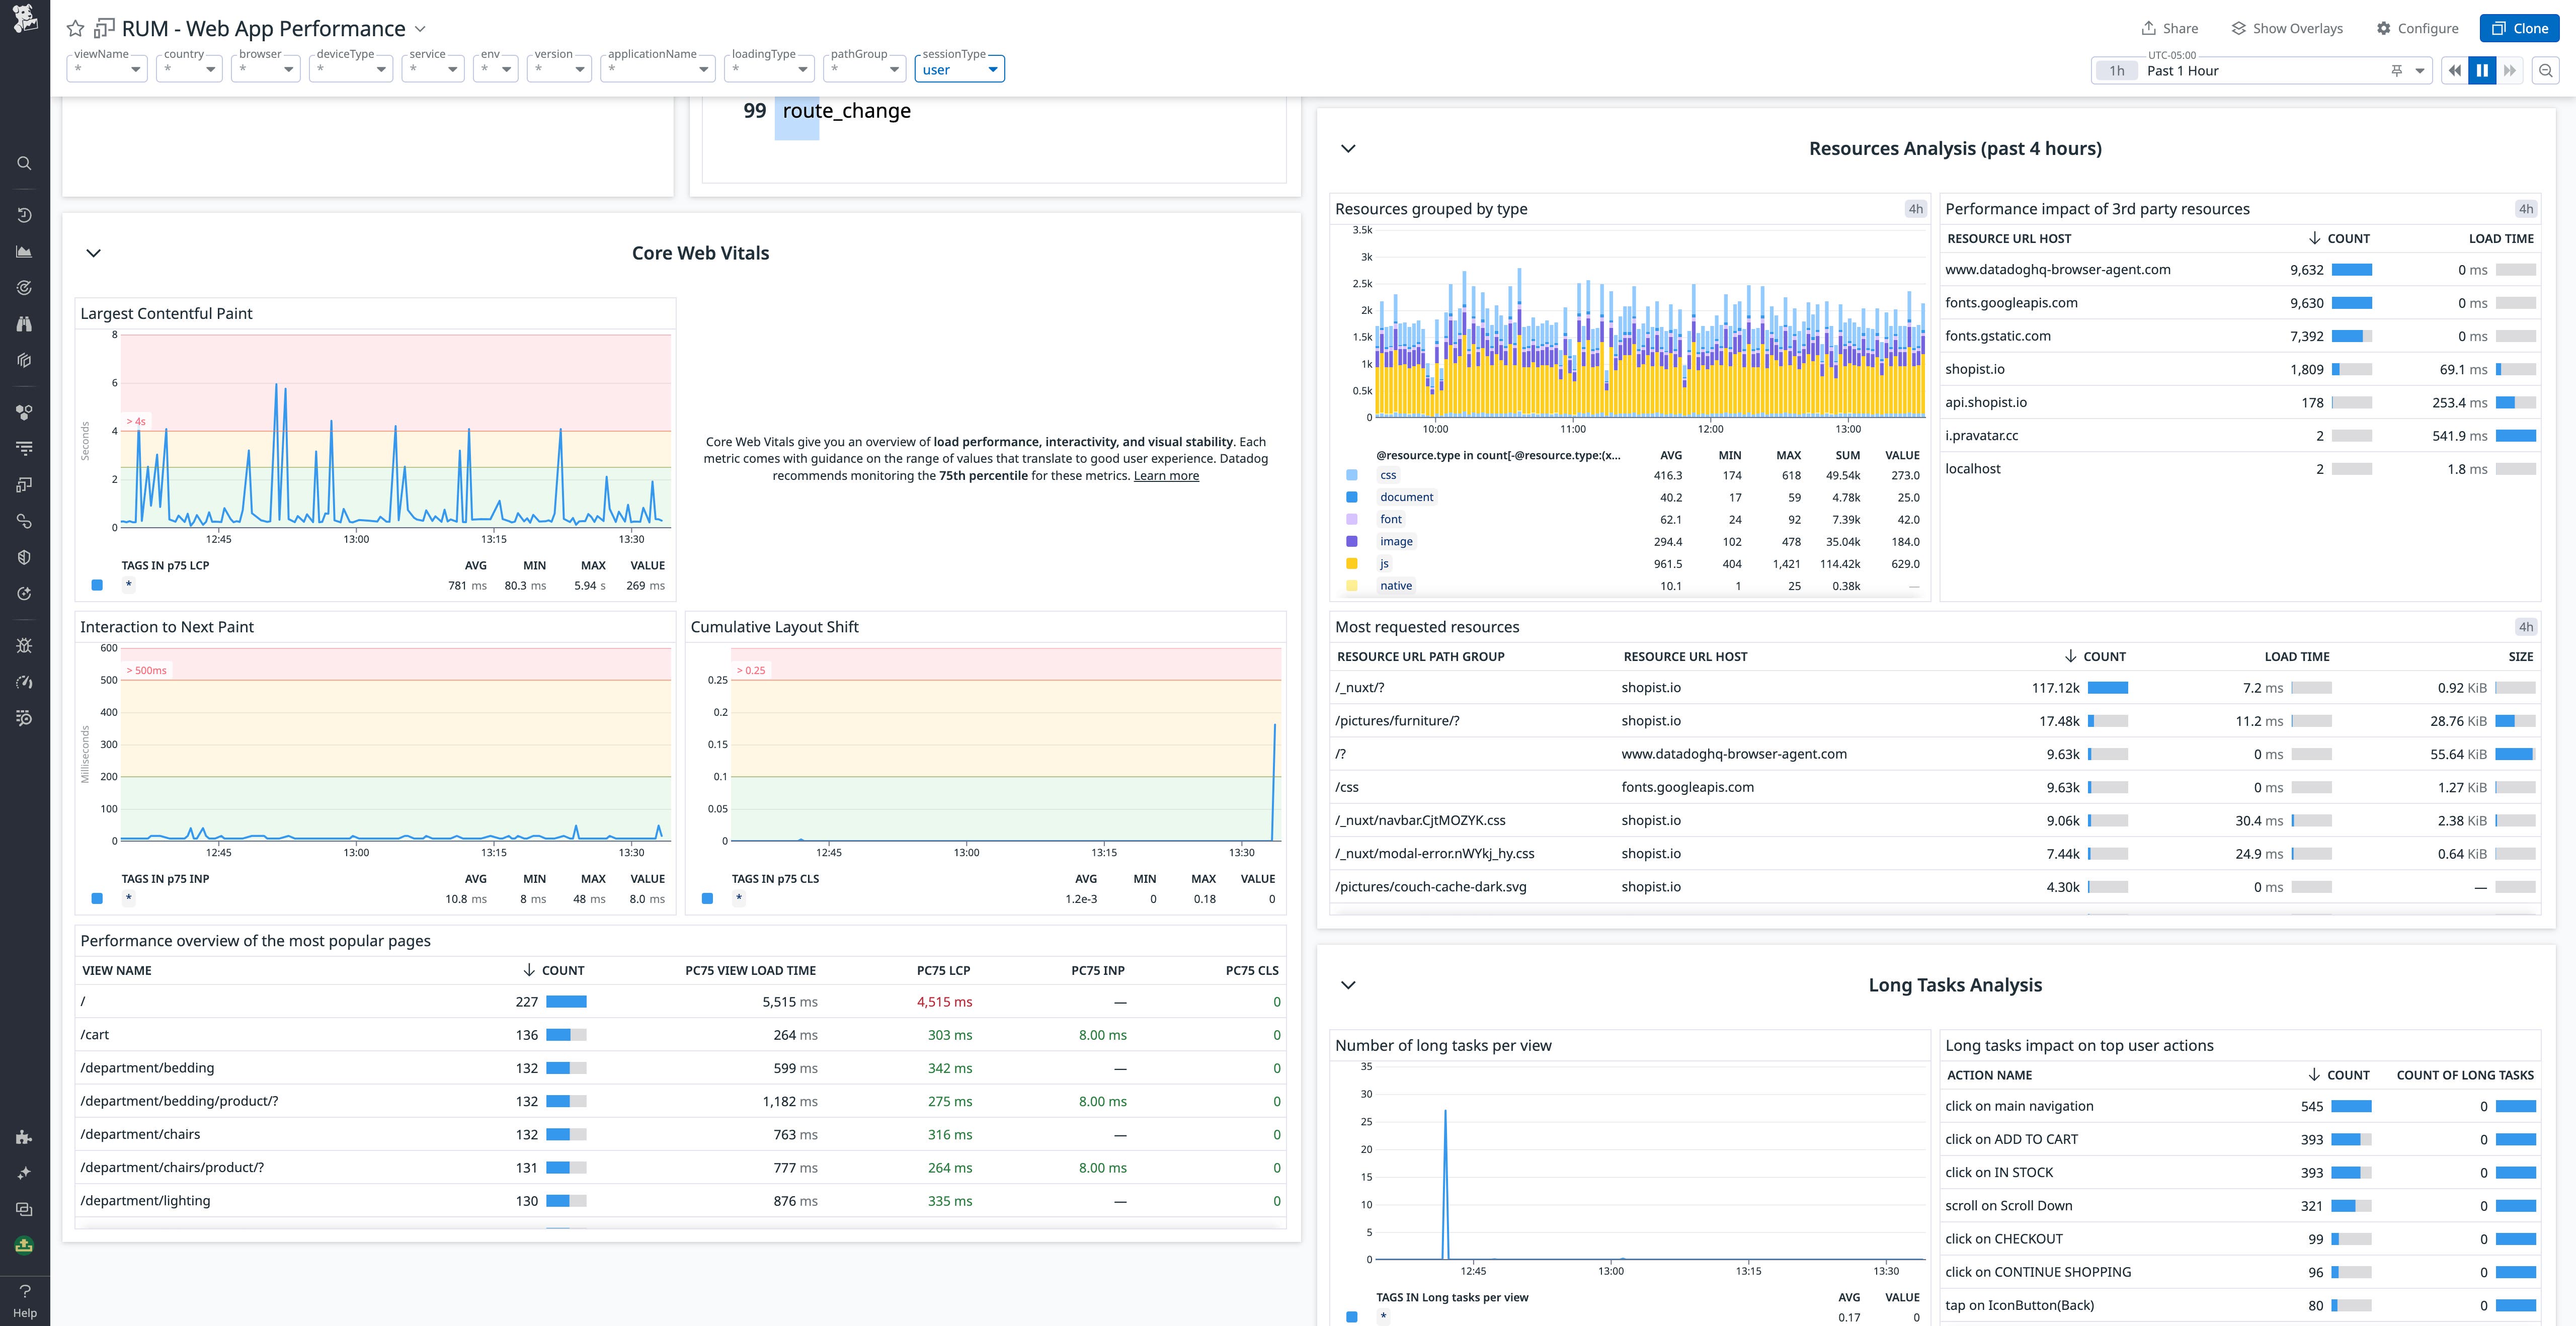
With this bird’s-eye view, you can characterize the overall load performance of your web page and begin to investigate potential bottlenecks. Using the included tags, you can filter the metric data to identify issues affecting particular regions, device types, or browsers. You can also customize the dashboard to add further layers of insight, such as user behavior metrics (i.e., overall traffic, the length of user sessions).
Troubleshoot suboptimal Core Web Vitals scores in the RUM Explorer
Once you’ve spotted a moment in the data you’d like to investigate, you can pivot from the Web App Performance dashboard to the RUM Explorer for a more granular view. The RUM Explorer presents a list of pageviews that occurred during the specified time frame, and you can use tag-based filters to zero in on views from a specific subset of users—or to isolate views that exceed the accepted threshold for a particular Core Web Vital.
Clicking on a specific page view will take you to its corresponding RUM waterfall, which gives a rundown of each resource the page loads in order, along with how long it took. RUM metrics—including the Core Web Vitals—are graphed on the waterfall to provide insight into the potential causes of load performance bottlenecks.
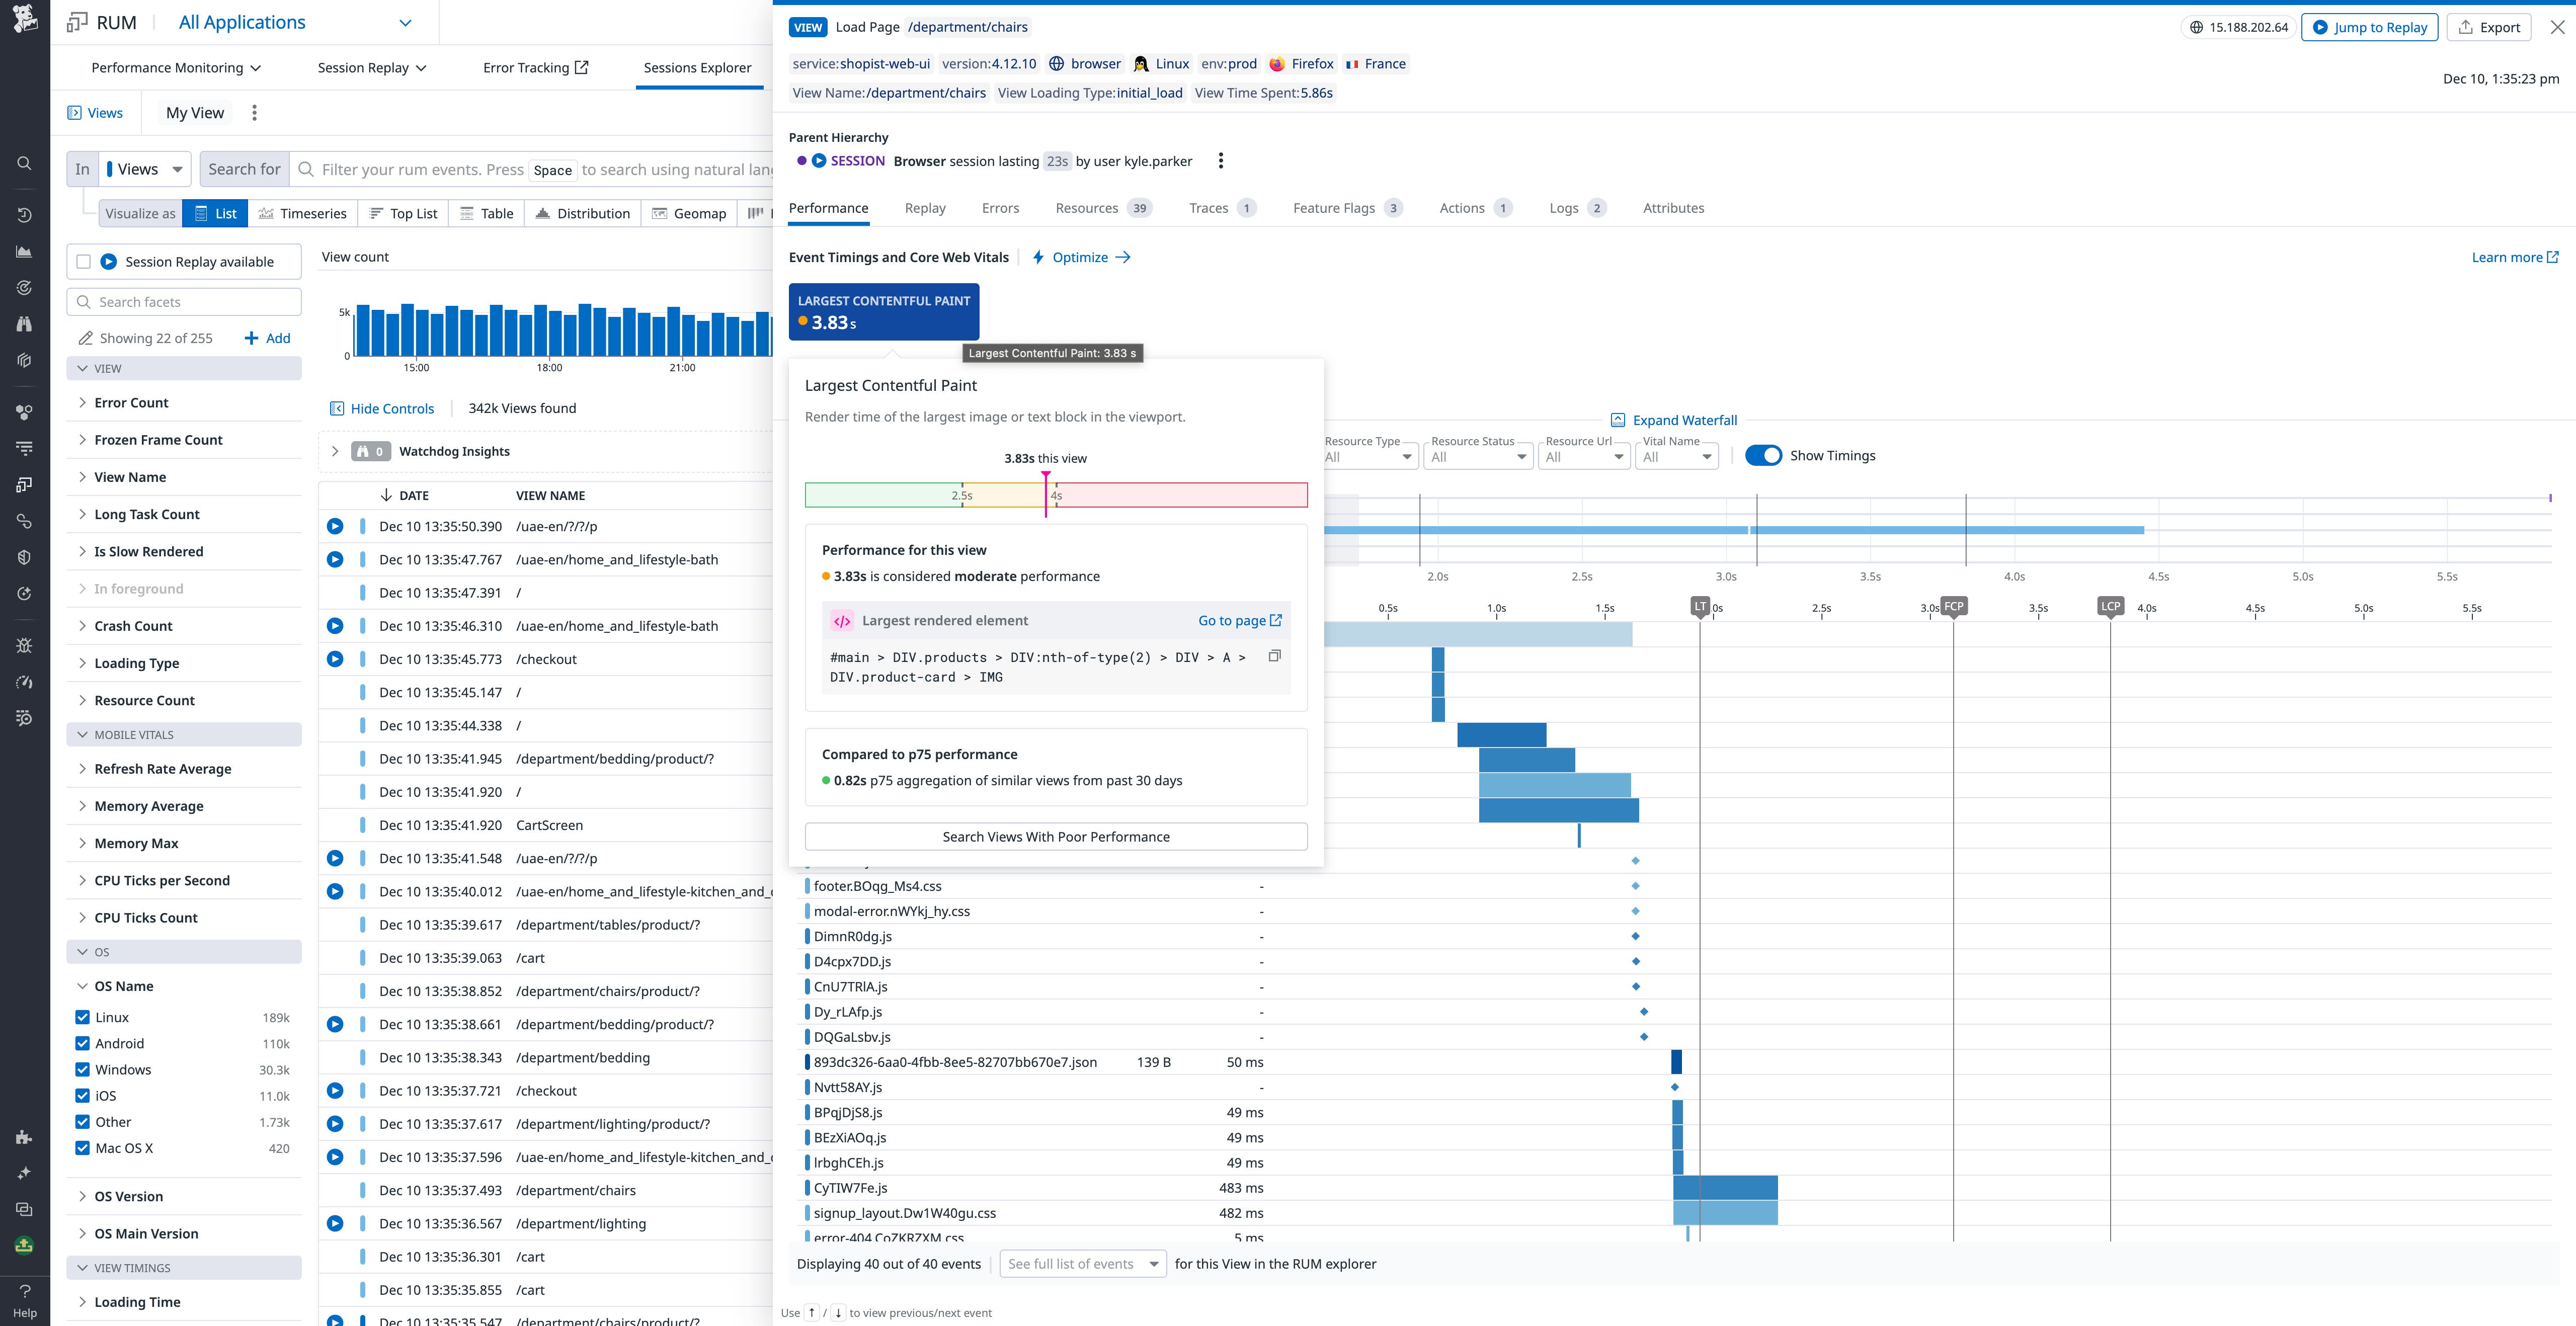
In the above example, we can observe that the Largest Contentful Paint is getting delayed by two very long image loads. You can improve image load time and, by extension, the LCP score by compressing the images or adopting an image CDN. The waterfall also shows a pair of long tasks—likely the deminification or parsing of Javascript or CSS files—run by the browser prior to the LCP. You will need to drill into this code to find optimizations to improve its runtime, such as code splitting. You can also reduce the blocking time of JavaScript and CSS with a minification plugin, such as optimize-css-assets-webpack. And because Datadog correlates RUM and APM data, you can seamlessly pivot from the waterfall to backend traces to identify backend issues that are contributing to the problem.
Monitor Core Web Vitals scores with Synthetic browser tests
While RUM enables teams to diagnose suboptimal Core Web Vitals scores that are affecting real users, Datadog Synthetic Monitoring allows you to create browser tests that can proactively validate Core Web Vitals scores before your users ever notice an issue. Browser tests can be run in any location and against any environment, including the CI/CD pipeline, so you can identify UX issues quickly and prevent them from happening again.
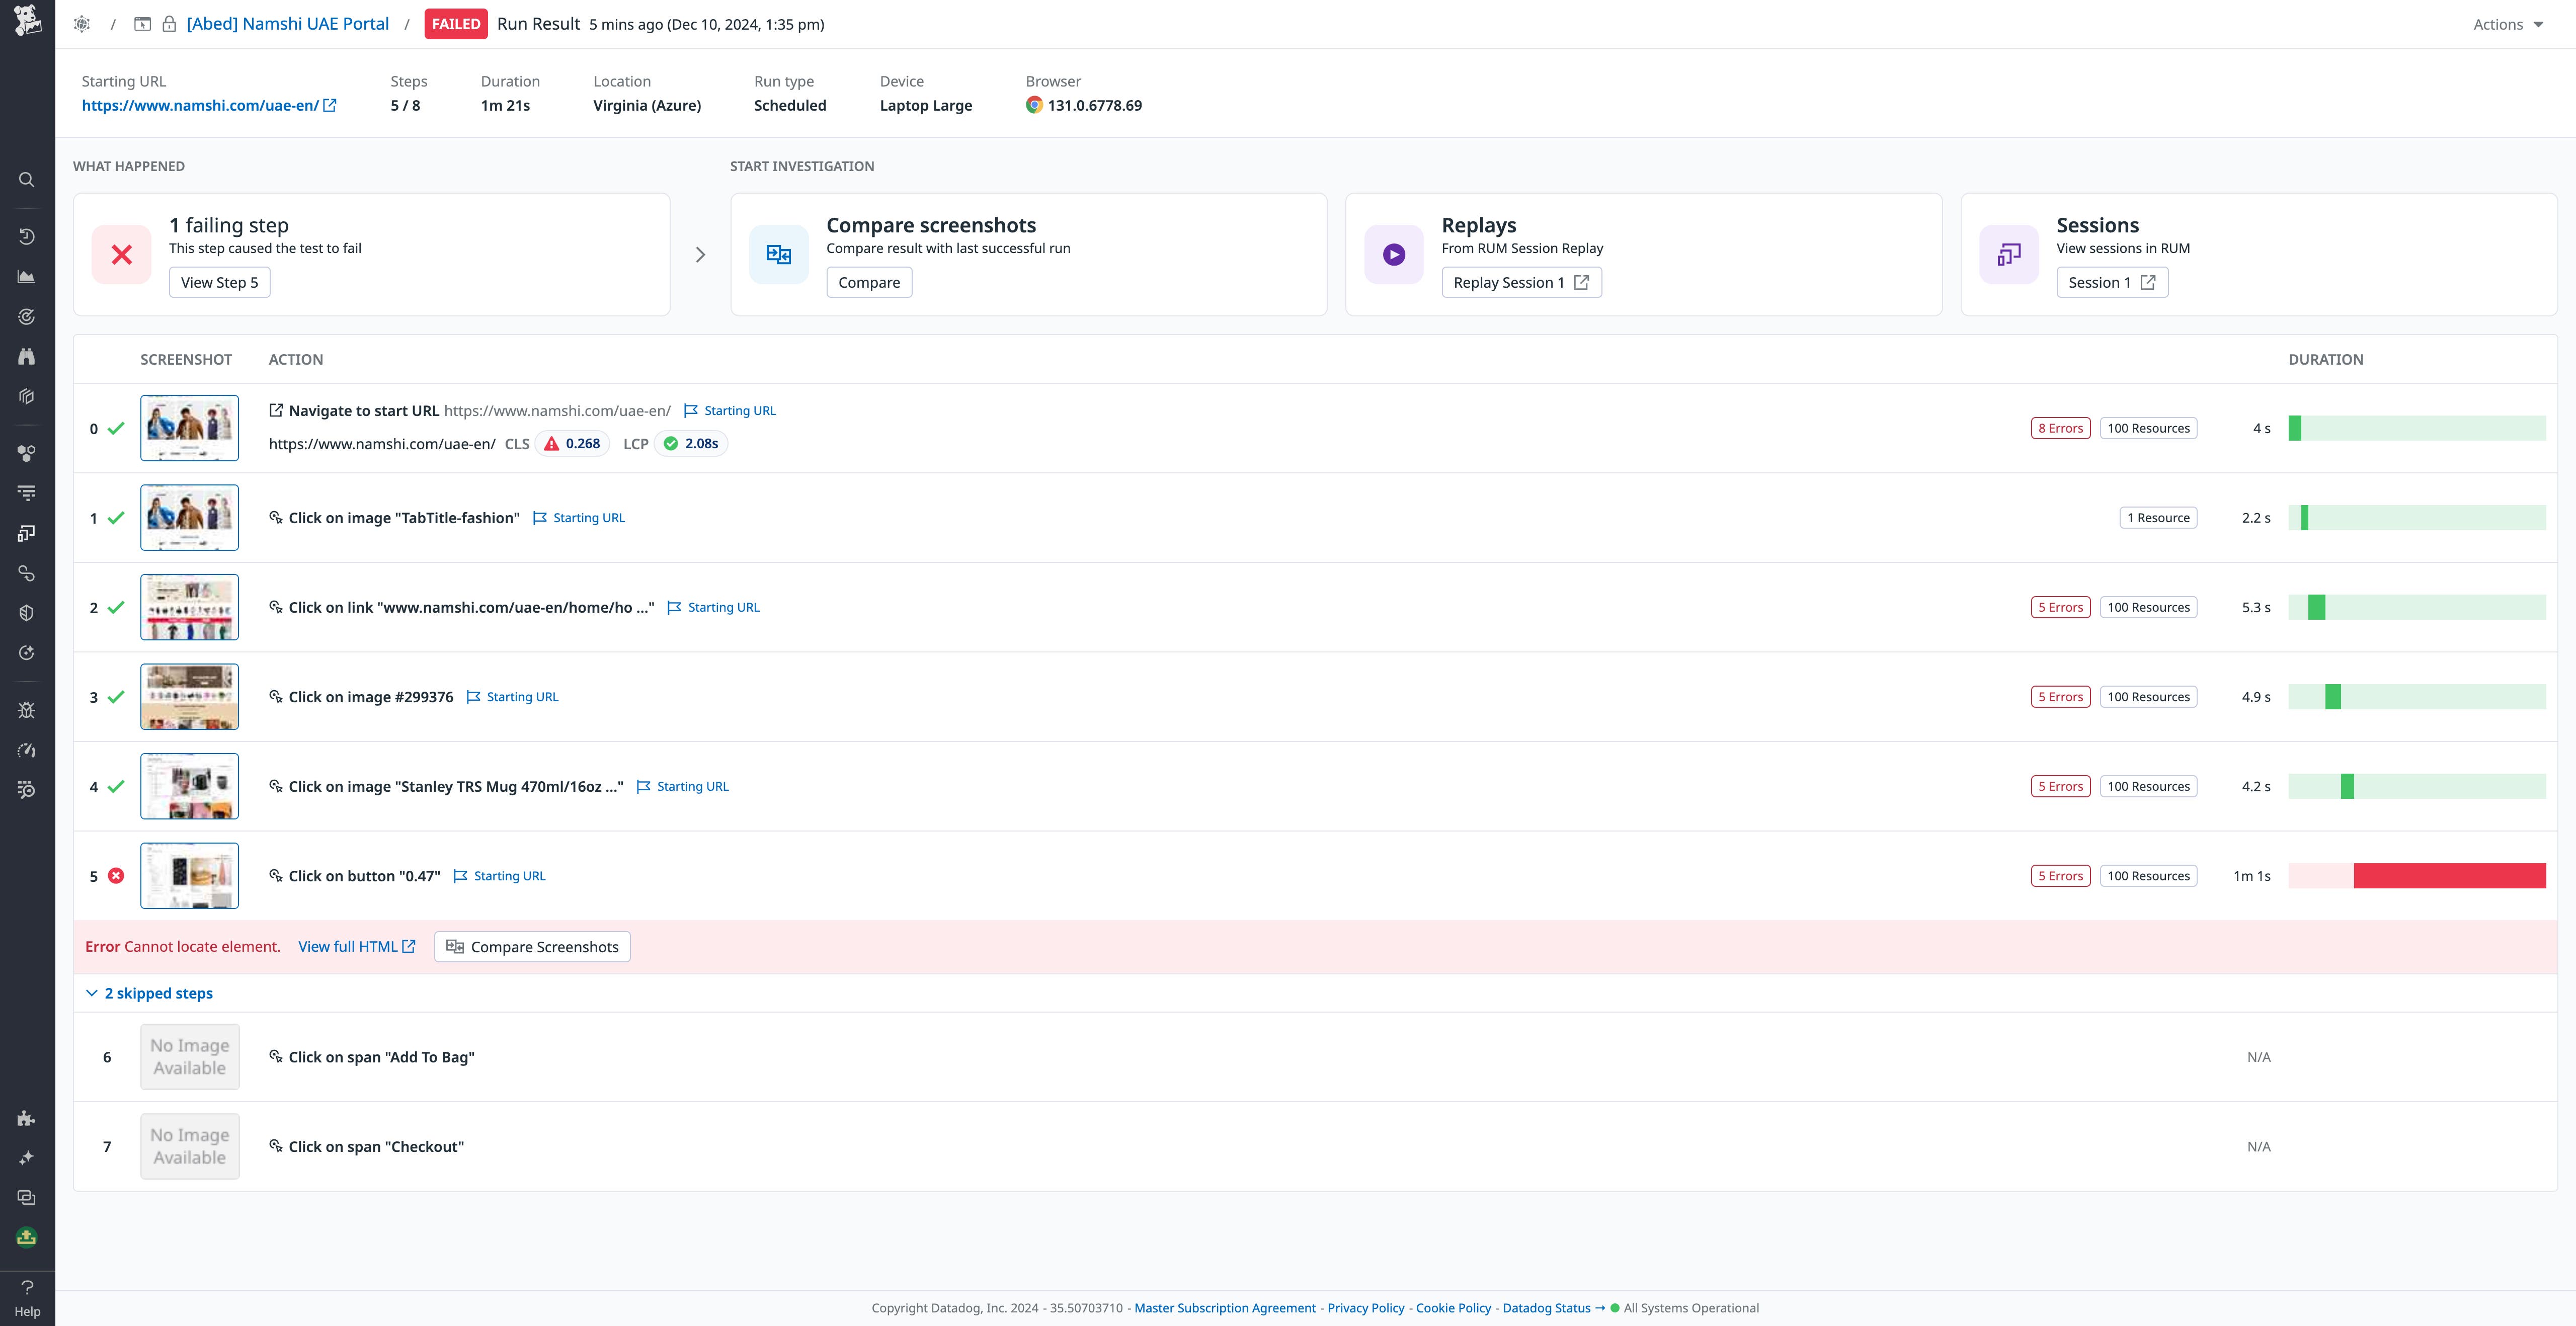
Each page load step in a browser test now includes lab Core Web Vitals metrics by default, with the color indicating where your scores stand in relation to Google’s acceptable performance thresholds. You can click on any step to view the details of any errors thrown, as well as a breakdown of each process invoked (CSS style sheet imports, API calls, or HTTP requests, for example) to investigate a suboptimal score.
Start monitoring your Core Web Vitals
The addition of Core Web Vitals scores to RUM and Datadog Synthetic Monitoring provides crucial insights into your application’s frontend performance, so you can maintain a seamless user experience and ensure that your site continues to rank well on Google. To learn more about monitoring Core Web Vitals, check out the documentation for RUM and Synthetic Monitoring. Or, if you’re brand new to Datadog, sign up for a 14-day free trial.
