
Nicholas Thomson

Anjali Thatte

Brittany Coppola
Container-native technologies increase the scalability and speed of deployment offered by containerized infrastructure, but they also present new monitoring challenges for organizations that adopt them. For example, because containers are ephemeral and share resources, tracking resource provisioning in container-native tools is essential to ensure consistent application performance. Additionally, as adoption of containerized infrastructure continues to increase, so will the use of container-native tools; as a result, organizations that lack holistic monitoring approaches for these technologies may be left with a growing number of blind spots across their stack.
Datadog’s growing suite of container-native technology integrations enables users to monitor their entire containerized infrastructure from one place. This single pane of glass helps teams ensure that applications run seamlessly and that they can maintain an exceptional end-user experience. These integrations cover the full scope of container-native tools, including workflow automation solutions like Temporal, container networking tools like Cilium and Calico, and many more.
In this post, we’ll explore how several integrations we have recently released or updated help you monitor key areas of your container ecosystem, including:
- Service meshes with Istio, Envoy, and Traefik
- Security and compliance with Kyverno
- Autoscaling and resource utilization with Karpenter
- Continuous integration and continuous delivery (CI/CD) with Flux and Argo technologies
- Messaging and streaming with Strimzi
However, our suite covers much more than these five tools. You can find a full list of our container-native integrations here.
Service meshes with Istio, Envoy, and Traefik
A service mesh is an infrastructure layer in microservice architectures that handles network traffic between services, independent of application code. Service meshes provide capabilities such as service discovery, load balancing, failure recovery, and authentication to help organizations address the challenges of managing services’ communication pathways, security, and observability at scale.
Istio is an open source service mesh that provides an efficient way to secure, connect, and monitor services without altering your application code. Istio’s control plane includes features such as TLS encryption; strong identity-based authentication and authorization; automatic load balancing for HTTP, gRPC, WebSocket, and TCP traffic; fine-grained control of traffic behavior with rich routing rules, retries, failovers, and fault injection; and automatic metrics, logs, and traces for all traffic within a cluster, including cluster ingress and egress.
The Istio dataplane is a set of Envoy proxies, which mediate and control all network communication between microservices. They also collect and report telemetry on all mesh traffic. In addition to Datadog’s standalone Istio integration, we have a designated integration to monitor Envoy as well. We recently updated this integration to collect additional telemetry, including metrics on role-based access control (RBAC) activity within your mesh, ensuring all of your service mesh telemetry is easily accessible in a single pane of glass.
Traefik Mesh is a lightweight service mesh designed to efficiently manage, secure, and monitor microservices without adding unnecessary complexity. It handles core traffic management features such as routing, load balancing for HTTP and TCP traffic, and automatic TLS encryption to secure communication between services.
Powered by Traefik Proxy, the Traefik Mesh dataplane manages all network traffic between microservices while gathering critical telemetry on performance and health. Datadog’s Traefik Mesh integration provides detailed insights into traffic flows, resource usage, and service health by monitoring key metrics such as open connections, request duration, and CPU or memory consumption in real time. These capabilities ensure that your services operate reliably and efficiently, while offering a unified view of your mesh’s performance across your containerized environment.
With Datadog, you can monitor every aspect of your containerized service mesh environment:
- Use logs to assess the health of Envoy, the Istio control plane, and Traefik Mesh
- Break down the performance of your service mesh with request, bandwidth, and resource consumption metrics
- Map network communication between containers, pods, and services over the mesh with Network Performance Monitoring
- Drill down into distributed traces for applications transacting over the mesh with APM
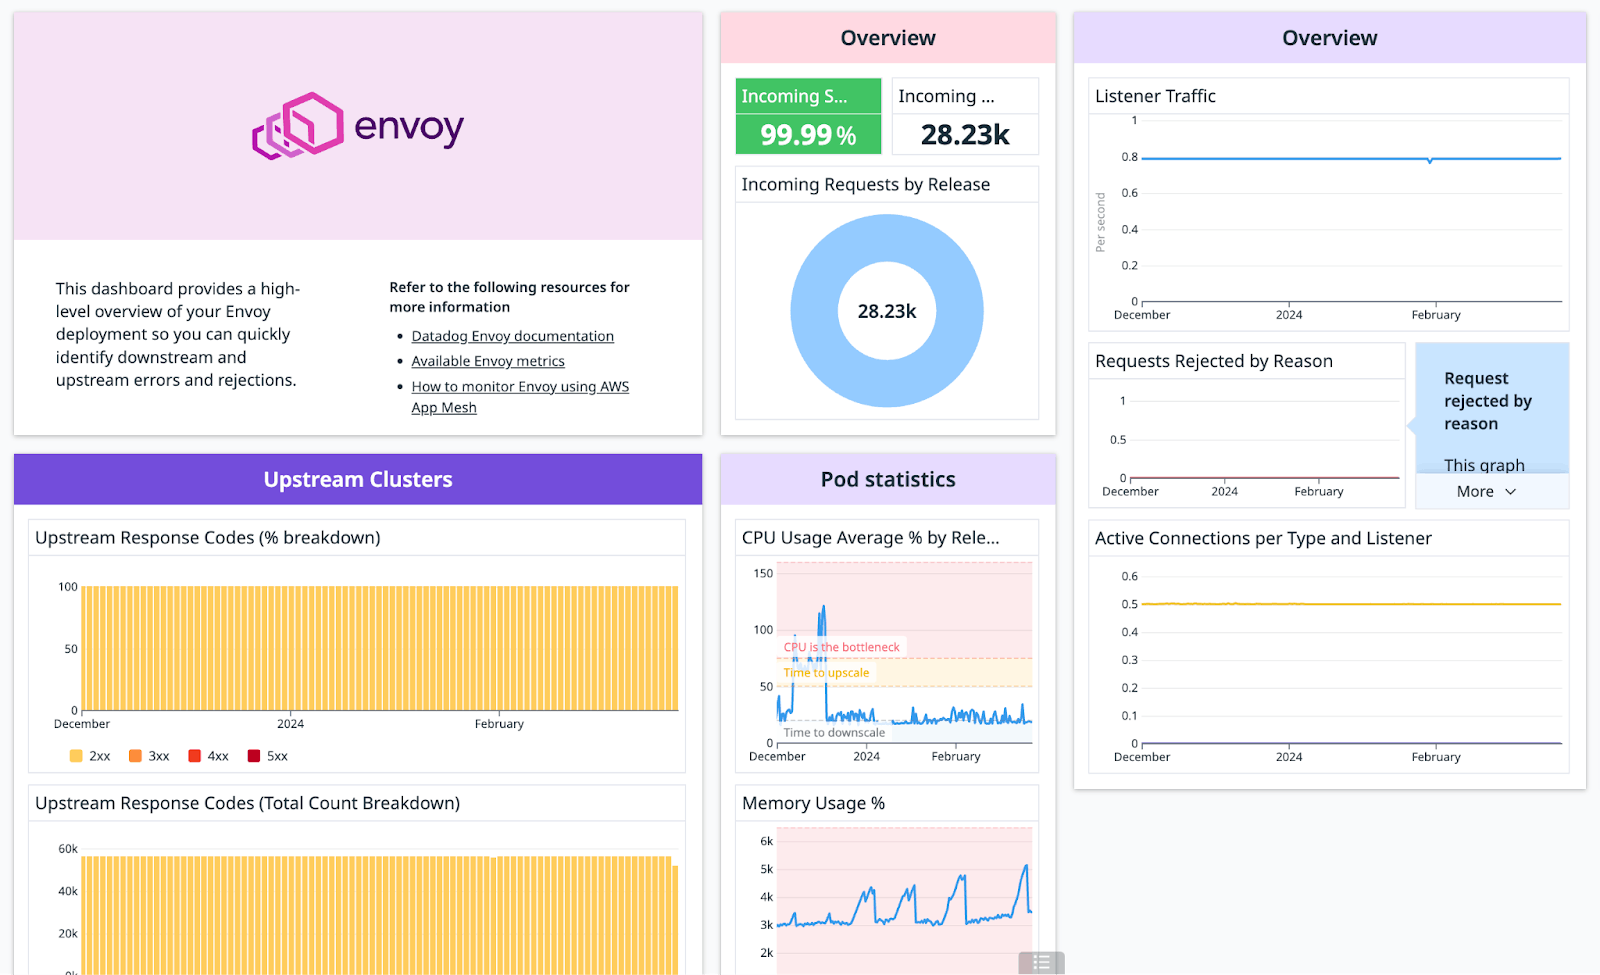
We’ve also updated our out-of-the-box Envoy and Traefik dashboards to provide a high-level view of your key service mesh metrics—such as incoming requests, listener traffic, CPU and memory usage, and more—so you can evaluate the health and performance of your service mesh environment at a glance.
Security and compliance with Kyverno
As Kubernetes environments scale, managing configuration drift, security policies, and resource compliance becomes increasingly complex. Ensuring Kubernetes resources meet organizational standards and security requirements, while avoiding misconfigurations that can cause vulnerabilities or downtime, is challenging for teams operating in dynamic, containerized environments. Without the right tools, maintaining consistency and enforcing policies across clusters can quickly become a bottleneck.
Kyverno is a Kubernetes-native policy management tool designed to automate policy enforcement, validate configurations, and manage resource generation and mutation. By enabling teams to define and enforce security and governance policies directly within Kubernetes, Kyverno helps ensure that clusters remain compliant with best practices while minimizing the operational overhead of manual monitoring and corrections.
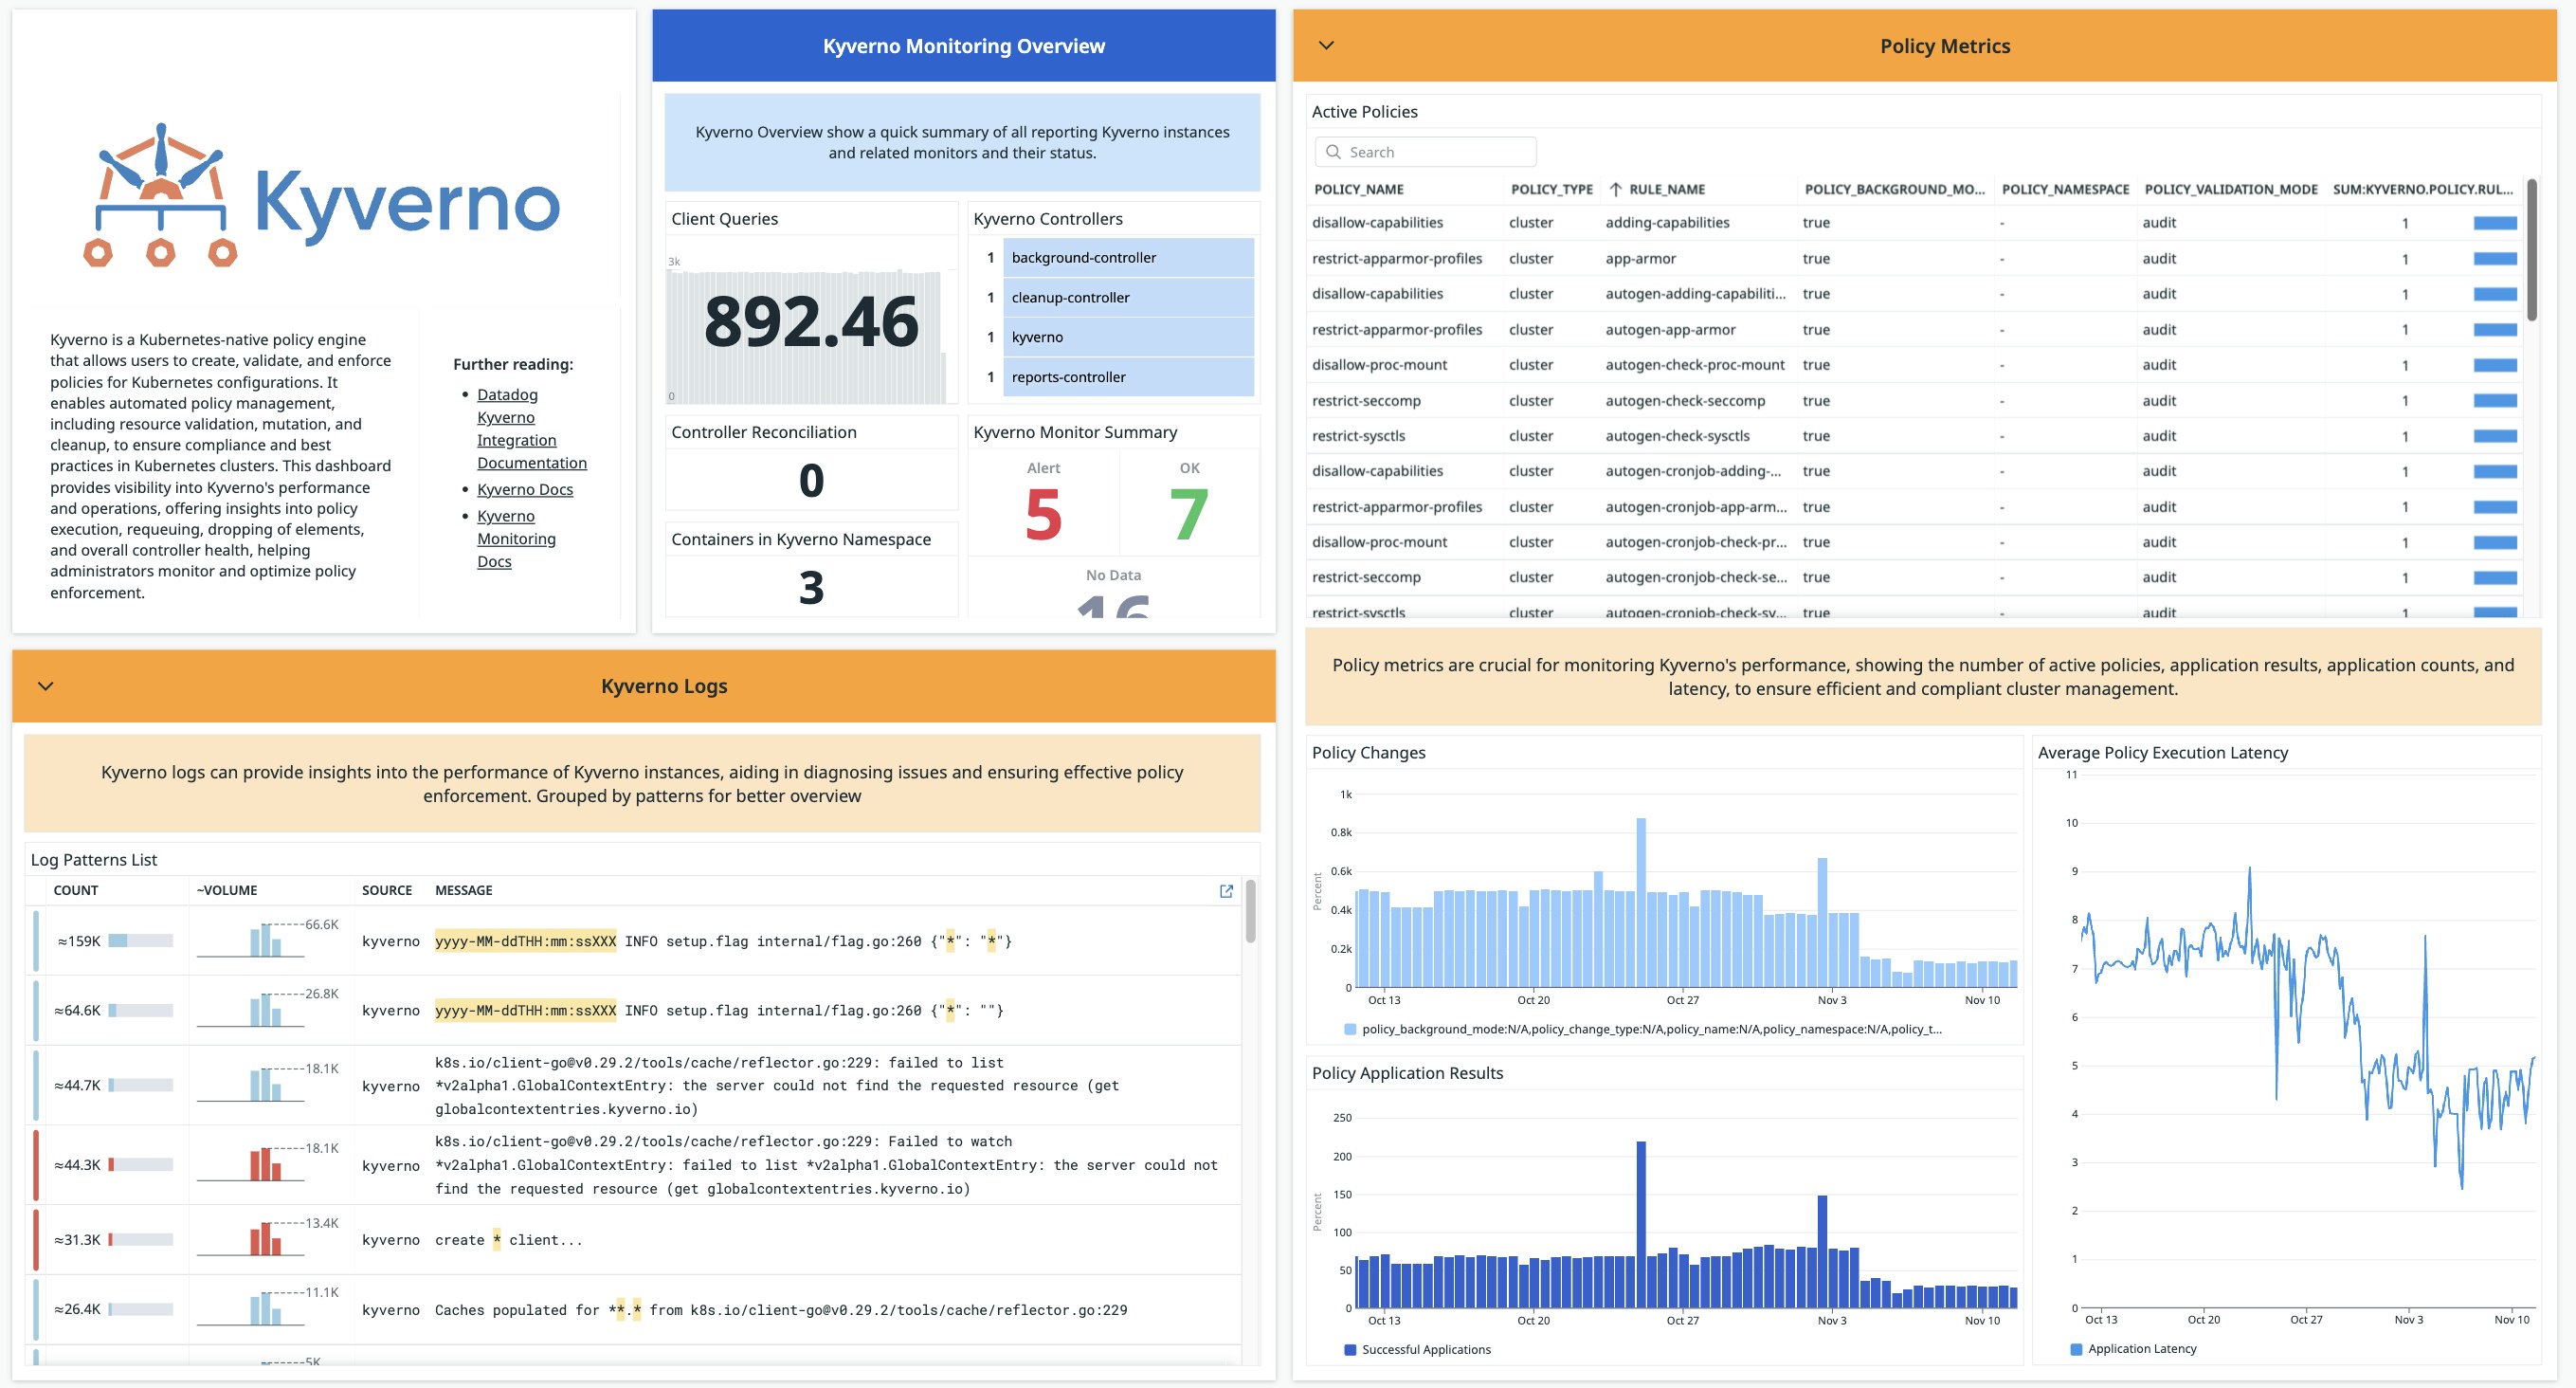
Datadog’s Kyverno integration provides comprehensive, real-time visibility into policy enforcement and system performance. With this integration, teams can track key metrics like policy execution times, admission requests, errors, and resource usage — including memory and CPU consumption. These insights allow organizations to proactively detect configuration issues, optimize resource usage, and ensure consistent policy enforcement across large-scale Kubernetes environments. Whether you are monitoring policy changes or troubleshooting reconciliation processes, Datadog’s Kyverno integration ensures you have the data needed to maintain compliance and operational efficiency.
Autoscaling and resource utilization with Karpenter
Flexibly allocating resources based on the demands of a growing customer base requires the ability to scale your infrastructure seamlessly. Container-native autoscaling and resource provisioning technologies help teams ensure that their containerized environments are consuming CPU and memory efficiently, so they can reduce waste and optimize allocation of computing resources.
Karpenter is a provisioning solution for Kubernetes that enables users to automate infrastructure scaling based on the changing resource requirements of their containerized workloads. Datadog’s Karpenter integration allows joint users to track resource consumption by pod, cluster, and component, helping them improve resource efficiency in their Kubernetes cluster.
The out-of-the-box dashboard provides a high-level overview of the health of your cluster, including nodes, pods, and resource requests, enabling you to fine-tune your resource allocation according to the particular needs of your application. For instance, if you notice a spike in CPU requests across your pods, you can pivot to Karpenter to quickly provision the node hosting these pods with additional CPU resources and avoid any performance issues that might arise from underprovisioning.
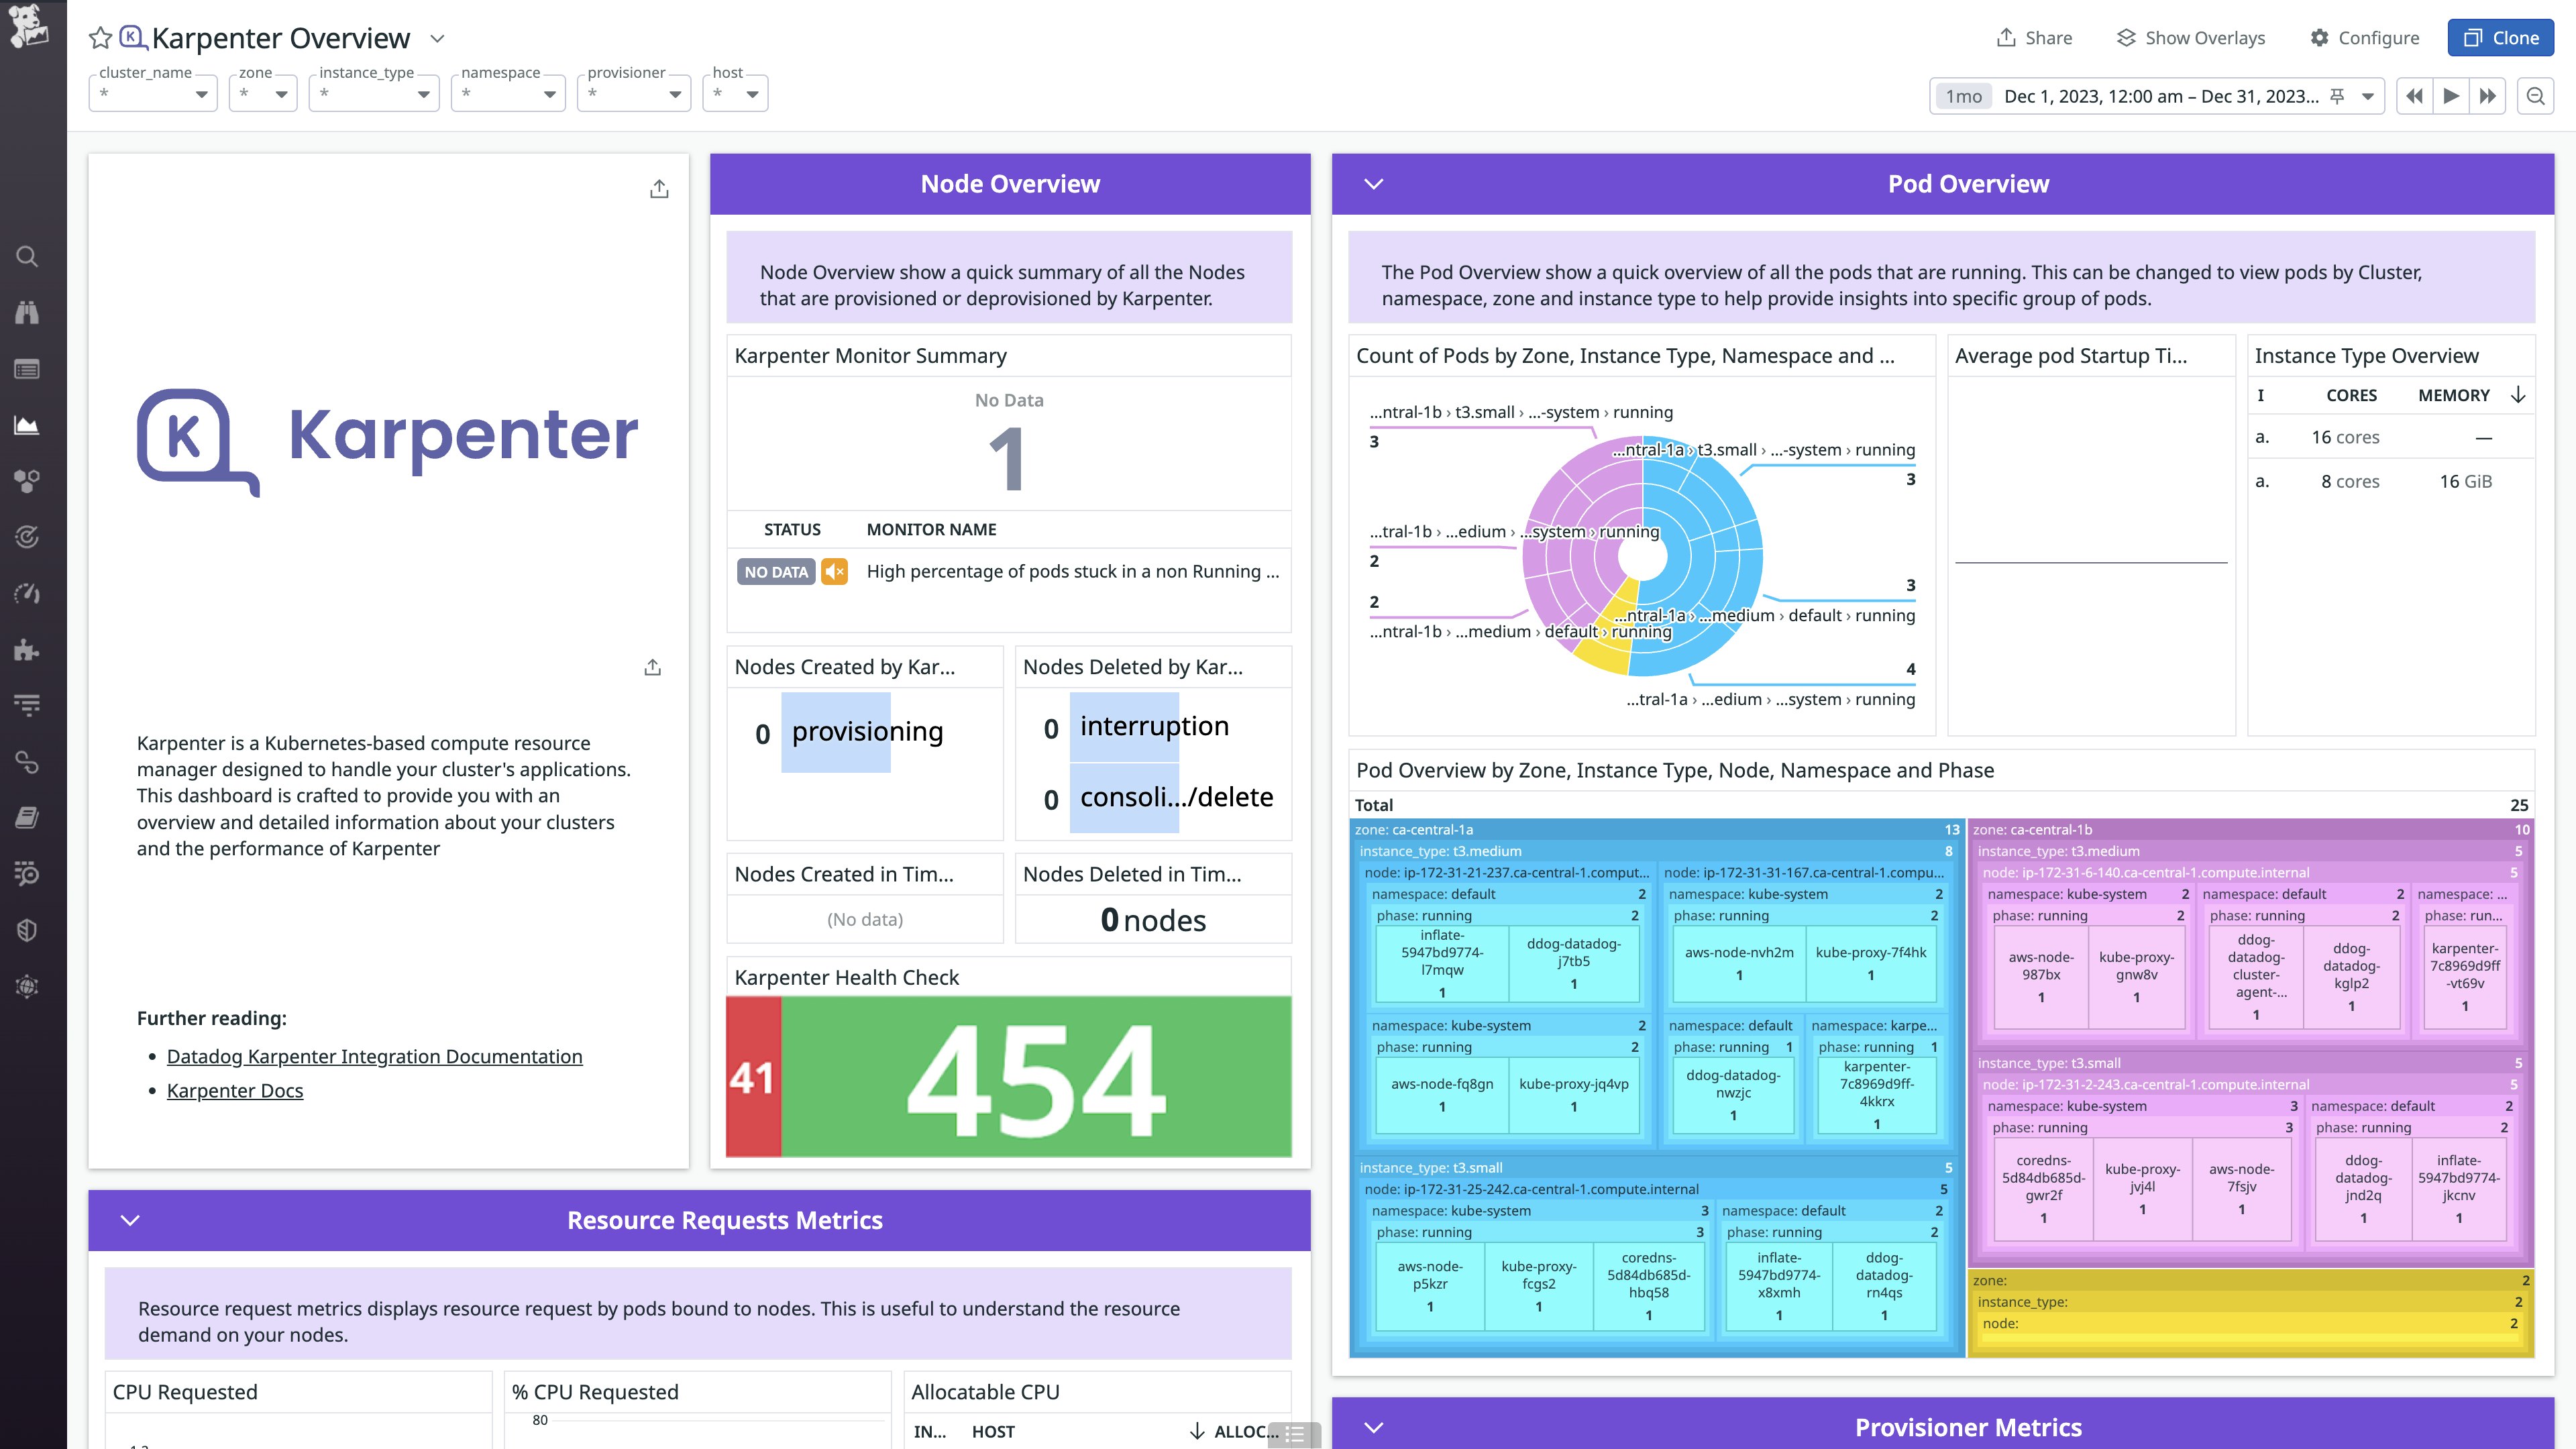
The dashboard also provides a spatial representation of pod evolution, grouped by lifecycle phase, zone, capacity type, and more, helping users understand their cluster architecture. Furthermore, users can analyze the frequency and latency of their Karpenter provisioner’s actions and alert on a high number of pods stuck in unsuccessful states. With this data, users can make informed decisions on how to optimize their provisioning constraints.
Software delivery automation with CI/CD tools Flux, Argo, and Tekton
CI/CD tools enable teams to automate the building, testing, and deployment of containerized applications by ensuring that code changes are reliable and seamless. CI/CD pipelines can help establish a rapid development and release cycle, which allows teams to stay agile, adjust to a rapidly changing marketplace, and deliver consistent value to end users.
Flux is a set of CI/CD solutions for Kubernetes, including feature flags, A/B rollouts, and automated container image updates. Flux utilizes a GitOps toolkit to help ensure that your system is version-controlled and matches the desired state in your Git repository. Datadog’s Flux integration surfaces performance metrics related to the health of these Kubernetes-specific delivery solutions.
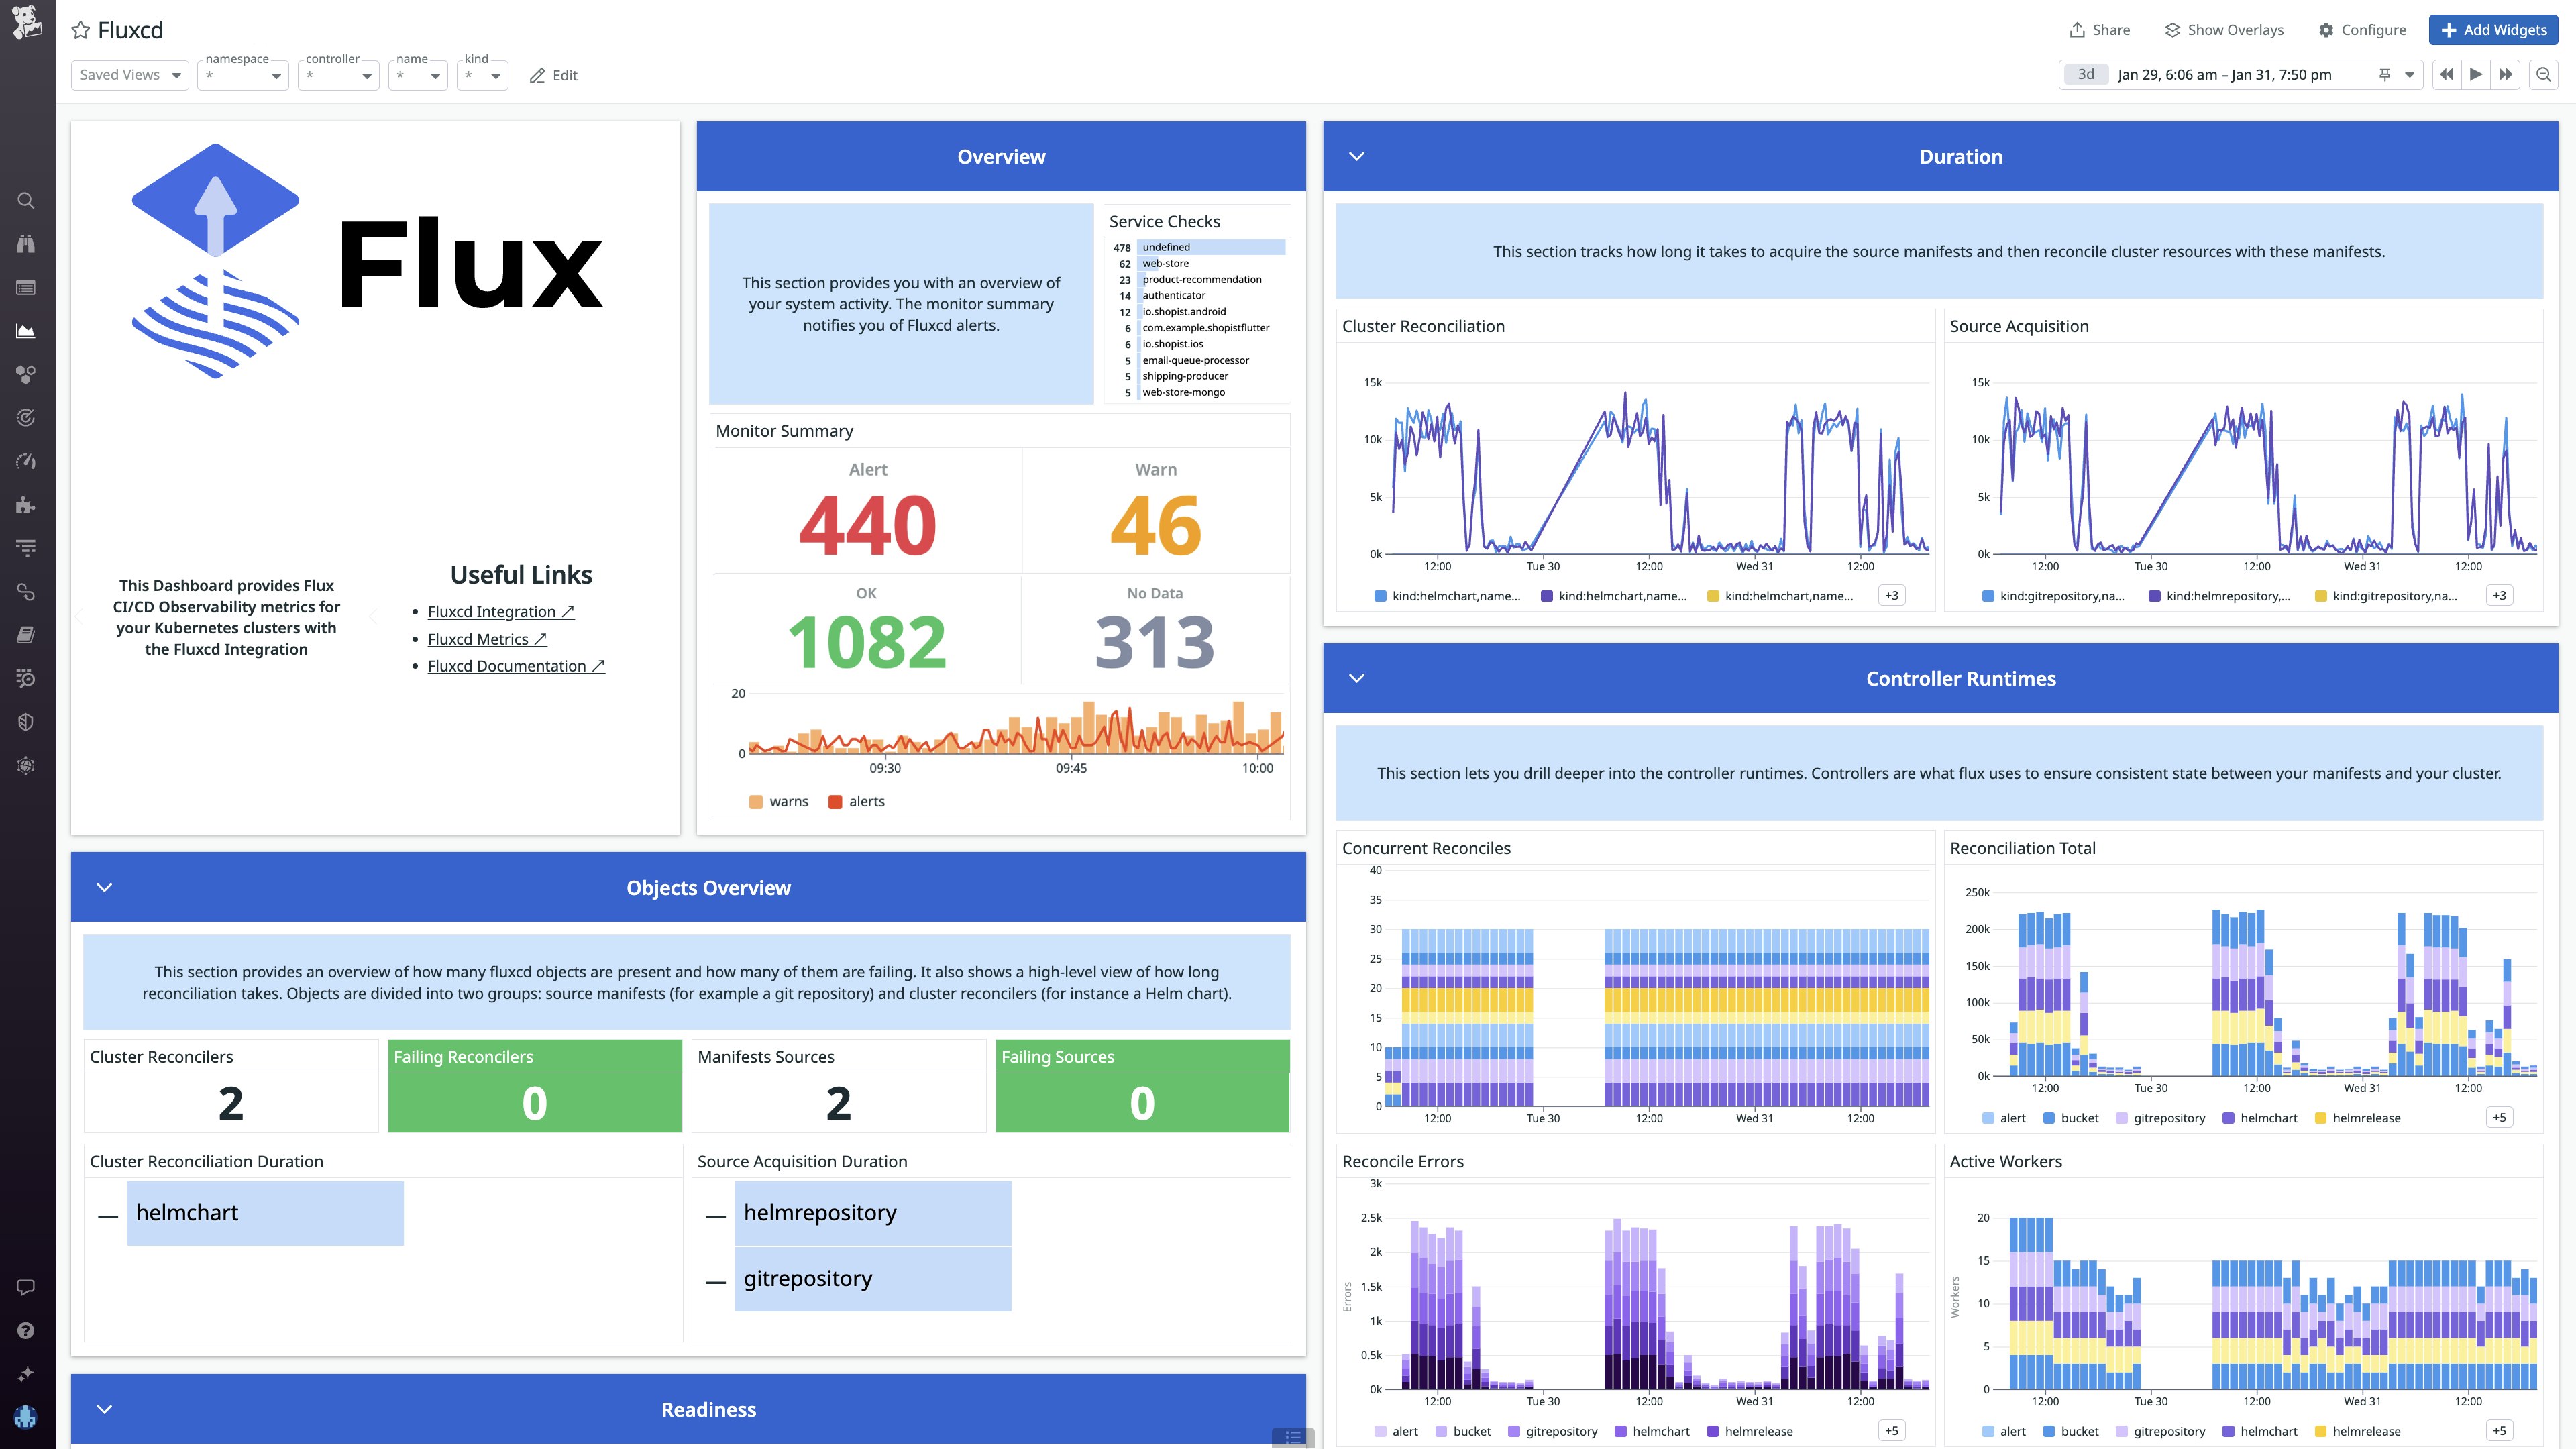
With this integration, joint Datadog and Flux customers can monitor the health of their CI/CD systems. For instance, a DevOps engineer can easily surface metrics like the number of currently used workers per controller, process duration, and status of a GitOps Toolkit resource. They can use this data to troubleshoot a failing CI/CD pipeline by, for instance, restarting a GitOps Toolkit resource that was suspended and thus enabling the code deployment to be pushed to production.
Datadog also integrates with Argo CD—a CD tool for Kubernetes that ensures that your Kubernetes clusters are up to date with your latest manifest files. This integration enables users to monitor how quickly and accurately Argo CD is applying changes to their clusters along with the statuses and performance of their continuous delivery pipelines, ensuring swifter, safer deployments, and thus an application that can adapt to the rapidly evolving needs of end users.
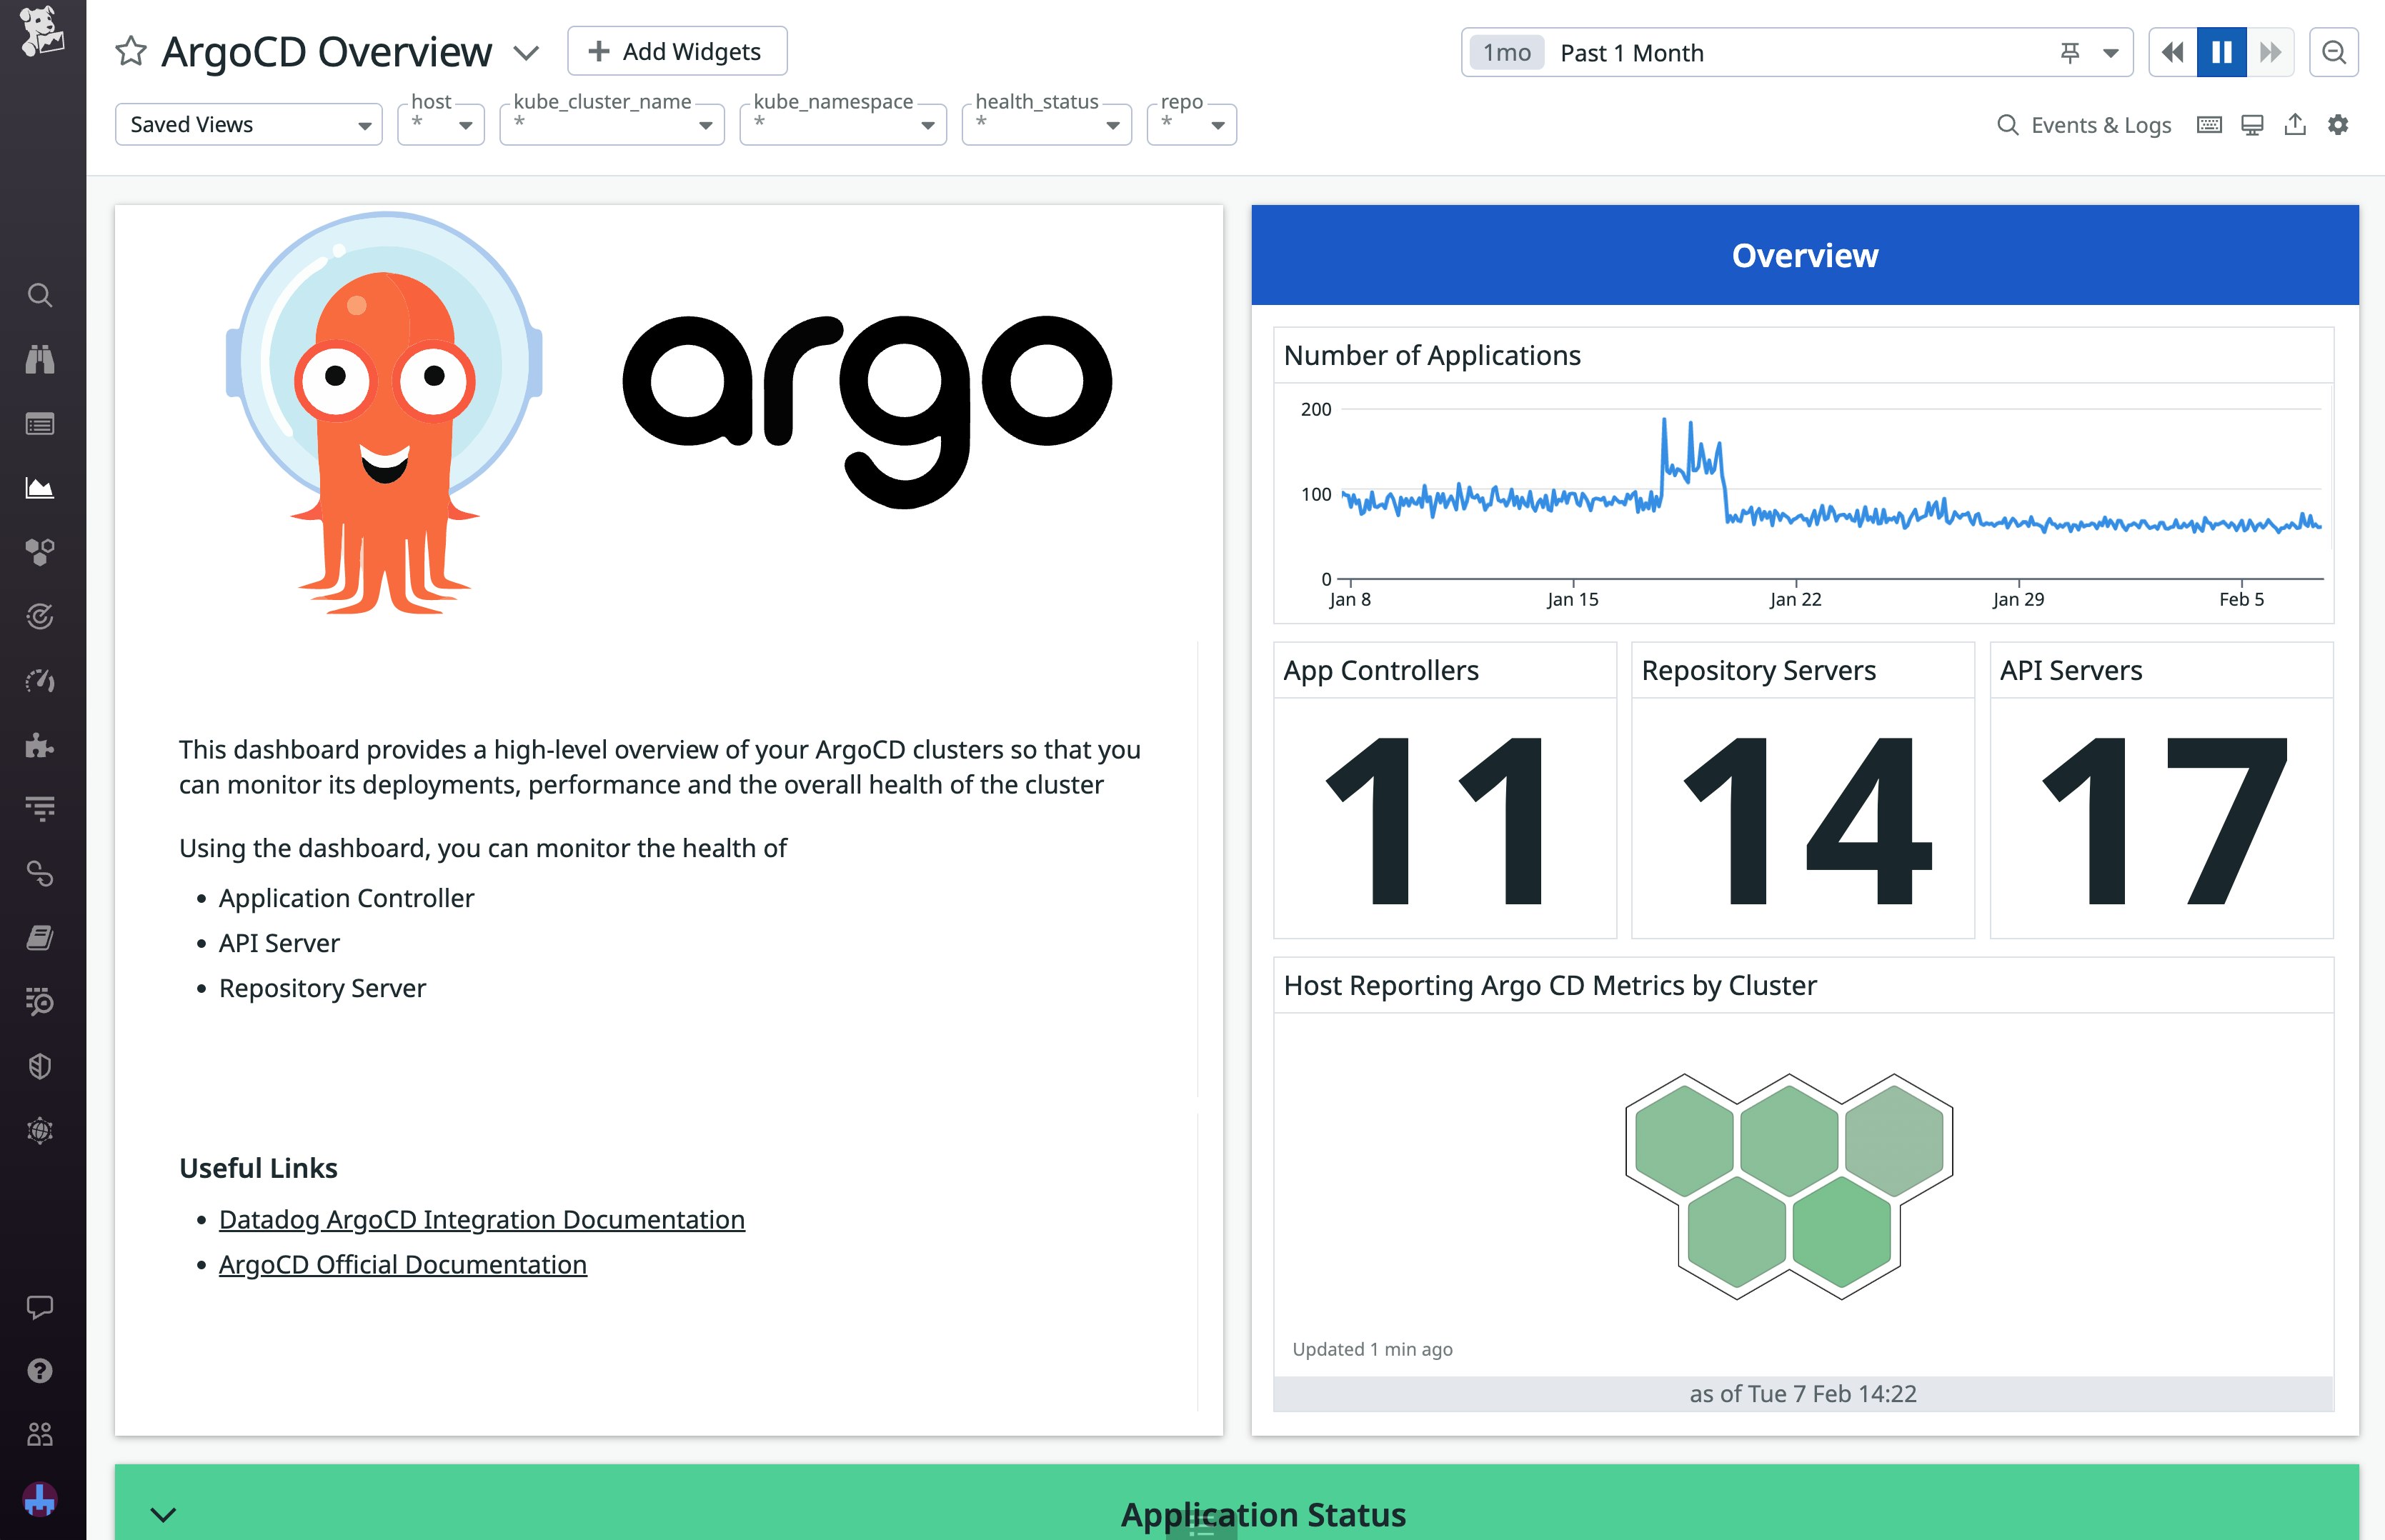
Additionally, Datadog integrates with Argo Workflows—which allows users to track workflow execution based on operation durations to ensure timely completion of workflows and proactively identify delays—and Argo Rollouts—which enables users to track the progress of their ongoing rollouts to avoid prolonged downtimes and service disruptions. Finally, Datadog also integrates with Tekton, enabling users to track pipeline execution latency to ensure that their pipelines are running within acceptable time frames.
Messaging and streaming with Strimzi
Messaging platforms facilitate communication between microservices and support event-driven architectures by enabling the asynchronous exchange of data.
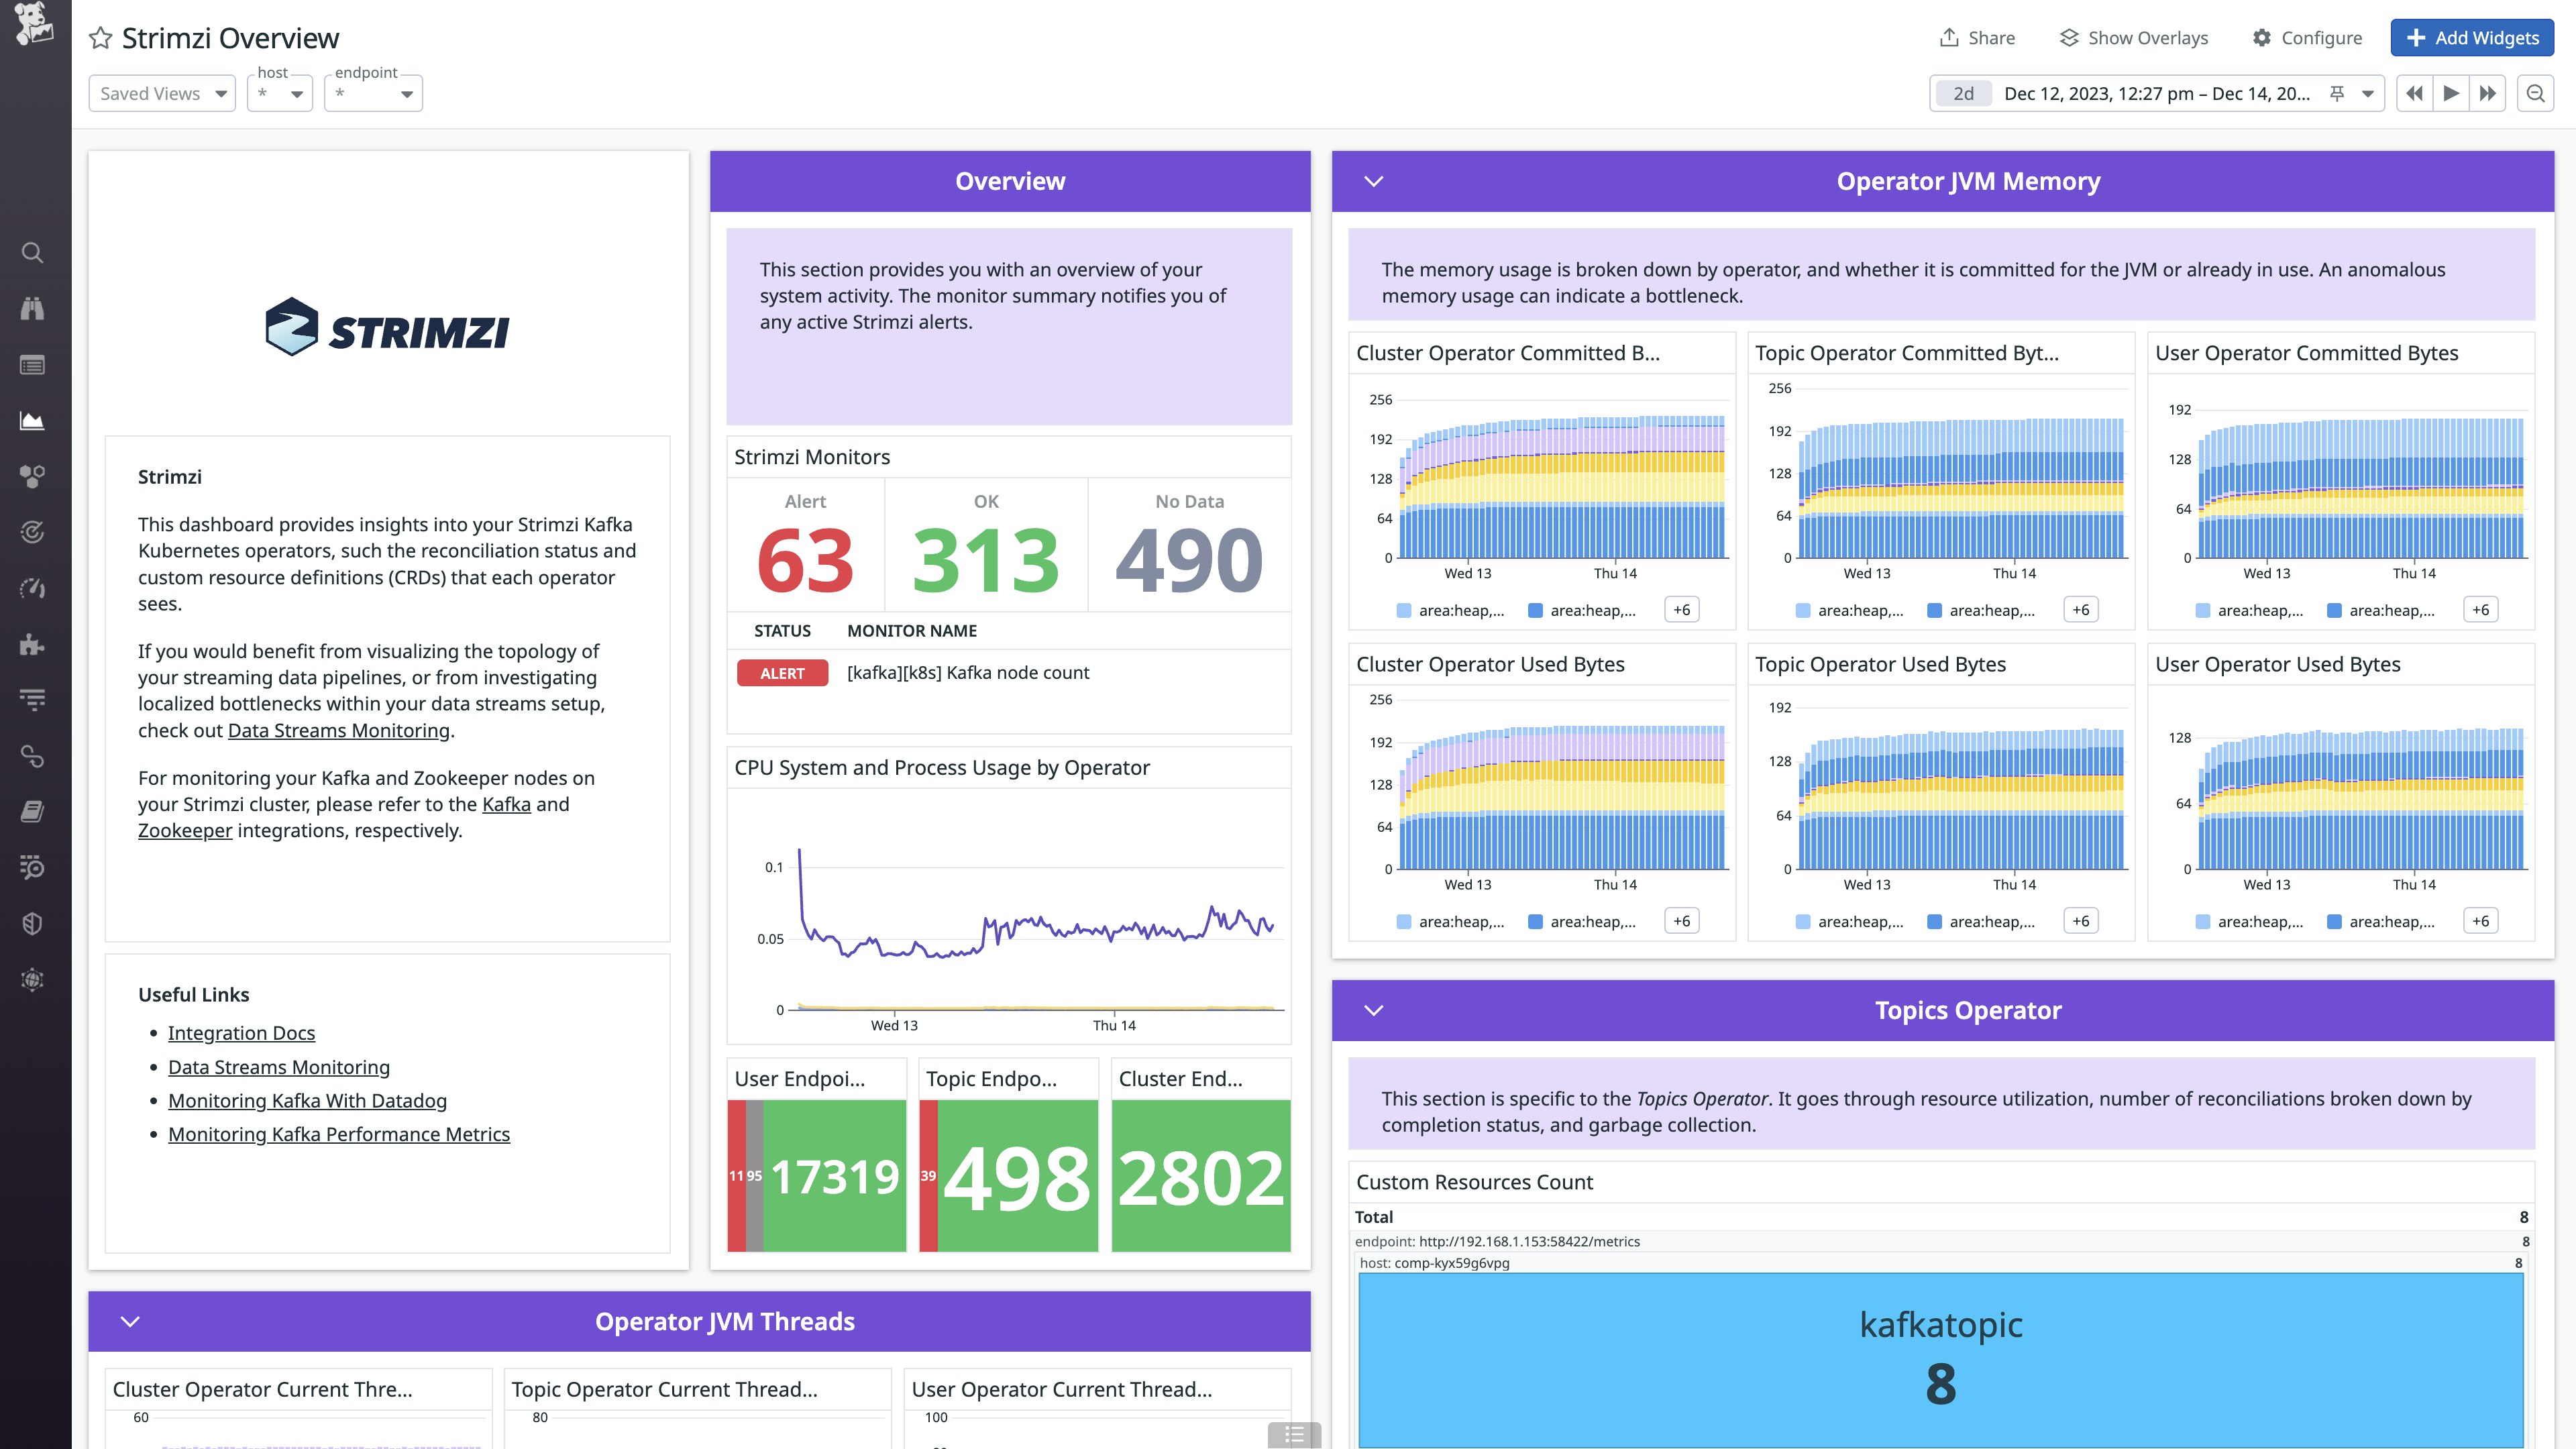
Strimzi is an open source project that simplifies the process of configuring, customizing, and running Kafka on Kubernetes by managing Kafka clusters as custom resources. Datadog’s Strimzi integration collects metrics on operations and health sliced by Cluster, Topic, and User operators.
Users can manage uneven system load distribution by tracking activity and resource consumption at the Topic level. These insights are useful in improving streaming efficiency from producer through to consumer. Furthermore, users can monitor reconciliations by successful, failed, and locked status to troubleshoot operator access issues, minimize misconfiguration risks, and detect unauthorized access. Finally, users can also visualize resource, reconciliation, and thread count by operator level within our out-of-the-box dashboard. These visualizations help you quickly understand ongoing activity at each stage of the data streaming pipeline within your Strimzi framework.
Monitor all your container-native integrations with Datadog
The field of container-native technology is constantly evolving, offering a growing wealth of capabilities and tools to developers. This expanding field means that you need to adapt your monitoring strategy to gain complete visibility into your tech stack and stay ahead of any issues that may arise in any component of your distributed, microservice architecture.
With a full suite of container-native integrations, Datadog provides insight into every layer of your container-based technology stack.
| Category | Existing Integrations |
|---|---|
| Service Meshes and Proxies | Istio, Envoy, Linkerd, Consul, RedHat, OpenShift, Traefik |
| Cost and Resource Utilization | Karpenter, Kubernetes Autoscaler |
| CI/CD | Argo CD, Argo Workflows, Argo Rollouts, Flux, Tekton |
| Container Security | Harbor, Kyverno, Twistlock * |
| Networking Solutions | Cilium, Calico |
| Messaging and Event Brokers | Strimzi |
| DB and Storage Solutions | Scylla, Portworx * |
*These integrations are authored by community members and can be found in the Datadog Marketplace
Check out the documentation links above to get started using these integrations so you can holistically monitor your container ecosystem. If you’re new to Datadog, sign up for a 14-day free trial.


