Bowen Chen
CI pipelines have become an integral part of the development workflow, helping teams automate the continuous building and testing of new updates to application code. The growing importance of CI pipelines has naturally led to a need for increased visibility into their performance. In 2021, Datadog introduced CI Visibility to deliver granular performance metrics for each individual pipeline, allowing you to monitor build duration and related telemetry across all recent commits. However, the high frequency of commits and the complexity of CI deployments in modern applications make it difficult to keep a constant eye on the health of your pipelines.
We’re now excited to announce Datadog CI pipeline monitors, which enable you to set alerts on key performance metrics for your pipelines. Using pipeline monitors, you’ll be notified whenever pipeline performance degrades in a predefined manner, for example, when builds extend beyond an acceptable duration or fail at an unacceptable rate. In this post, we’ll explore how CI pipeline monitors can benefit your workflow by providing granular alerts across all pipelines and stages and diagnostic insights into degrading pipelines.
Granular alerts across all pipelines and stages
Pipelines are divided into different stages (depending on your CI provider), each with its own set of jobs. A single error in any of these components could break a build, so to effectively monitor your pipeline, you need visibility at each stage. End-to-end visibility is especially needed when your team is introducing a new feature or version update, or whenever a broken pipeline could negatively impact large numbers of customers.
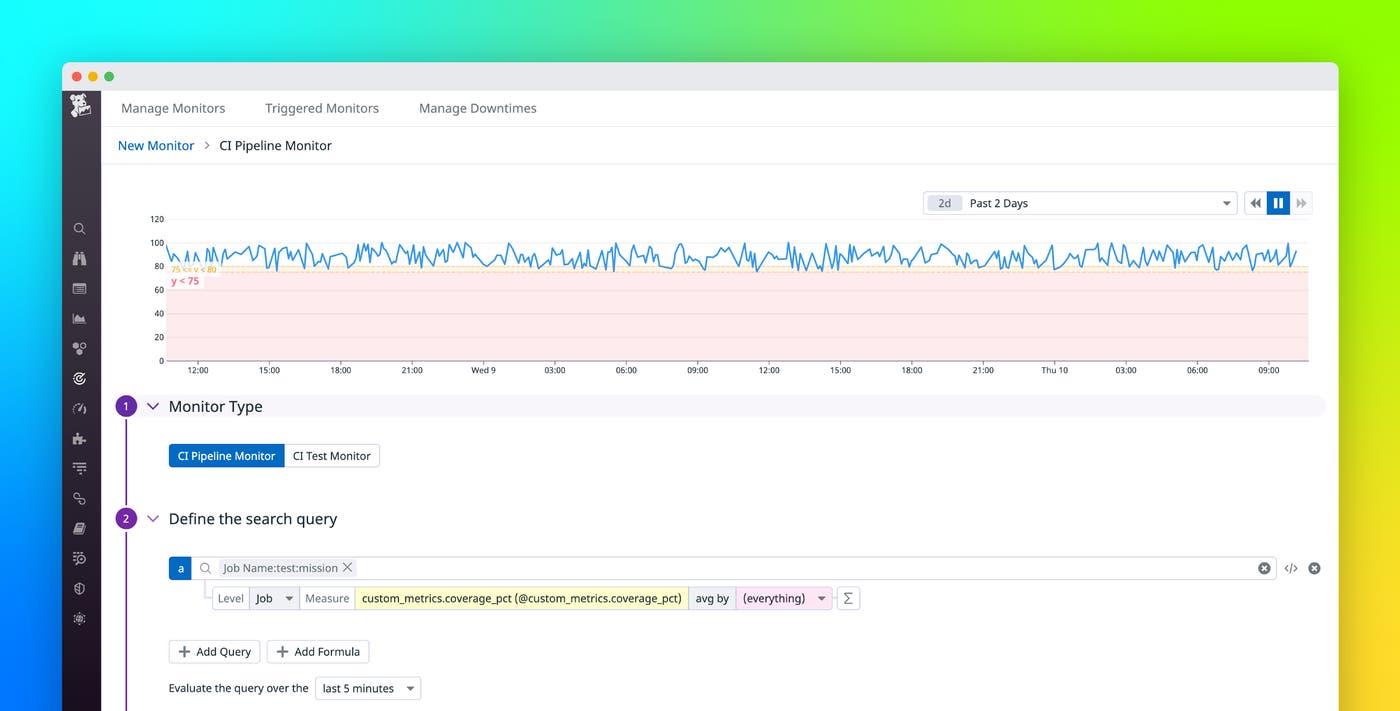
With CI pipeline monitors, you can configure separate alerts for all pipelines, stages, jobs, and commands to help you pinpoint the source of bottlenecks and failures more easily. Alongside standard facets (such as errors, duration, and count), you can create monitor queries specific to your project or team by attaching custom tags and metrics to your pipeline traces. For example, assigning a custom team name tag enables you to configure alerts that apply only to the pipelines your team is responsible for. This creates a quick and simple process to filter your monitor evaluations and keep relevant monitors top of mind. On the other hand, alerting on trends in custom metrics such as code coverage percentage (shown below) ensures that application code for each commit is thoroughly covered by your test suite before it gets deployed to your production environment.
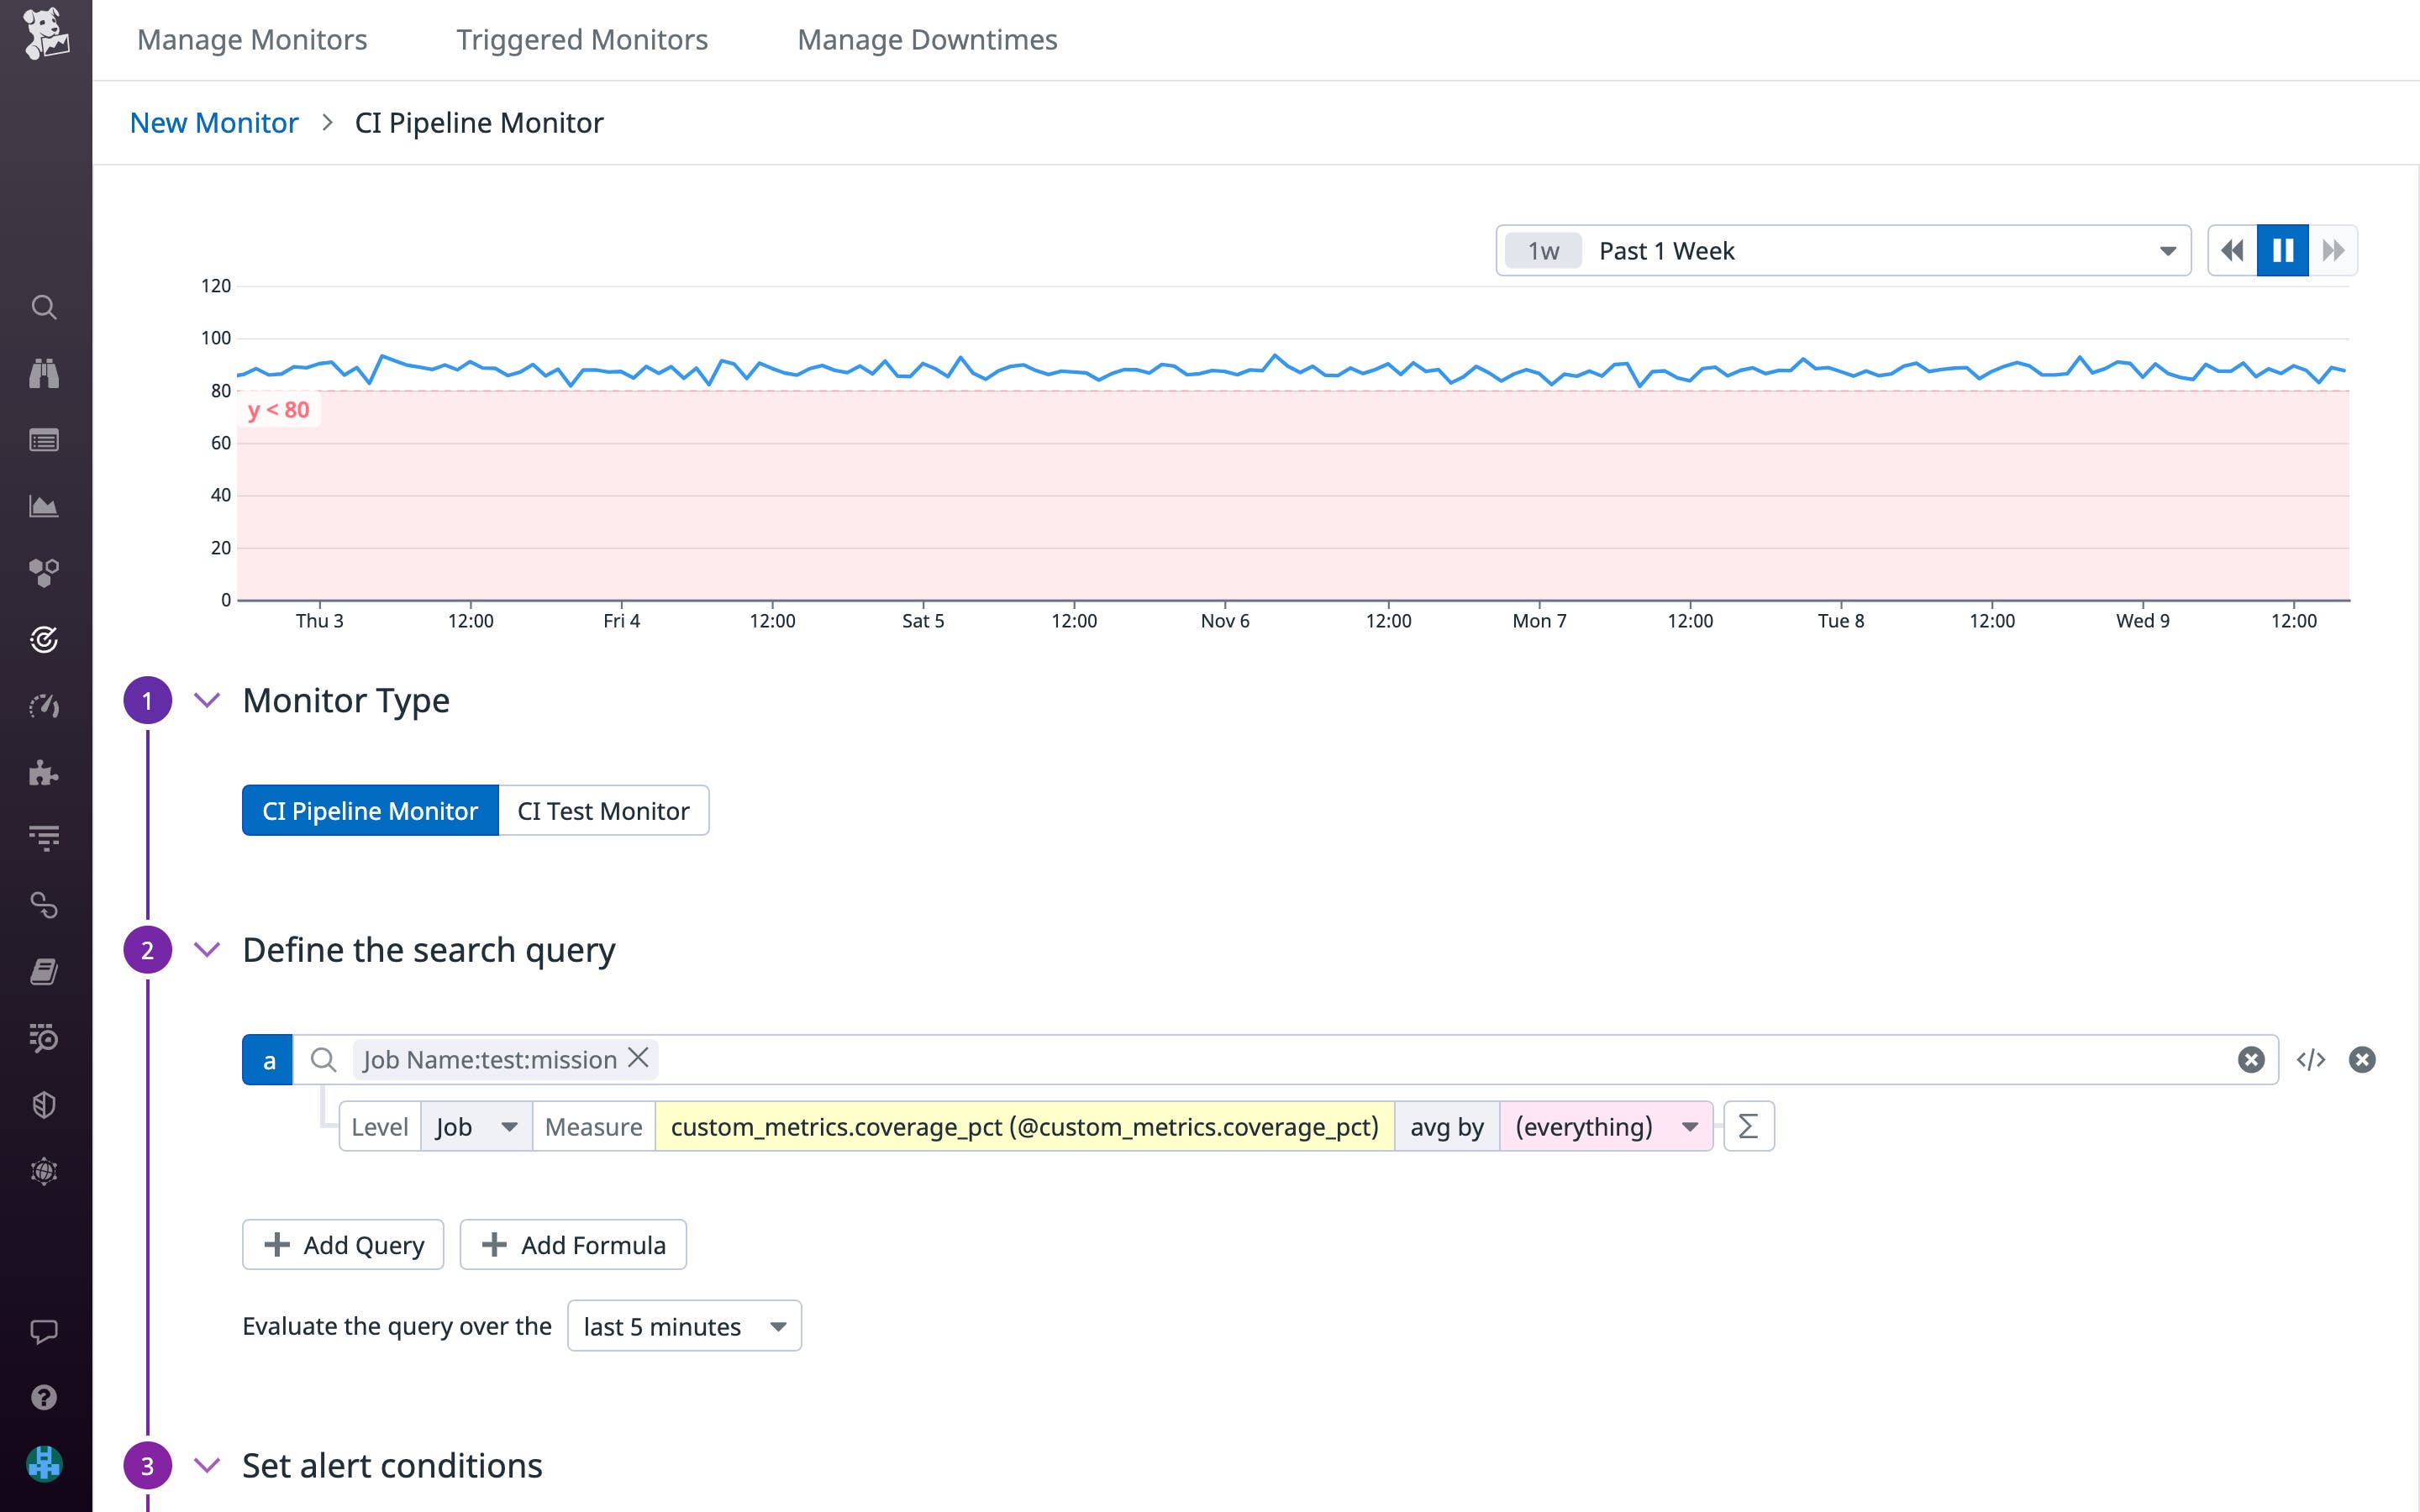
With modern CI tooling, engineers regularly merge new application code to the same pipeline several times a day; however, the high frequency of code deployments also presents a greater risk of build failures and other pipeline issues. By using Datadog’s pipeline monitors to set granular alerts for specific pipelines, stages, and jobs, you can quickly resolve broken pipelines by having your team immediately notified when problems occur and where they’re occurring. Receiving prompt notifications about pipeline issues enables you to respond to them at once and then return to deploying code with minimal delay, reducing the risk of lengthy interruptions.
Diagnostic insights into degrading pipelines
When your pipeline breaks, it’s important to quickly identify what broke it and how you can prevent it from happening again. By inspecting traces of your pipeline executions in Datadog CI Visibility, you can begin to identify the root cause of your issue, and then configure alerts with CI Monitors to ensure that you’ll be notified if the issue occurs again.
CI Visibility breaks down the duration across each stage of your pipeline and highlights where errors occur, enabling you to fix broken code and prioritize improvements. By inspecting your trace’s flame graph, you can home in on faulty jobs. The example below shows our pipeline that is either stuck or timing out, which may be the result of the unknown failure occurring in the mission job in our testing stage. By navigating to this execution’s test runs, we can begin to troubleshoot the tests that are causing this failure. Datadog has automatically highlighted one of our errorful tests as a known flaky test, however, by inspecting the error returned, it seems that our code is incorrectly providing an empty value.
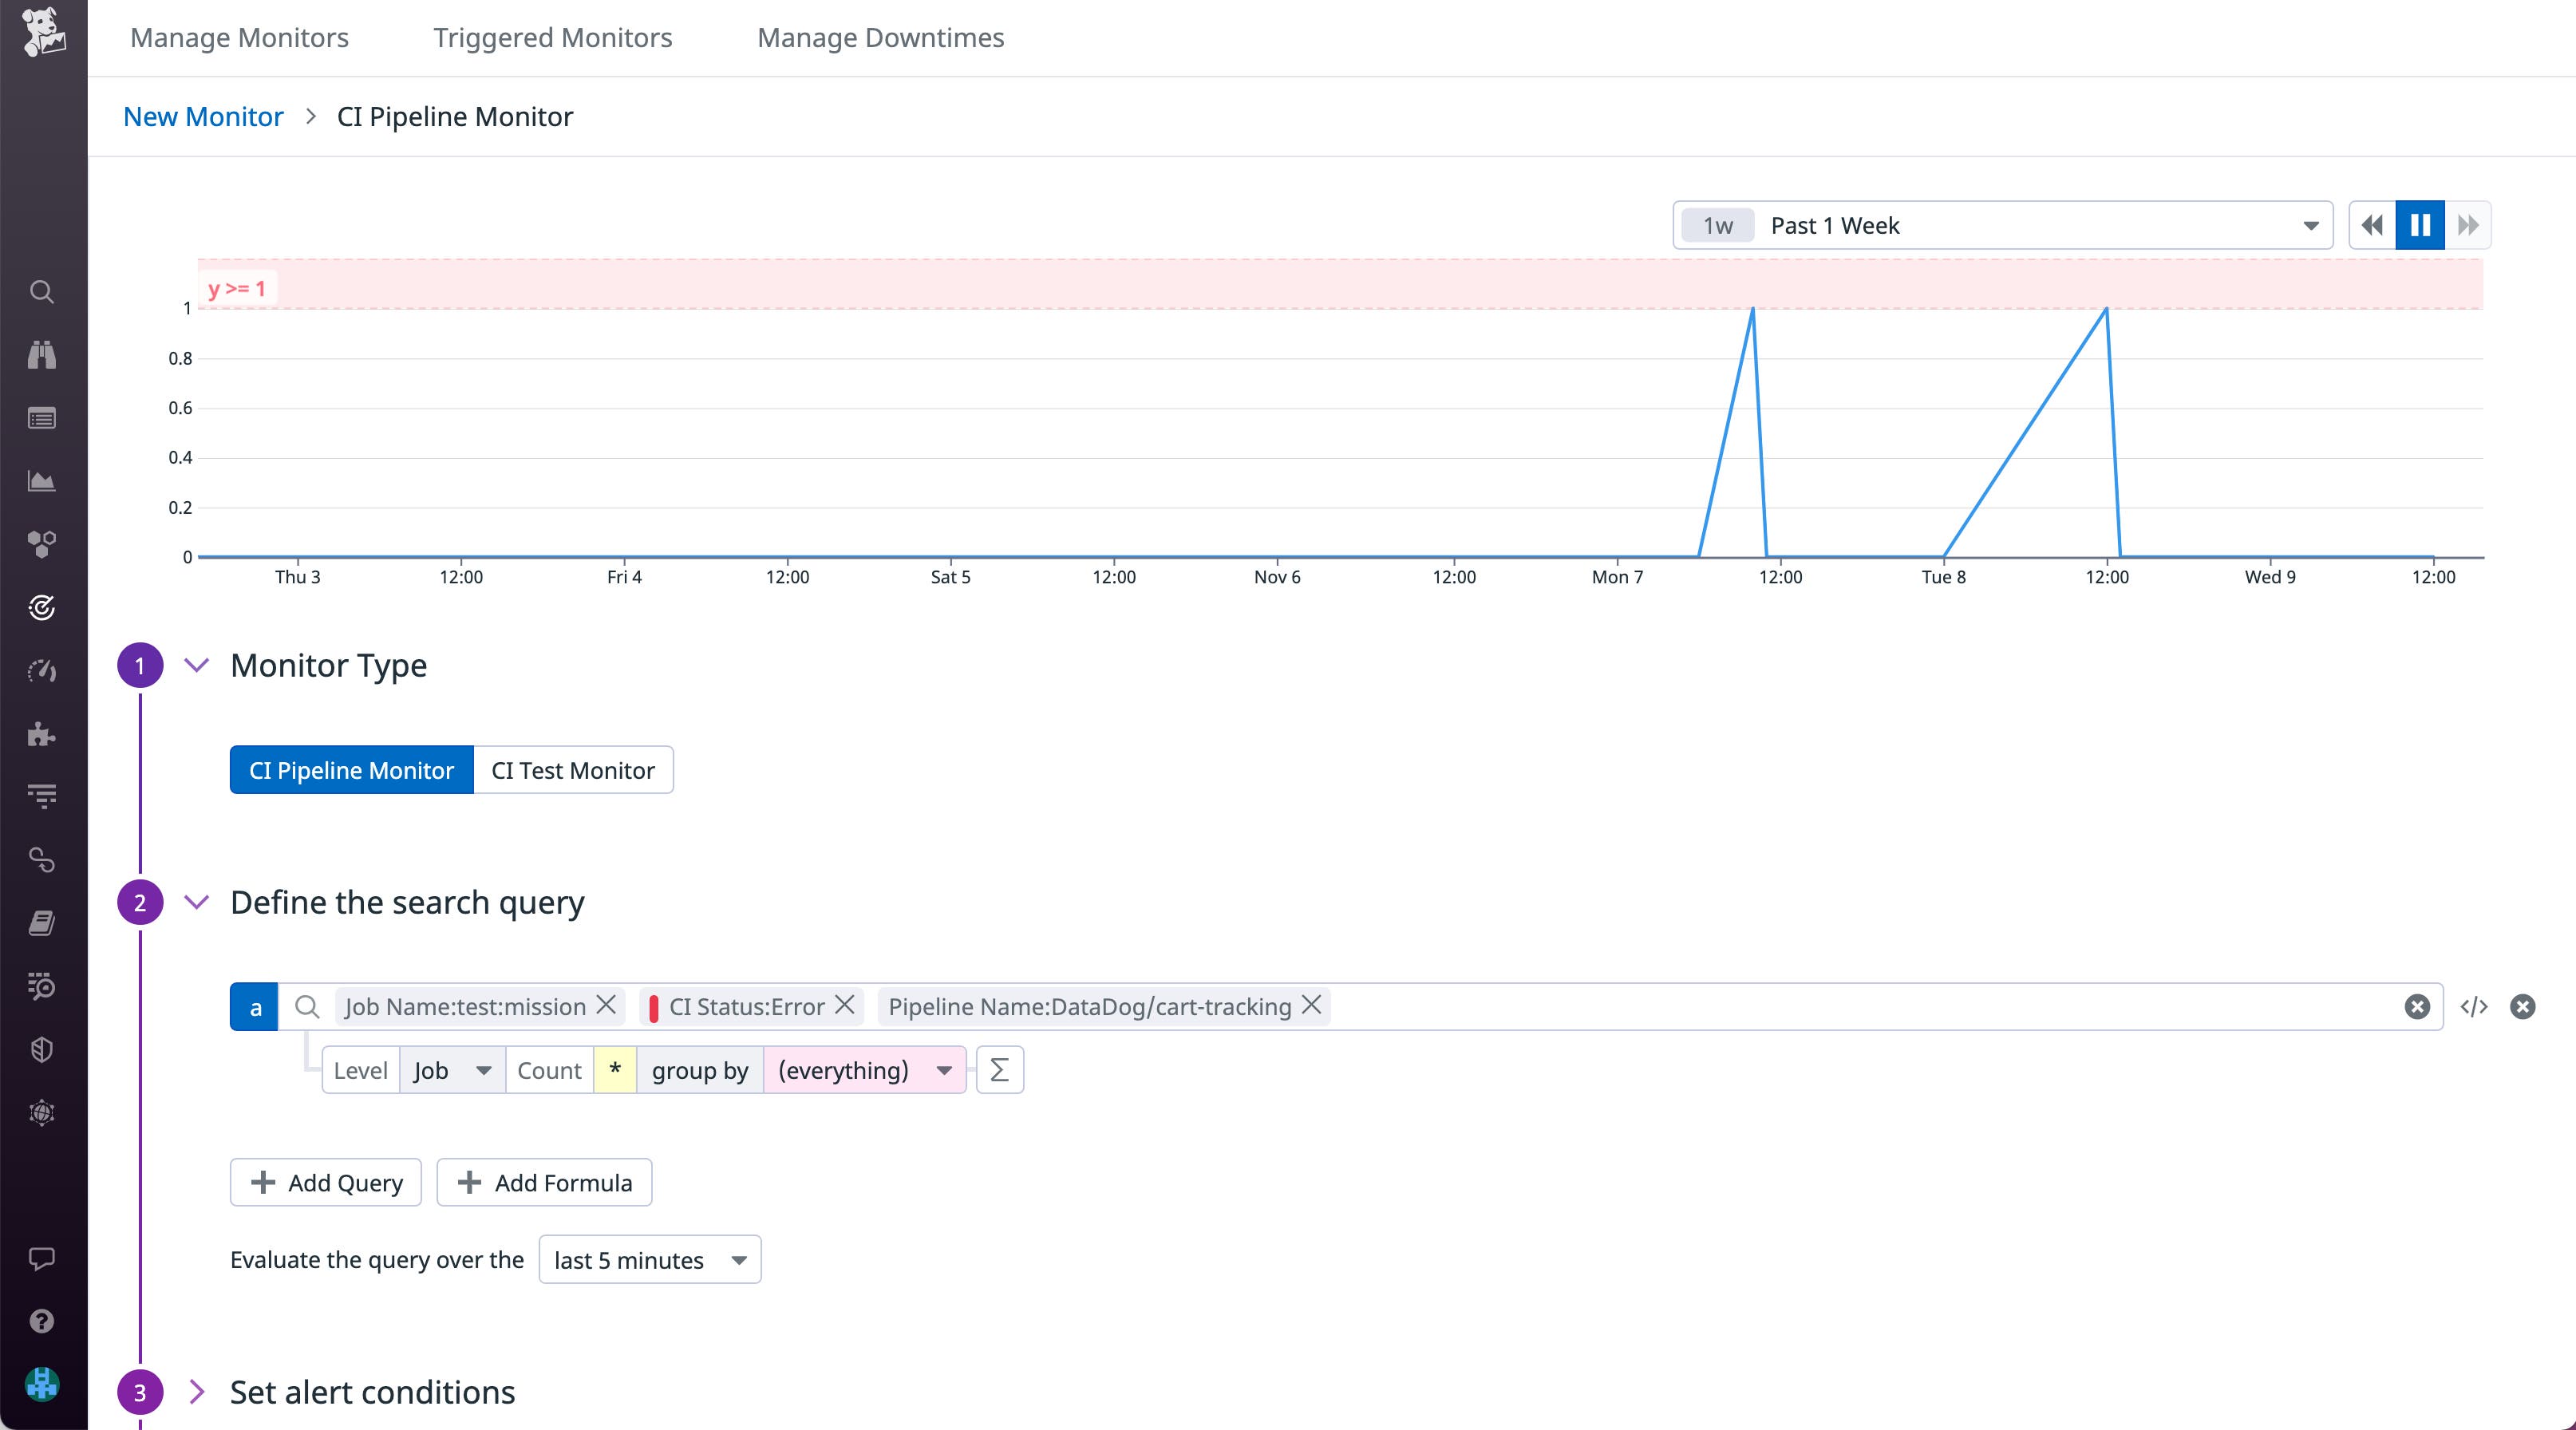
To better respond to similar incidents in the future, you can leverage CI pipeline monitors to alert you when the mission job in your pipeline returns an error. Having a configured monitor can often be the deciding factor in whether a broken pipeline goes unnoticed and can greatly reduce the time it takes to repair a pipeline and unblock developers waiting to build their latest code.
Active pipeline monitoring for reliable performance
Datadog CI pipeline monitors automatically notify you when your pipeline metrics cross critical thresholds. Creating monitors in conjunction with Datadog’s full suite of CI tools enables you to respond to changes in real time and troubleshoot problems before they elevate into significant outages. To learn more about how to best monitor your CI pipelines, view our documentation and try creating your first CI pipeline monitor today. If you don’t already have a Datadog account, get started today with a free 14-day trial.
