The simplest way to begin collecting Amazon EBS metrics and status checks is to use Amazon’s built-in CloudWatch monitoring service. There are a few different methods to do so, although each will let you access the same metrics. CloudWatch is accessible via:
- the CloudWatch or EC2 web consoles,
- the AWS command line tool, or
- a program or third-party monitoring service that connects to the CloudWatch API.
You can also install a monitoring agent on your EC2 instances to pull system-level information from any attached EBS volumes that CloudWatch does not collect on its own. We will go over all of these approaches in this post.
Authorization required
Securing and controlling user access to AWS can get complicated, especially at larger organizations that might have multiple teams and hundreds of users, not all of whom require the same permissions. AWS Identity and Access Management (IAM) provides a way to administer and secure API access. The following steps for monitoring CloudWatch metrics assume that you have access to a user account or role whose security policy grants the minimal permissions needed to manage the CloudWatch and EBS APIs. See the AWS documentation for information.
Crossing borders
As mentioned in part one of this series, EC2 instances and EBS volumes are specific to the region in which they were launched. Generally, CloudWatch will return metrics only for resources within a specified region. You can create dashboards that pull metrics in from multiple regions, but otherwise you must specify which region’s volumes you want to monitor. We’ll describe how to do this below.
Collecting EBS metrics from CloudWatch
CloudWatch collects metrics through a hypervisor from any AWS services you may use in your infrastructure. You can use AWS namespaces to isolate CloudWatch metrics from a specific service (e.g., EBS). As mentioned in part one of this series, CloudWatch collects metrics at five-minute granularity for all volume types except io1, from which it collects data at one-minute intervals. Custom metrics, which will be covered later, can be forwarded at a much higher frequency, though that can incur additional charges.
Note that, although EC2 instances with detailed monitoring enabled report EC2 metrics at one-minute resolution, any attached EBS volumes that are not io1 will still only report at five-minute intervals.
When viewing volume metrics, CloudWatch provides two complementary ways to aggregate the data: periods and statistics.
Periods
The period sets the timespan, in seconds, over which CloudWatch will aggregate a metric into data points. By default, this will be the standard collection interval of five minutes (or one minute for io1 volumes). The larger the period, the less granular your metric data will be. Periods shorter than one minute are only possible with custom metrics.
Many EBS volume performance characteristics are measured in terms of throughput per second. On the other hand, CloudWatch metrics are generally aggregated over the full period. So it may be helpful or even necessary to divide the returned CloudWatch metric by the number of seconds in the period to benchmark volume performance.
Statistics
Statistics are different ways to aggregate the data over the collection period. The following options are available: Minimum, Maximum, Sum, Average, SampleCount (the number of data points used for the aggregation), and pNN.NN. The pNN.NN aggregation returns any user-specified percentile (for example p95.00). This provides useful data for monitoring median values, outliers, and worst-case metrics.
For EBS metrics, different statistics for the same metric can provide very different bits of information, and some may not be supported by volumes attached to certain instance types. For example, when looking at the VolumeWriteBytes metric, the sum will report the total number of bytes written over the period while the average will return the average size of each write operation during the period. Many of these differences and exceptions are covered in part one of this series, and you can find more information in the EBS documentation.
How to collect EBS metrics
There are three primary ways to view EBS metrics from CloudWatch: via the AWS web console, via the AWS CLI, and via a third-party tool that integrates with the CloudWatch API.
For the first option, viewing metrics from the AWS console, there are actually two different methods, with small but important differences in how the data is presented. You can use the CloudWatch console, or go to the EC2 console.
CloudWatch console
The main CloudWatch page lets you view metrics on a per-volume basis, and includes useful features like the ability to:
- browse available metrics for a quick overview of your volumes,
- create dashboards to track multiple metrics, and
- set alarms to notify you if metrics pass fixed thresholds.
Browse metrics
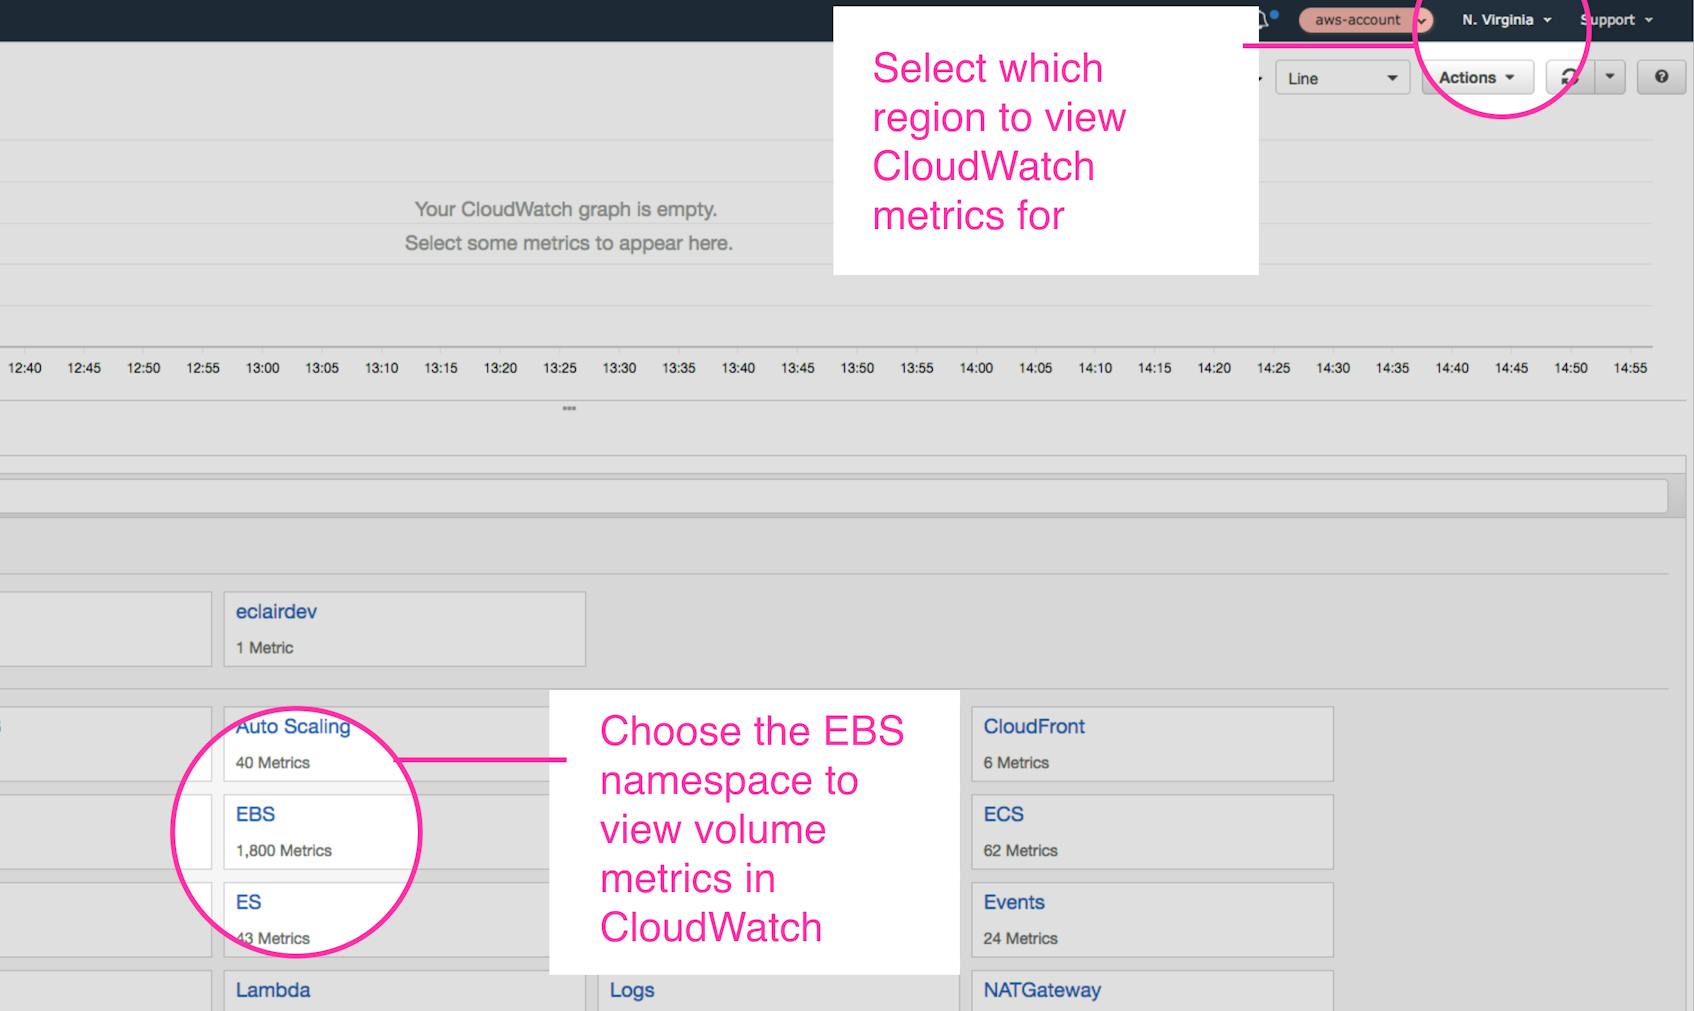
In the CloudWatch console, you can use the region selector to specify which region you want to view. Then, select an AWS namespace to see metrics from that service or source. Within the EBS namespace, metrics are only available on a per-volume basis, so you must select or search for the specific volume or volumes you want to see.
The basic CloudWatch graph provides options for the time range you wish to view as well as the type of graph displayed—line, stacked graph, or a number graph that displays the metric’s current value. You can plot multiple metrics, from the same source or from different sources, on the same graph. So, for example, you can view disk reads per second for different volumes at the same time, or compare disk read to disk write levels on the same volume.
Dashboards
For a more comprehensive picture of your EBS volumes and AWS infrastructure, you can create and save CloudWatch dashboards, which let you visualize multiple configurable graphs simultaneously. This is helpful for correlating instance metrics with each other and with data from other Amazon services. Dashboards provide the additional ability to change the metric aggregation period. You can also add metric graphs from different regions to the same dashboard.
Alarms
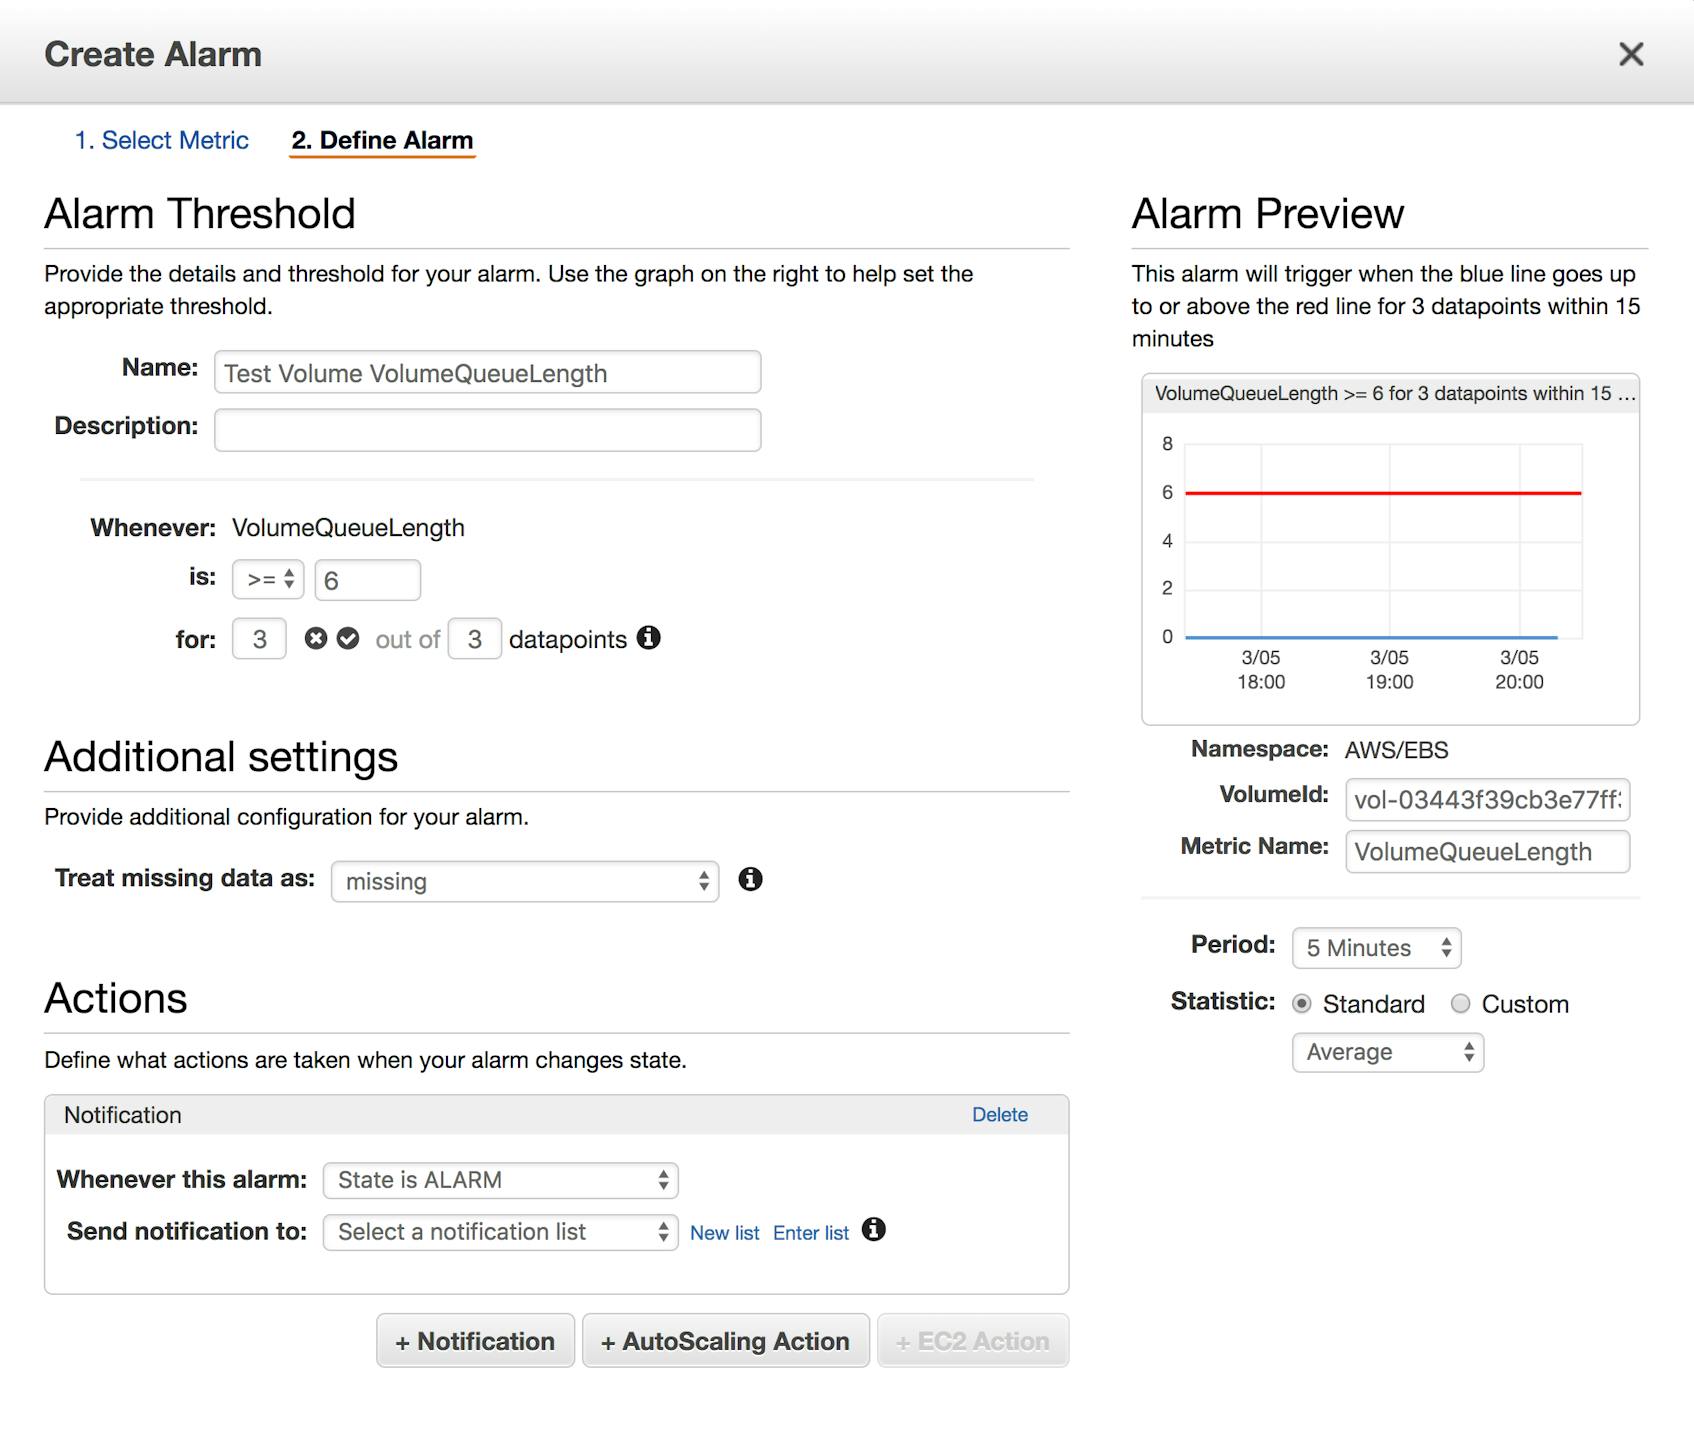
CloudWatch lets you create basic alarms on EBS metrics. Alarms can be set against any upper or lower threshold and will trigger whenever the selected metric, aggregated across the specified dimension, exceeds (or falls below) that threshold for a set amount of time. In the following example, we are creating an alarm that will notify us if the average volume queue length of the volume is more than six (the recommended queue size for a volume with 3,000 IOPS) for three consecutive periods of five minutes.
Alarm actions can be tied to any CloudWatch metric. EBS volumes can be modified and scaled up (though not down) without detaching them. So, for example, you can create an alarm to notify you if an io1 volume uses a certain percentage of its available IOPS, then make a decision if you need to modify that volume to provision more IOPS. AWS Auto Scaling lets you automate the size of your EC2 fleet. Combine this with alarms based on EBS metrics to automatically launch more instances to help shoulder the load or terminate unnecessary ones.
EC2 console
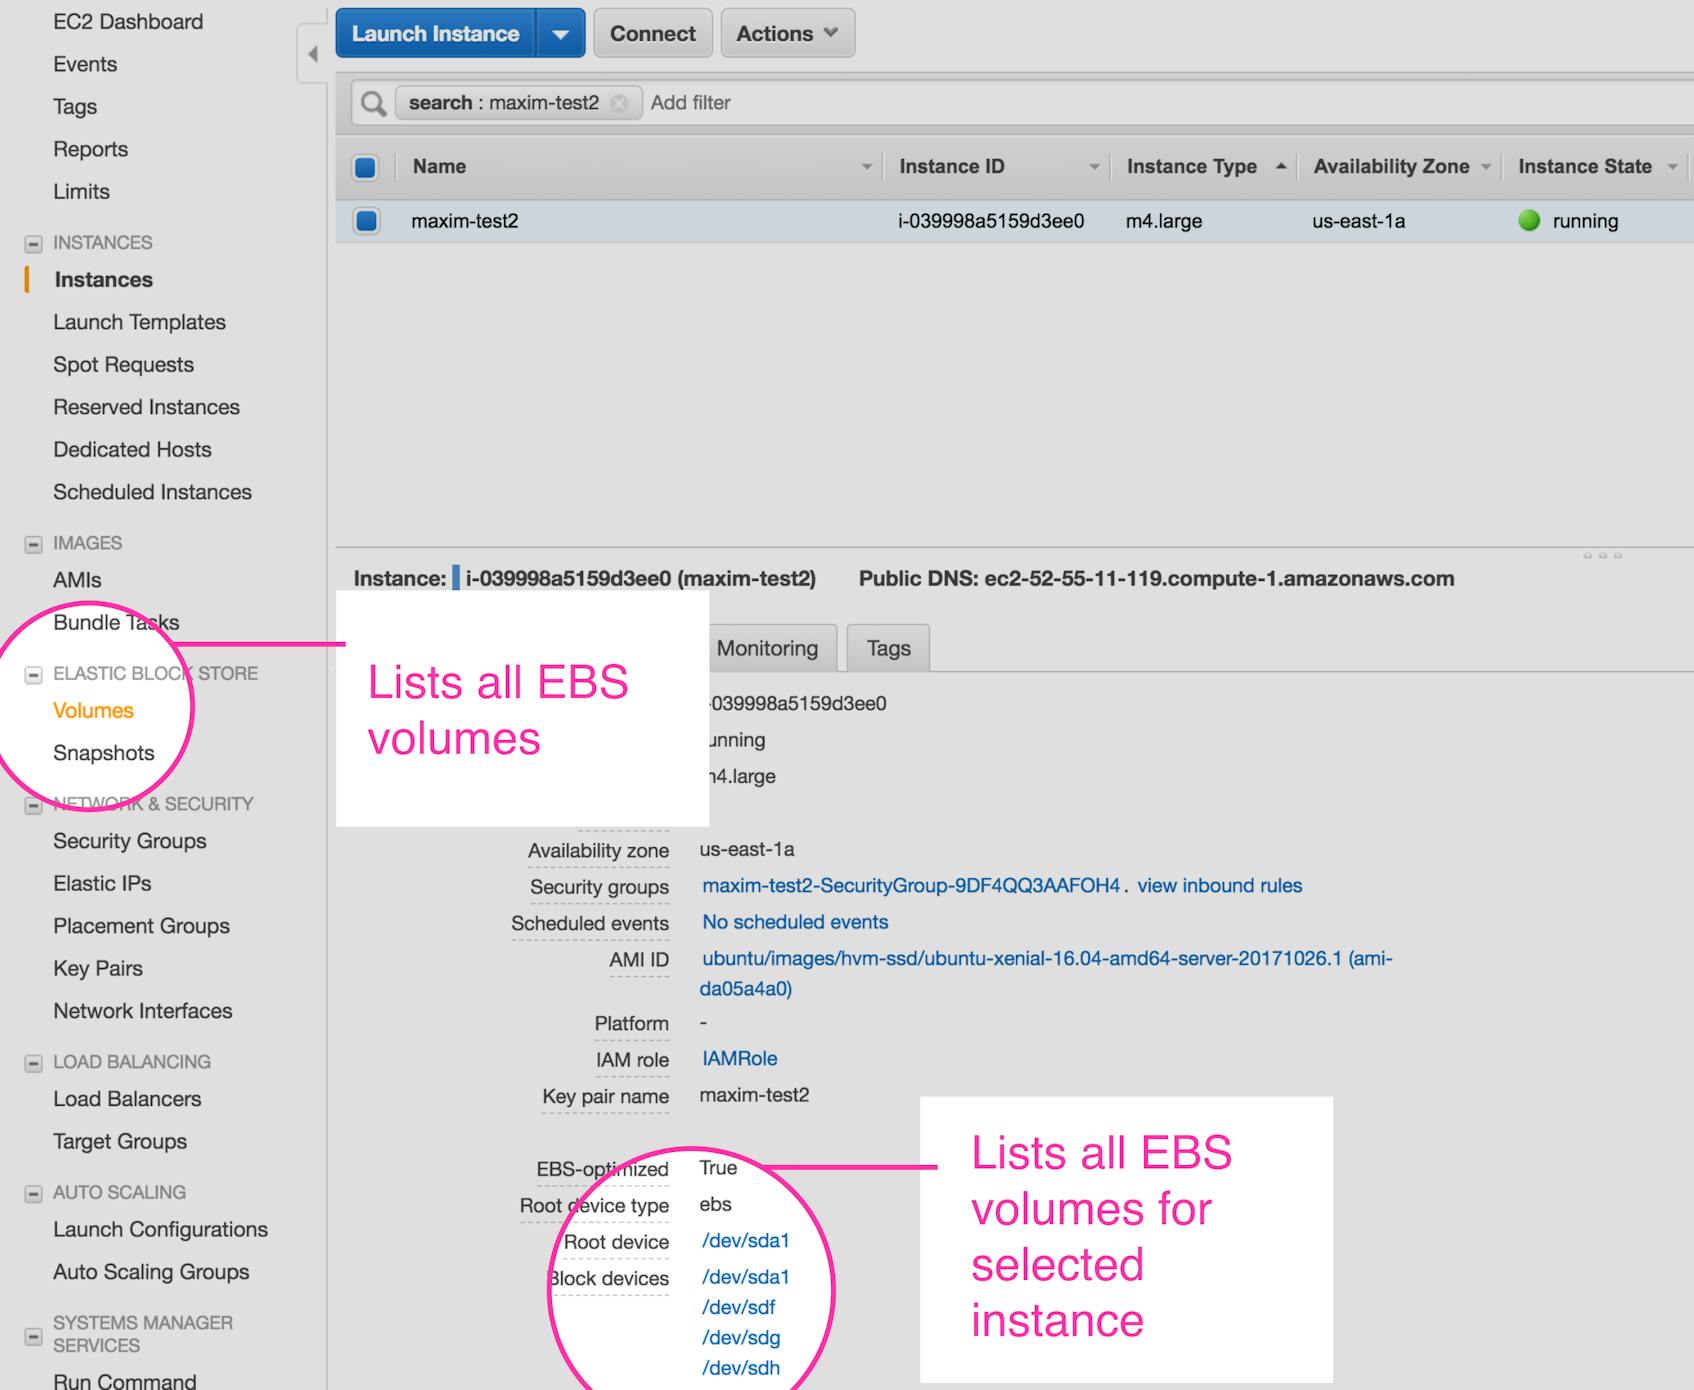
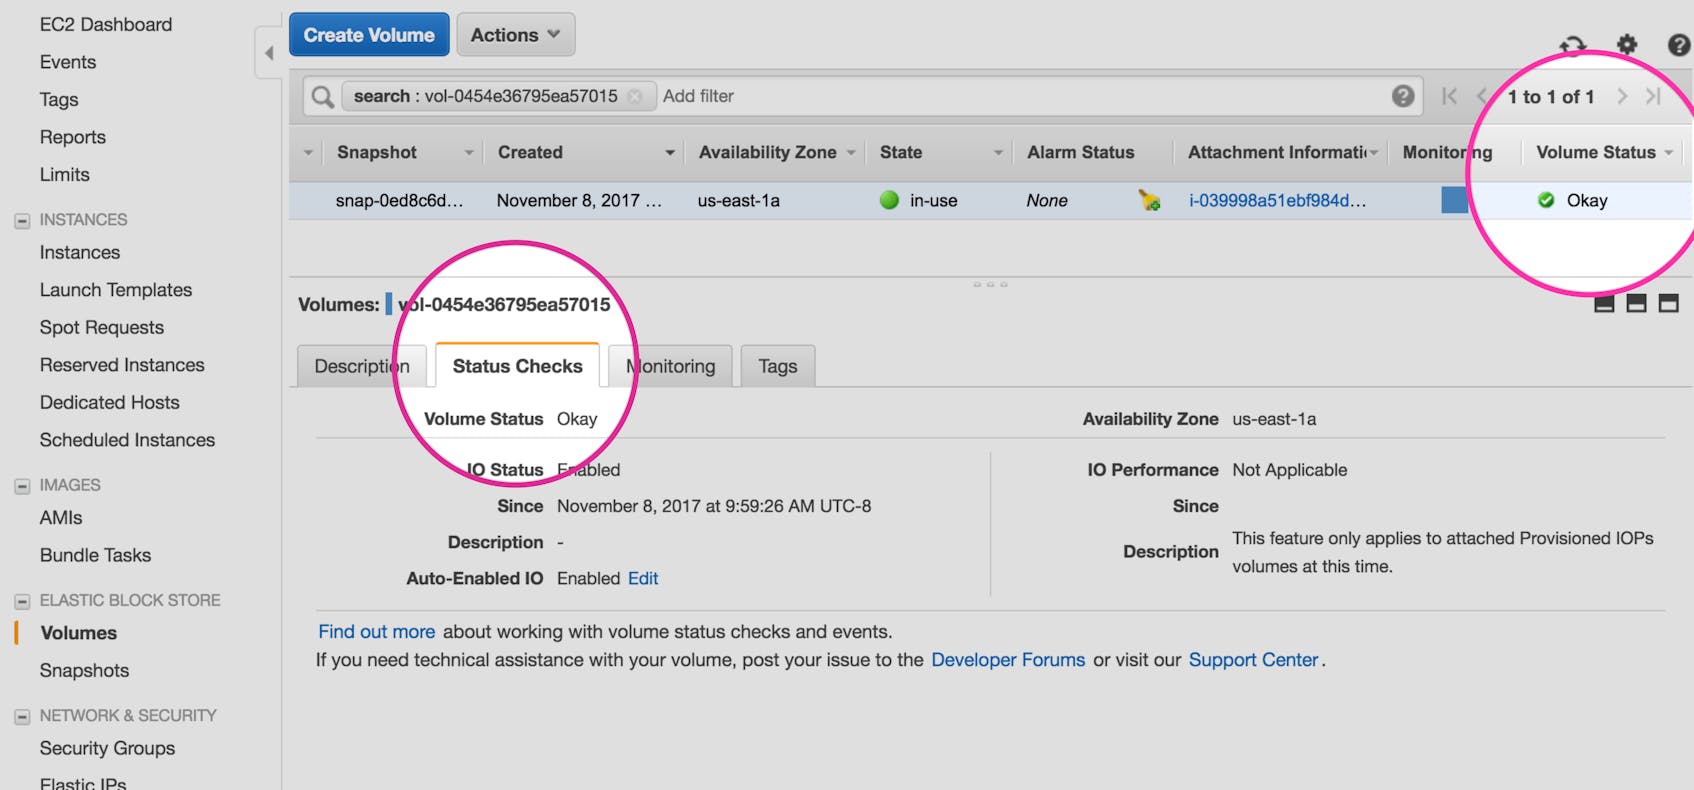
From the EC2 console you can access information about your volumes either from the volume list, which will show a full inventory of volumes (attached or unattached), or by selecting an instance and then navigating to the volumes that are attached to it (as shown below).
In either case, once a volume is selected, you can view metrics and status checks from the Monitoring and Status Checks tabs respectively.
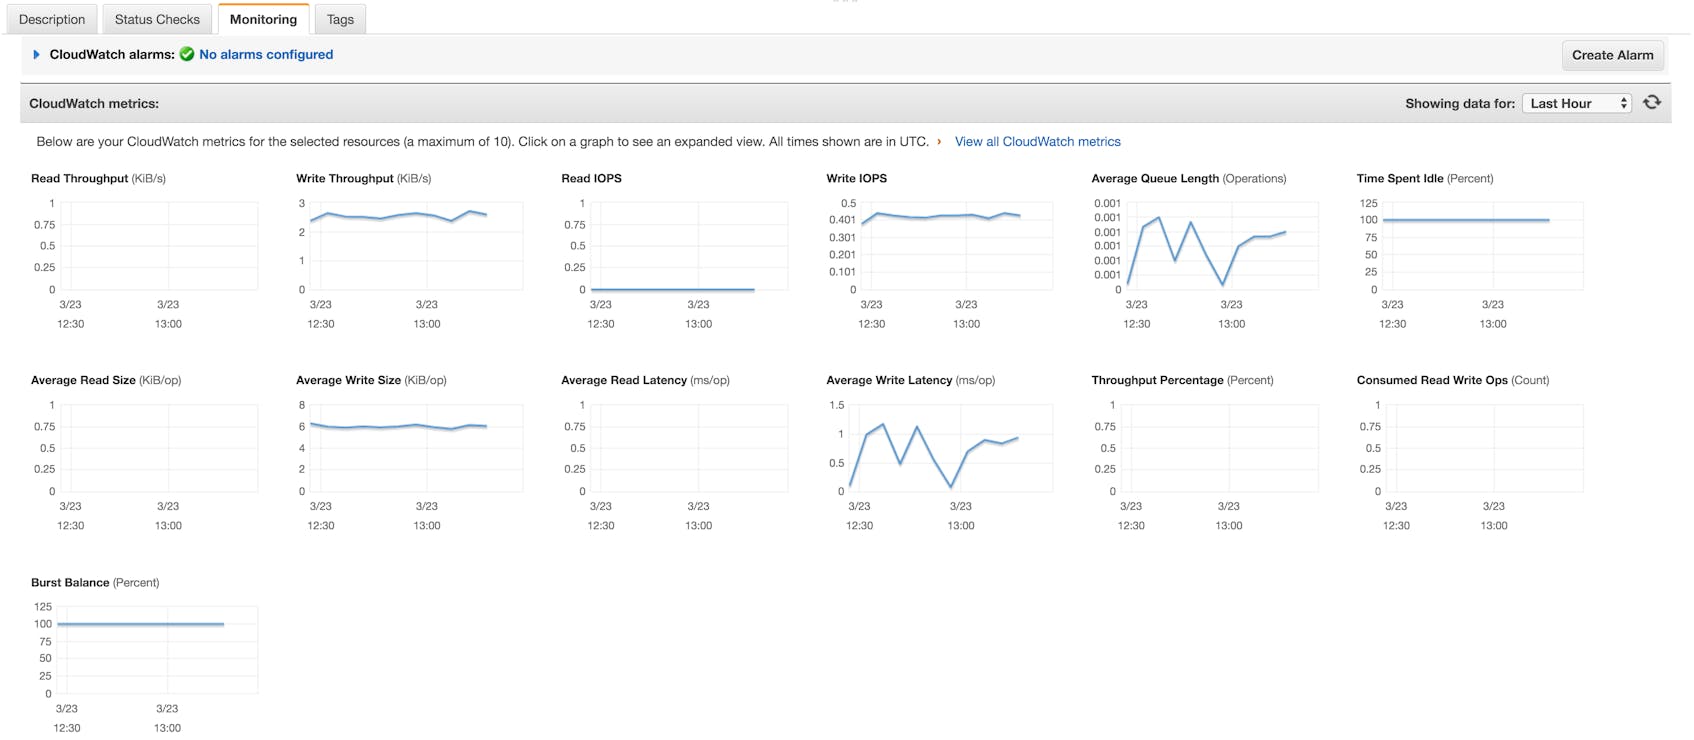
Monitoring
The Monitoring tab displays metric graphs for a selected volume. It is important to note these are not identical to the graphs you can view through CloudWatch. The EC2 console collects the same metrics from CloudWatch, but the visualizations for many are different as a result of additional calculations that provide values that can be easily compared to your volumes’ performance specifications and used to help benchmark your volume configuration. For example, where the CloudWatch console will provide the number of read operations fully aggregated over the period (regardless of the statistic requested), the EC2 console will divide that number by the number of seconds in the period to provide the volume’s IOPS.
Status checks
Volume status checks are reported from the EC2 namespace instead of through CloudWatch, and you can view them via the EC2 console. The volume list view includes a simple Volume Status field that will indicate Okay if the volume has passed all status checks or Impaired if either the I/O status check or the performance status check (for io1 volumes only) fails. After selecting a specific volume, the Status Checks tab provides further information on the volume’s I/O status and, in the case of io1 volumes, performance status.
Metrics via CLI
Installing the AWS CLI tool allows you to query the full AWS API from the command line. Most EBS metrics are requested from the CloudWatch namespace. However, status checks are reported from the EC2 namespace, so you’ll need two different CLI commands to request all the metrics described in the first part of this series. In either case, you can specify which region you want to query in two ways. First, you can set the environment variable, AWS_DEFAULT_REGION (this is also set when you initially configure the AWS CLI tool). Or you can include the --region parameter with the command.
EBS metrics
You can request CloudWatch metrics through the AWS CLI by running the CloudWatch get-metric-statistics command. CloudWatch pulls metrics from many AWS services, so you must point get-metric-statistics to EBS with the namespace parameter to target the correct metrics.
The following additional parameters are required:
metric-namestart-time(ISO 8601 UTC format)end-time(ISO 8601 UTC format)period(in seconds)statistics, orextended-statisticsif you want to specify a percentile.
Finally, as we saw on the CloudWatch web console, CloudWatch only provides EBS volume metrics on a per-volume basis. So when requesting metrics via the CLI, you have to specify a single volume via the dimensions parameter, which takes a name/value pair.
For example:
aws cloudwatch get-metric-statistics
--namespace AWS/EBS
--metric-name VolumeReadBytes
--start-time 2018-02-08T20:00:00
--end-time 2018-02-08T20:15:00
--period 300
--statistics Sum
--dimensions Name=VolumeId,Value=vol-0222g36795js57015
This requests the total read throughout for the specified volume for the 15-minute timespan indicated, with datapoints aggregated over five-minute periods. The JSON response looks like the following:
{
    "Label": "VolumeWriteBytes",
    "Datapoints": [
        {
            "Timestamp": "2018-02-08T20:05:00Z",
            "Sum": 1486848.0,
            "Unit": "Bytes"
        },
        {
            "Timestamp": "2018-02-08T20:10:00Z",
            "Sum": 1474560.0,
            "Unit": "Bytes"
        },
        {
            "Timestamp": "2018-02-08T20:00:00Z",
            "Sum": 1601536.0,
            "Unit": "Bytes"
        }
    ]
}
Note that CloudWatch’s JSON response is not necessarily ordered chronologically when it returns more than one datapoint.
EBS status checks
To request volume I/O status checks using the CLI, you must use the EC2 describe-volume-status command. Absent any user-specified arguments, this command will return the status and any associated events and actions for all active volumes within the default region. You can narrow down results either by passing a list of one or more volume IDs or by using filters. For example, you can view metrics for all volumes that have an impaired volume status, or for volumes within a specific availability zone.
The following command simply requests volume status for two specified volumes:
aws ec2 describe-volume-status --volume-ids vol-0452s36845ej27015 vol-0a63ni625x0b22fc7
This returns:
{
    "VolumeStatuses": [
        {
            "Actions": [],
            "AvailabilityZone": "us-east-1a",
            "Events": [],
            "VolumeId": "vol-0452s36845ej27015",
            "VolumeStatus": {
                "Details": [
                    {
                        "Name": "io-enabled",
                        "Status": "passed"
                    },
                    {
                        "Name": "io-performance",
                        "Status": "not-applicable"
                    }
                ],
                "Status": "ok"
            }
        },
        {
            "Actions": [],
            "AvailabilityZone": "us-east-1a",
            "Events": [],
            "VolumeId": "vol-0a63ni625x0b22fc7",
            "VolumeStatus": {
                "Details": [
                    {
                        "Name": "io-enabled",
                        "Status": "passed"
                    },
                    {
                        "Name": "io-performance",
                        "Status": "normal"
                    }
                ],
                "Status": "ok"
            }
        }
    ]
}
Note that io-performance is listed as not-applicable for the first volume in the response. This is because the I/O Performance check is only available for Provisioned IOPS volumes.
If there are any scheduled events associated with the volumes you are checking, those will also appear in the response to describe-volume-status.
Metrics via API
Amazon provides SDKs for major programming languages and mobile platforms to create applications and libraries that can communicate with AWS via specific APIs. A number of third-party monitoring products take advantage of these APIs to pull and aggregate metrics automatically.
If you want to access the API directly, refer to the individual SDK documentation for information on how to make requests to the CloudWatch and EBS namespaces for metrics and status checks. Amazon also supports a basic REST API that accepts HTTP and HTTPS requests.
Full observability
CloudWatch gives you a convenient and general overview of your volume fleet. And because CloudWatch collects metrics from most AWS services, you can monitor several different parts of your infrastructure from one location. But because it gathers metrics via a hypervisor instead of reporting from your volumes themselves, it doesn’t collect all the EBS metrics that you might want to keep an eye on, notably disk space statistics.
One way to fill this gap is to install an agent on your instances that can collect system-level information such as disk utilization metrics. An example of this is Amazon’s CloudWatch Agent. CloudWatch treats metrics forwarded by its agent as custom metrics, meaning that by default it collects them at a one-minute resolution and has the ability to go as high as one second. Note, however, that additional charges will accrue for custom metrics.
A comprehensive monitoring service can provide even more visibility into your infrastructure by integrating with each part of your stack. This way you can get complete, single-platform coverage of your applications as well as all the components that support them, including EBS volumes, EC2 instances, and other technologies. A monitoring service also has the potential added benefit of increased resolution, because metric collection is not restricted by CloudWatch’s hypervisor.
In the third and final post of this series, you will learn how to use Datadog to set up comprehensive, high-resolution monitoring for your EBS volumes and the rest of your stack.
Source Markdown for this post is available on GitHub. Questions, corrections, additions, etc.? Please let us know.

