If you’re running a mix of Windows– and Linux–based hosts in hybrid or cloud environments, network monitoring is especially important—and especially difficult. As network topologies are becoming increasingly distributed and dynamic, you need a quick way to identify connectivity issues across regions, services, and operating systems.
Datadog Cloud Network Monitoring (CNM) provides comprehensive visibility into these dynamic environments, and now includes support for Windows hosts. CNM Windows support enables you to visualize the flow of traffic across network endpoints and contextualize application and infrastructure issues in multi-OS environments.
Visualize your network—no matter the OS
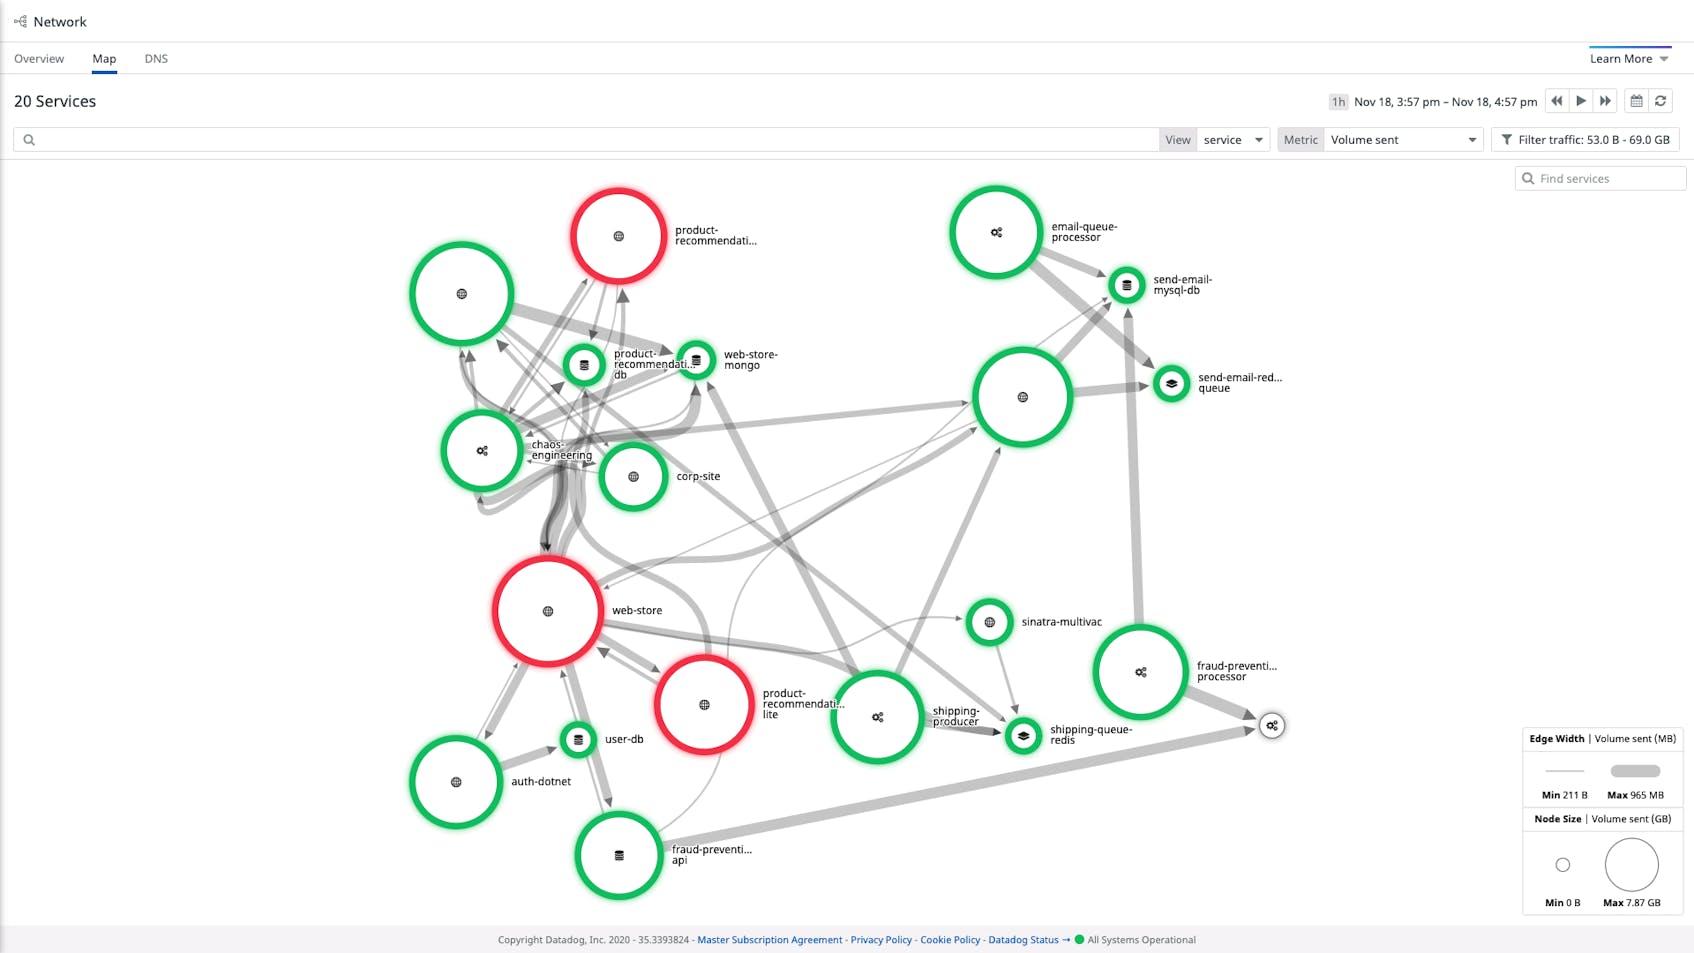
As your infrastructure makes use of microservices, multi-cloud deployments, canarying, and other complex network architectures, the most effective way to conceptualize and monitor your network’s topology is with live visualization. Cloud Network Monitoring enables you to visualize your network architecture—for both Windows and Linux hosts. For even deeper visibility, you can drill down using metric and tag-based filters, allowing you to quickly spot dependencies where network latency and connectivity issues are concentrated.
Use the Network Map for quick insights into your network topology
Datadog Cloud Network Monitoring maps the network traffic between your Windows Server instances, IIS load balancers, SQL Server replicas, and all the hosts in your infrastructure.
The Network Map makes it easier to locate problems in your network. In the example below, we’re using the Network Map to investigate an incident within an application. The map displays the volume of bytes sent between services.
Since the Network Map displays the status of alerts associated with each service, we can immediately see that most services are healthy while some are in an alerting state, giving us leads for our investigation.
By visualizing network flows within the Network Map, you can also quickly identify inefficiencies in your network—e.g., services you didn’t know were still running—spot opportunities to optimize, and oversee operations like blue/green deployments and rollouts in new availability zones.
This means that if you see one node in an alerting state, you can click the node and then click “Inspect” in the context menu to quickly check if upstream or downstream dependencies of that node are also triggering alerts.
Use the Network Overview to drill down
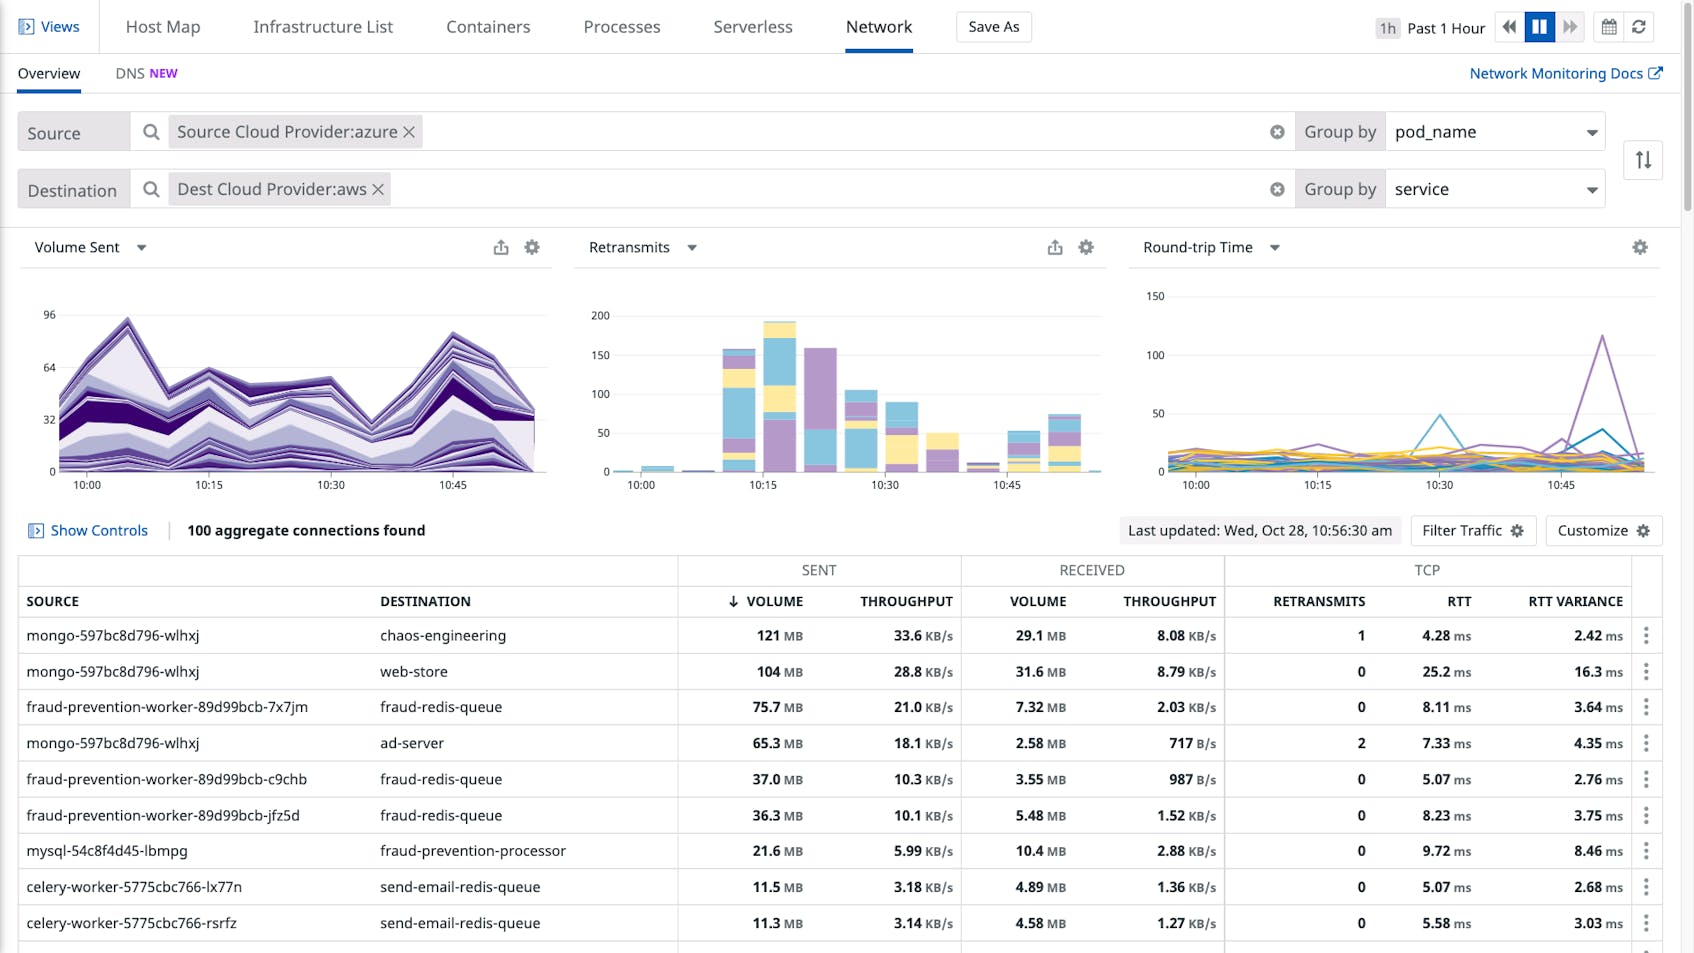
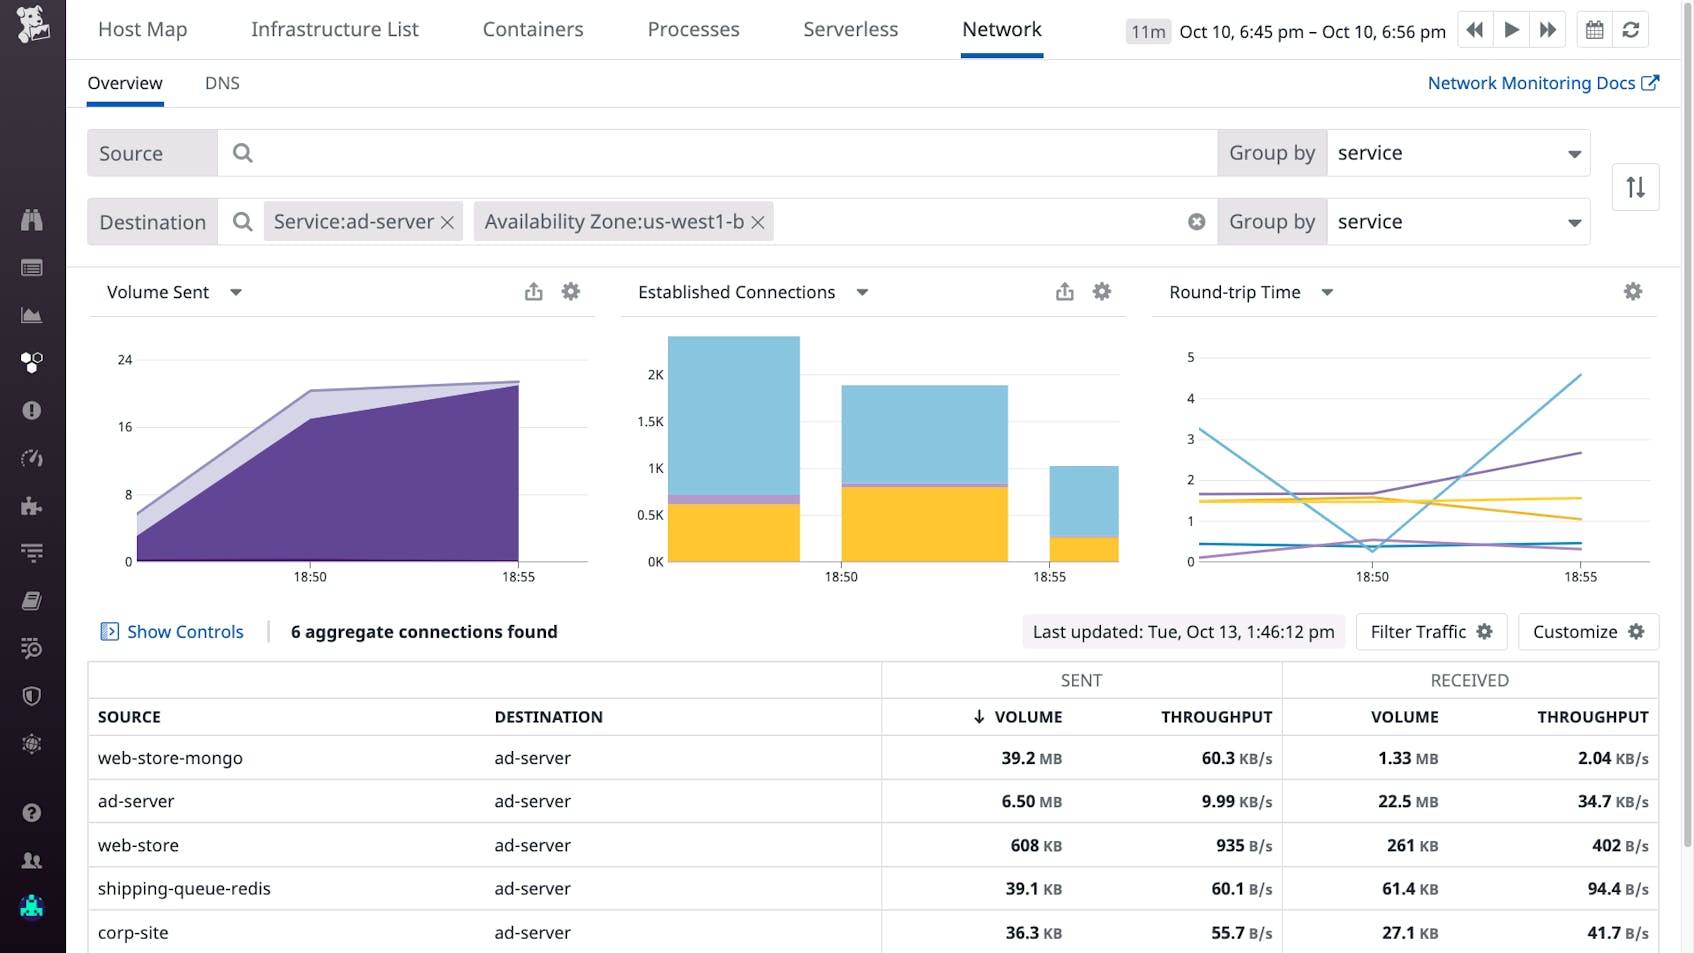
The Network Overview provides customizable views of your network dependencies—and the health of those dependencies in your Windows and Linux environments.
You can group and filter with tags to visualize IP-to-IP connection data as traffic flows between virtual private clouds, availability zones, services, or other meaningful parts of your infrastructure. You can also use facet panels to scope your view to a particular application port (e.g., for Kafka or Redis) and determine whether (for example) your infrastructure dependencies may be responsible for increased cross-VPC network latency.
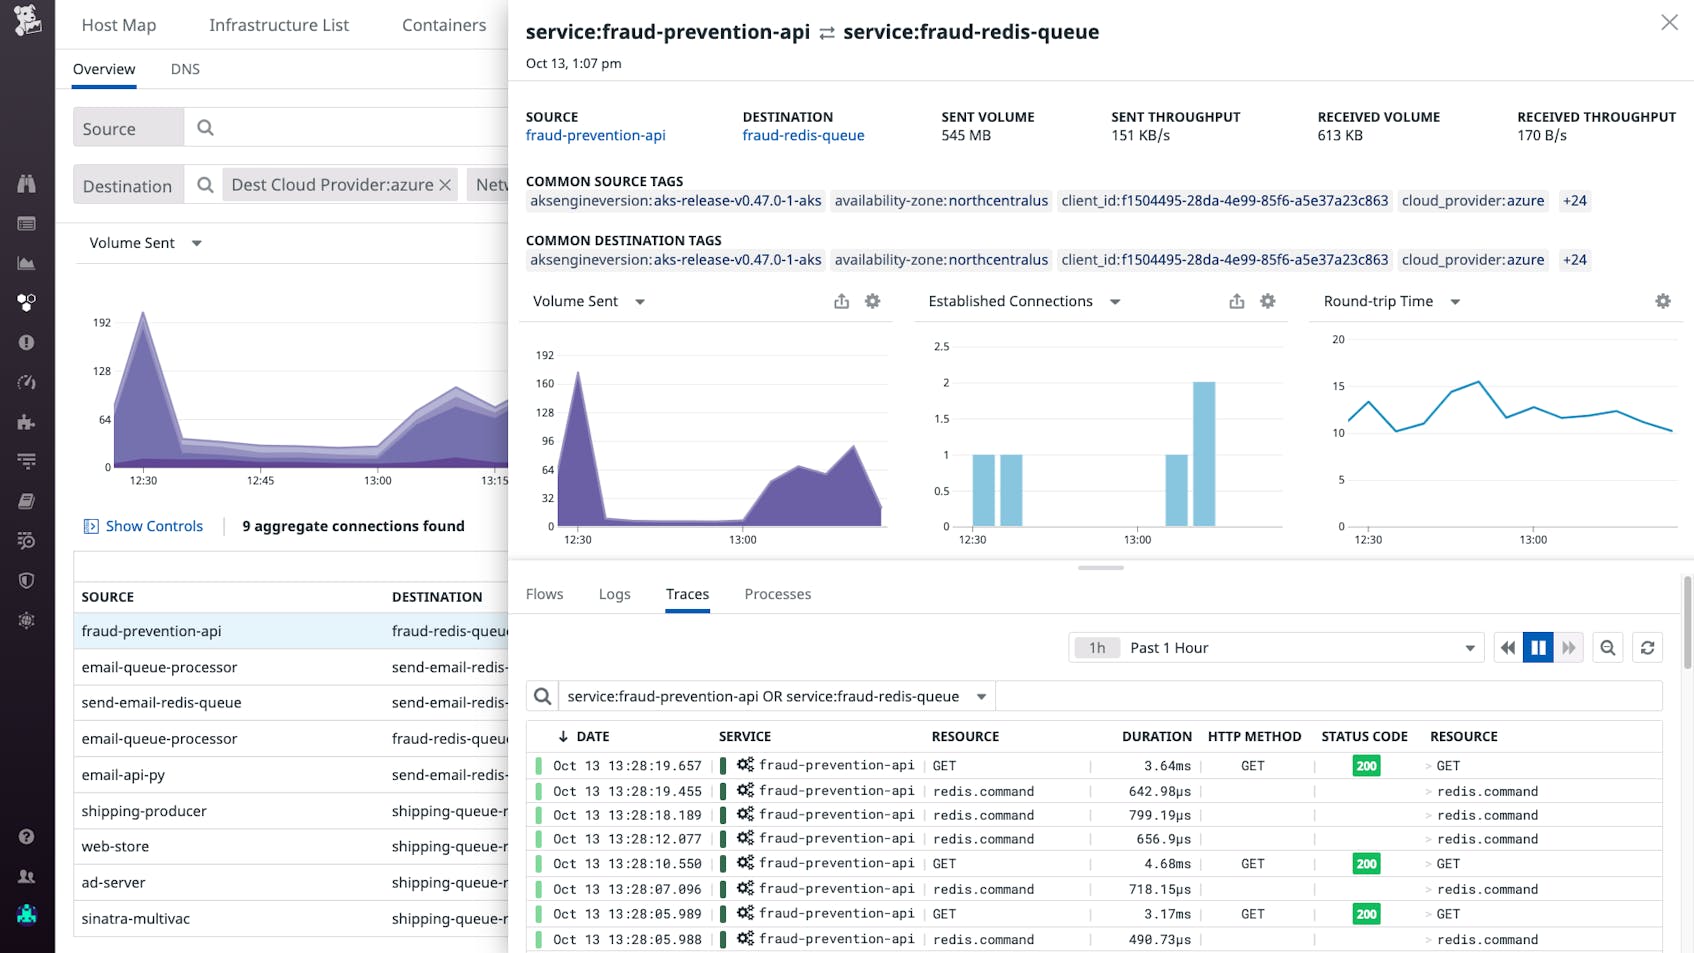
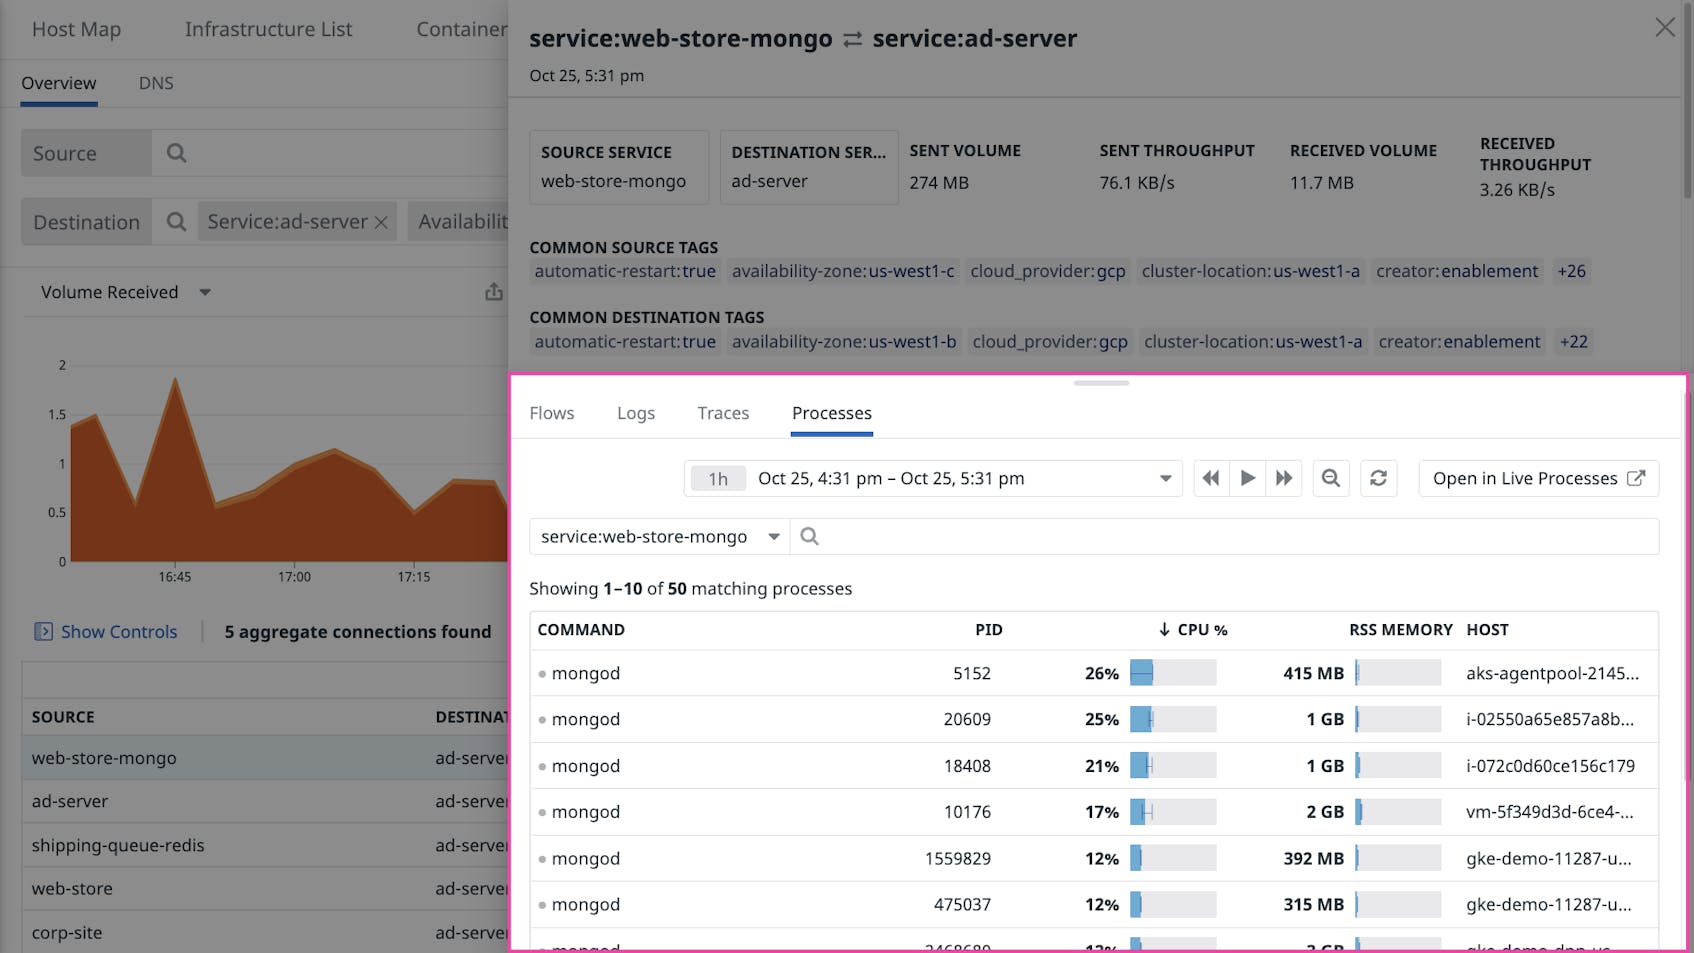
If a particular network dependency has shown an unusual change in volume, you can quickly identify possible causes or effects by inspecting related processes, logs, and traces. For example, you can check whether:
- A spike in traffic has caused an increase in CPU utilization or RSS memory for processes running on the destination endpoint
- A drop in network traffic volume corresponds with a rise in error logs for dropped database connections
- A rise in demand on a web server correlates with increased request latency
Use CNM Windows support to streamline your network troubleshooting
You can visualize network flow data alongside logs, infrastructure metrics, and application traces, enabling you to quickly pinpoint root causes of issues within your Windows or multi-OS network without switching contexts. We will illustrate with an example.
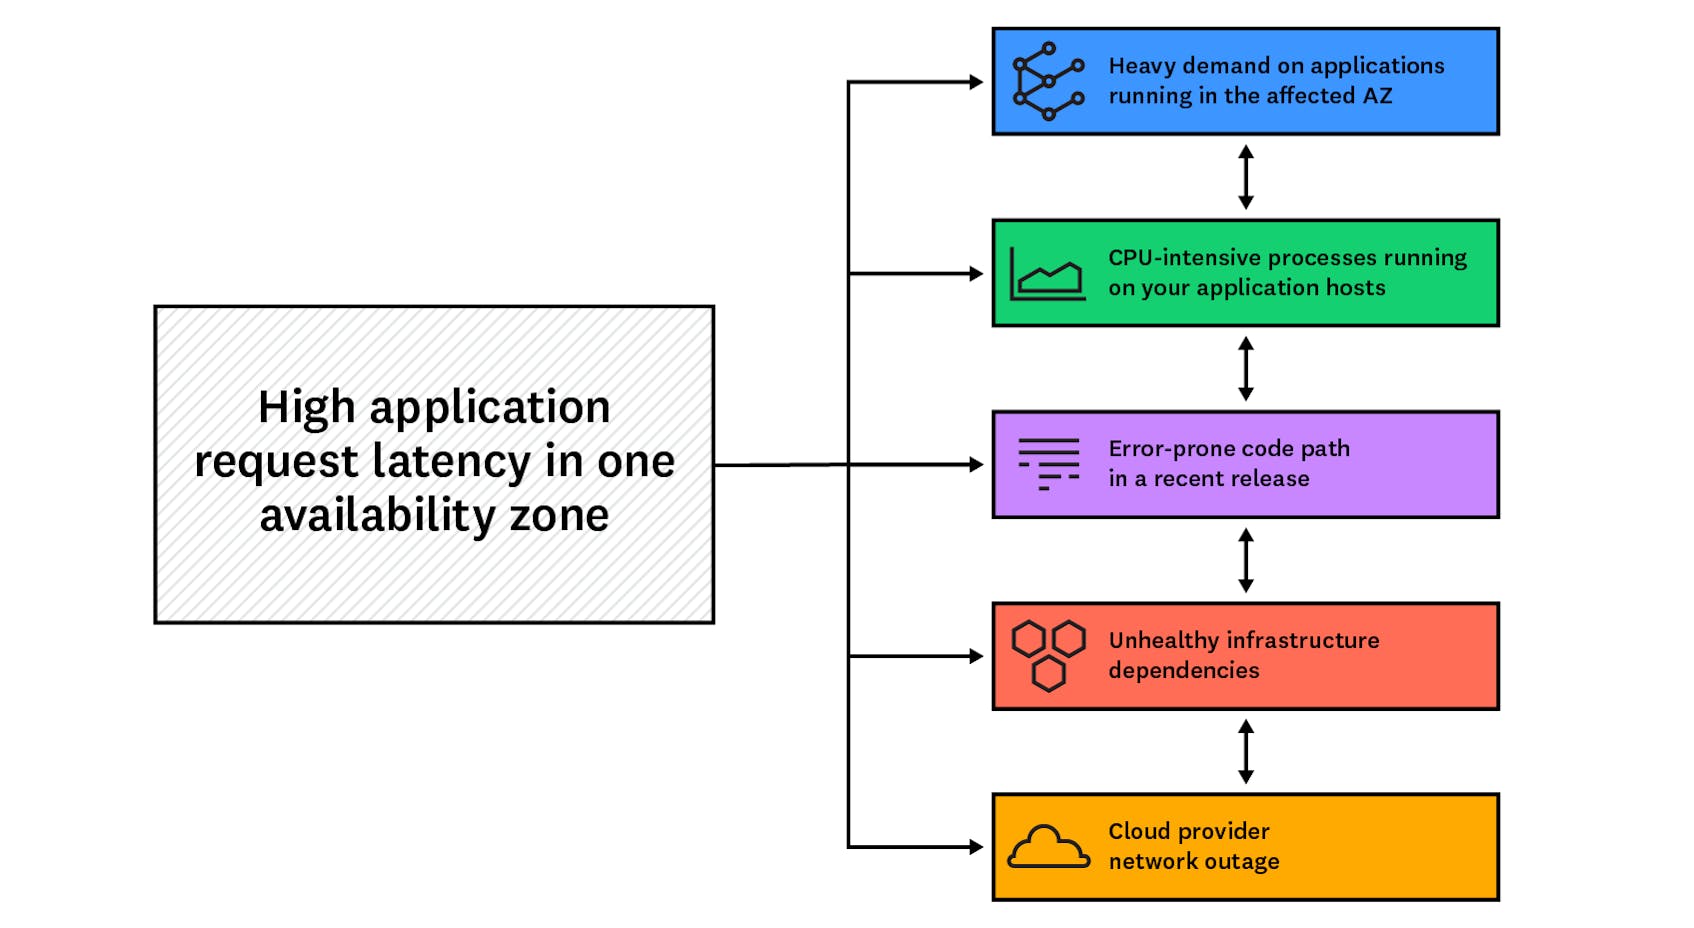
In this scenario, a Datadog alert notifies your team that your applications running within a public cloud are taking an unusually long time to handle requests. Since you have set up a multi-alert on the availability_zone tag, you can see that the increased latency only affects hosts running applications within a single AZ. The alert notification includes a link (using tag variables) to a view of the Network Overview that is pre-filtered to show only network flows in which your application is a destination. You can correlate your CNM data with the rest of your telemetry data to investigate possible causes:
- There is heavy demand on applications running in the affected AZ
- Processes running within your application hosts are consuming more CPU than usual
- A recent release has introduced an error-prone code path into your application
- Infrastructure dependencies are unhealthy
Application instances in the affected AZ are getting overloaded with network traffic
You visit the Network Overview from the alert notification to check whether application hosts in the affected AZ are handling more network traffic than usual. The “Volume Sent” graph shows an anomalous increase in traffic to your service, suggesting that the application’s latency spike has resulted from factors outside the application’s code or conditions on the application host (such as a misconfigured upstream proxy or loss of availability in another AZ).
Your application servers are consuming more CPU than usual
In the Network Overview, you click on one of the flows in which your application is a destination. A sidebar opens with more information about the flow. From there, you open the “Processes” tab to see data about all processes associated with the flow. By sorting the processes by CPU utilization, you can see right away whether any unexpected processes—e.g., a local DNS resolver—are consuming compute resources intended for your application.
Your application code contains errors
Using the Network Overview sidebar that appears when you click a flow containing your application, you click the “Traces” tab. You see that requests to your application are resulting in 503 (Service Unavailable) response codes, which could mean that these requests have timed out. You inspect the flame graphs accompanying the errors and notice that a release your team is canarying in the affected availability zone includes a certain SQL Server query that is scanning entire tables, causing requests to exceed the timeout interval.
Infrastructure dependencies are showing elevated error rates
You visit a custom dashboard you created for your application that displays CNM data alongside other data from your infrastructure and applications. You adjust the availability_zone template variable to the one that triggered the alert for high application request latency. Datadog integrates with Azure, AWS, GCP, and other services, so you can check whether the request latency metric correlates with errors from cloud-based dependencies in that availability zone, such as a rise in NoSuchKey or InvalidObjectState errors in Amazon S3 (aws.s3.4xx_errors).
If none of these scenarios seem to explain the increased latency in a single AZ, your cloud provider may be experiencing an outage and you should contact their support team.
Get network-level visibility in minutes
With Cloud Network Monitoring for Windows hosts, you can get comprehensive visibility into multi-cloud and multi-OS environments. Datadog’s custom Windows driver inspects all of the traffic flowing through local network interfaces and reports data, without sampling, to the Datadog Agent. Like CNM’s eBPF-powered system probe for Linux, our Windows driver runs with minimal overhead.
To enable Cloud Network Monitoring for Windows, just follow the steps in our documentation.
No endpoint left unmonitored
With CNM Windows support, you can visualize changes in your network topology, troubleshoot latency and connectivity issues, and iron out inefficiencies in your network architecture. If you don’t have a Datadog account, you can sign up for a free trial to start monitoring network flows across all of your infrastructure.


